BALKAN JOURNAL OF ELECTRICAL & COMPUTER ENGINEERING, April 2018
Copyright © BAJECE ISSN: 2147-284X http://www.bajece.com 42
Abstract— Data mining is the process of extracting meaningful
information from a large, raw data. These processes are carried out by various, detailed methods. And, the obtained results are used to make various interpretations and to draw conclusions. Deductions can either be made by interpreting the data after various operations or by plotting the data in various forms of graphs. This type of interpretation over graphics is called data mining through data visualization. Generating graphs that can be used to draw various conclusions on a telecommunications data set with the help of some packages included in the R program is presented in the paper. It does not require upper-level math skills to interpret these graphics; and everyone having knowledge about the industry and data set of the graphs has the ability to plot similar graphs and make analysis and interpretations regarding the results obtained on the data set at hand. In this study, R language was preferred as the software infrastructure for data mining applications, and graphs were plotted for interpretation through data visualization with data mining.
Index Terms— Data visualization with data mining, R,
Telecomunications.
I. INTRODUCTION
OWAYDS various data mining methods are being used to turn large and complex data into usable form of data. Applying these methods requires a certain amount of time. However, the numerical results obtained as a result of these analyses cannot be interpreted easily by everyone. In order to make sense of these results, analysis graphs are plotted to draw conclusions. In this way, interpretations on telecommunications data set is performed using graphs, without any analysis made through the data mining methods. With these graphs, it is aimed to make some deductions that need to be considered in terms of advertising campaigns and campaigns in the telecommunications industry, without even needing an in-depth analysis of the data.
M. S. BASARSLAN, is with Department of Computer Programming, School
of Advanced Vocational High School Istanbul Doğuş University, Istanbul, Turkey, (e-mail: [email protected]).
F. KAYAALP, is with Department of Computer Engineering, Düzce
University, Duzce, Turkey, (e-mail: [email protected]). Manuscript received September 13, 2017; accepted January 08, 2018. DOI: 10.17694/bajece.410243
In important situations such as presentation and in-house auditing, it can be difficult to access information on complex tables instantly, and it can be difficult to explain the data in the table to the audience. In such cases, visualization of the data to be acquired from the tables provides both convenience and effectiveness in business. This is possible thanks to the graphs plotted through visualization and data mining. In this study, the plotting of the graphs that can be used to draw various conclusions on a telecommunications data set was explained with the help of the packages included in the R program. It does not require upper-level math skills to interpret these graphics; and everyone having knowledge about the industry and data set of the graph has the ability to plot similar graphs and make analysis and interpretations regarding the results obtained on the data set at hand [1].
II. DATAMINING
There are various definitions of data mining. One of the mostly used definitions is obtaining usable information from complex data [2]. Data mining, or the knowledge discovery as called in the literature, is the process of extracting potentially useful and beneficial information in the complex and vast amounts of data. During this procedure, multiple scientific study fields are used. These fields of study are the data management systems, statistics, artificial intelligence and machine learning. The knowledge discovery on the data by combining all these fields together is called data mining [3]-[5]. In short, data mining is the search for relationships and rules in vast amounts of data using computers that will allow us to make estimations about the future [6].
III. VISUALIZATIONOFDATAWITHDATAMINING
Data visualization is the gathering of complex and scattered data in the classical format and presenting them in an understandable and interpretable forms through easily identifiable visuals or graphics.
Schematic structures can be abstracted while visualizing the data. Visual elements such as tables and graphs can be used to provide a clear information flow. Thus, cognitive processes such as comparison, interpretation and analysis can be performed more effectively and efficiently [7].
In parallel with technological developments, a continuous increase in the data size is observed. As a result of this
Data Mining Through Data Visualization: A
Case Study on Predicting Churners on
Telecomunications Data Set
M.S. Başarslan, F. Kayaalp
BALKAN JOURNAL OF ELECTRICAL & COMPUTER ENGINEERING, April 2018
Copyright © BAJECE ISSN: 2147-284X http://www.bajece.com 43
increase, it becomes very difficult to extract meaningful and usable information from the data. Especially the subscriber-based companies like telecommunications, banking, insurance and etc. aim to obtain profitable and efficient information by using the data at hand. For this reason, subscriber-based companies have data analysis departments or outsource this service to data analysis companies. The work done by these departments is to perform visualization by plotting graphs that employees in each unit of the company can understand. By means of data visualization, the data become meaningful without requiring knowledge of mathematics and statistics to interpret the data in an efficient and easy manner.
IV. CUSTOMERCHURNANALYSIS
In subscriber-based industries, the analysis carried out to prevent loss of existing customers is called churn analysis. It is a method of analysis that is typically used in telecommunications, banking or insurance industries for predicting the churn of current customers so as not to loose the customers. Thanks to these estimates, solutions can be generated within the scope of customer relationship management (CRM) to prevent customer churn. In the literature, the terms customer attrition, customer churn, customer turnover, customer defection are also used for the same concept Customer churn is of great importance in the subscriber-based industries such as telecommunications, banking, and insurance, because retaining existing customers requires lower cost than gaining new customers in general [8].
V. THETELECOMUNICATIONSDATASETSTUDIED
The telecommunications data set includes 8000 customer records and 20 variables which has been taken from one of the major telecommunications company of Turkey for a period of 10 months. The names, explanations and data types of these 20 variables are shown in Table 1.
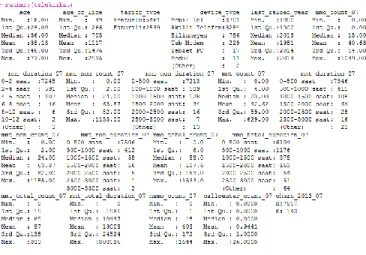
Fig.1. Overview of the Data Set
Figure 1 shows a summary of the telecommunication data set.
TABLE I ALL THE VARIABLES,
VARIABLES, FORMATS AND TYPES RELATED TO TELECOMMUNICATION DATA SET
Attribute Description Data type
age Age Numerical
age_of_line Customer lifetime duration Numerical tariff_type Tariff type (Postpaid, Prepaid) Nominal device_type Device type, Smartphone,
Laptop, etc. Nominal
last_reload_year Last reload date (for Prepaid
subscribers) Nominal
mmo_count_07
Monthly number of conversations with its own subscribers (Call)
Numerical
mmo_duration_07 Monthly talk time with its own
subscribers (Call) Numerical mmt_count_07
Monthly number of conversations with its own subscribers (In call)
Numerical
mmt_duration _07 Monthly talk time with its own subscribers (In call) Numerical
mmo_non_count
Number of Monthly Calls Made with Other Operators (Call)
Numerical
mmo_non_duration
Monthly Talk Time with Subscribers in Other Operators (Call - min.)
Numerical
mmt_non_count
Number of Monthly Calls Made with Subscribes in Other Operators (In call)
Numerical
mmt_non_duration
Monthly Talk Time with Subscribers in Other Operators (In call)
Numerical
mmo_total_count Number of Total Monthly Calls (Call) Numerical mmo_total_duration Monthly Total Talk Time (Call) Numerical mmt_total_count Number of Total Monthly Calls
(Call) Numerical
mmt_total_duration Monthly Total Talk Time (In
call) Numerical
msmo_count_07 Number of SMSs per month Numerical callcenter_count_07 Monthly Call Center Complaints Call Count Numerical Churn_2013_07 Subscriber churned? Binary
VI. CUSTOMERCHURNANALYSISAPPLICATION THROUGHVISUALIZATION
In this study, the plotting of the graphs that can be used to draw various conclusions on a telecommunications data set was explained with the help of the packages included in the R program. It does not require advanced-level analytical skills to interpret these graphics; and everyone with professional knowledge on the issue and industry can plot similar graphs and make analysis and interpretations regarding the results obtained on the data set at hand.
In this section, a study on density and violin graphics with the help of the R graphic packages will be discussed [9]. In plotting these graphs, customer lifetime and churn status in a telecommunications operator were grouped and interpreted according to categorical attributes.
BALKAN JOURNAL OF ELECTRICAL & COMPUTER ENGINEERING, April 2018
Copyright © BAJECE ISSN: 2147-284X http://www.bajece.com 44
A. Graphics Obtained By Density Graphics
In this section, interpretations on the density graph obtained with the ggpllot2 package of the R is discussed.
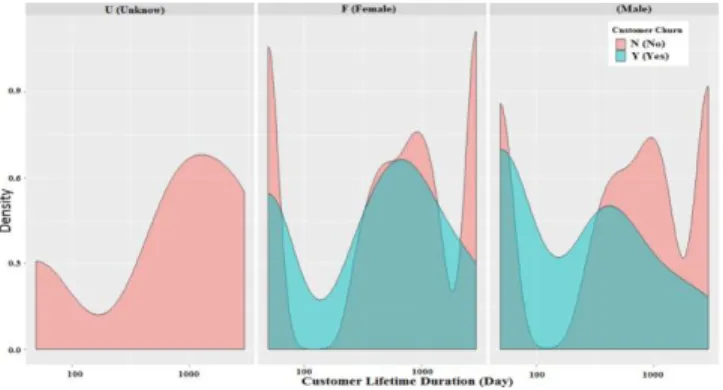
Fig.2. Grouping of Customer Lifetime and Churn Attributes by Gender
Figure 2 shows the churn status of the customers of female, male and unknown gender. According to the graph in Figure 2, churn status yes (Y) of males (M) is more instable than females (F). It is seen that none of the subscribers with unknown gender information churned (N).
Head and shoulders shots of authors which appear at the end of our papers.
Fig.3. Grouping of Customer lifetime and churn attributes by age
The interpretation that can be made on the graph in Figure 3 is that users over 65 years of age do not churn (N) and use their phones only for making calls. There is a continuous fluctuation in the 16-24 and 25-44 age groups, and it can be said that they probably use smartphones and are looking for various campaigns.
Fig.4. Grouping of Customer lifetime and churn attributes by the subscriber tariff type
Figure 4 shows that the rate of churn is higher in prepaid subscribers than the postpaid subscribers. This may be due to long-term contracts of postpaid subscribers.
B. Graphics Obtained By Violin Graphics
In this section, interpretations on the violin graph obtained with the ggplot2 package of the R is discussed.
Fig.5. Grouping of Customer Lifetime and Churn Attributes by Gender
It is seen in the not-churned (N) section of the graph in Figure 5 that the churn of subscribers with unknown gender and male subscribers was more unstable than the churn of females. A similar interpretation is also made in the density graph.
Fig.6. Grouping of Customer Lifetime and Churn Attributes by Age
The graph in Figure 6 shows that users who are over 65 years old are less likely to churn and that they only use their phones for making calls, similar to the interpretation of the density graph. There are various fluctuations in other age groups. Customer churn (Y) is observed to be low in young people in the 16-24 age group compared to the ones in the 25-44 age group.
In the graph in Figure 7, it can be seen that the tendency to churn (Y) is higher in prepaid subscribers compared to postpaid subscribers. This interpretation is observed to be the same in the density graph.
BALKAN JOURNAL OF ELECTRICAL & COMPUTER ENGINEERING, April 2018
Copyright © BAJECE ISSN: 2147-284X http://www.bajece.com 45
Fig.7. Grouping of Customer Lifetime and Churn Attributes by the Subscriber Tariff Type
VII. CONCLUSION
The main objective of this study is to develop a data visualization application that allows to obtain interpretable graphs without being overwhelmed by data mining methods. In the study, the complementary and verifying results obtained by density and violin packages of the R software were presented by using a telecommunications data set.
In this regard, it is observed that everyone having knowledge about the industry and data set of the graph has the ability to plot similar graphs and make interpretations on the results obtained. Therefore, it is now quite easy to plot and interpret graphs suitable for any data set.
REFERENCES
[1] M. Kutlu, C. Küçüközmen, F. Çınar, Büyük Veri Analizi, Görselleştirme
ve Risk Yönetimi, 12 Şubat 2015. [Online]. Available: https://tr.linkedin.com/pulse/d%C3%BCnya-dillerine-en-son-ve-bir-yenisi-olarak-r-dili-analitik-%C3%A7inar.
[2] Y. Özkan. Veri Madenciliği Yöntemleri, Türkiye: Papatya yayıncılık, 2013
[3] J. Han, M. Kamber, Data Mining: Concepts and Techniques, USA: Morgan Kaufmann Publisher, 2000.
[4] G.S. Gordon M. Berry. Mastering data mining, USA: John Willey and Sons, 2000.
[5] L.B. Ayre, Data Mining For Information Professionals, San Diego, California: USA, 2006.
[6] E. Alpaydın, “Ham veriden altın bilgiye ulaşma yöntemleri,” Bilişim 2000 Eğitim Semineri, İstanbul, Türkiye, 2000.
[7] Anonymous, Veri Görselleştirme Nedir,, 15 Mart 2016. [Online]. Available: http://www.verigorsellestirme.com/veri-gorsellestirme-nedir/ [8] S. E. Seker, “Customer churn analysis”, YBS Ansiklopedi, Vol. 3, No.
1, 2016.
[9] W. Hadley, C. Winston, KMggplot2, 30 Aralık 2016. [Online]. Access: https://cran.r-project.org/ packages/RcmdrPlugin.KMggplot2.
BIOGRAPHIES
Muhammet Sinan BAŞARSLAN Recevied the BS
Degree in Computer Science from Düzce University in 2015, the MS Degree in Computer Science from Düzce University in 2017. Currently he is working as an Instructor in Doğuş University. His primary research interests include datamining, machine learning, Internet of Things, Artificial Intelligence and web technologies.
Fatih KAYAALP Recevied the BS Degree in
Computer Science from Marmara University in 2000, the MS Degree in Computer Science from Sakarya University in 2005, and the PhD Degree in Computer Science from Sakarya University in 2014. Currently he is working as an Assistant Professor in Duzce University. His primary research interests include databases, web technologies, computer networks, wireless sensor networks and mobile computing.