See discussions, stats, and author profiles for this publication at: https://www.researchgate.net/publication/237627311
CLASSIFICATION OF CLOSEDAND OPENSHELL
PISTACHIO NUTS USING VOICERECOGNITION
TECHNOLOGY
Article Source: OAI CITATIONS19
READS72
3 authors: A. Enis Cetin Bilkent University 280 PUBLICATIONS 3,924 CITATIONS SEE PROFILE T.C. Pearson United States Department of Agriculture 85 PUBLICATIONS 1,264 CITATIONS SEE PROFILE Ahmed Tewfik University of Texas at Austin 563 PUBLICATIONS 9,424 CITATIONS SEE PROFILEAll content following this page was uploaded by Ahmed Tewfik on 22 March 2016.
C
LASSIFICATION
OF
C
LOSED
−
AND
O
PEN
−S
HELL
P
ISTACHIO
N
UTS
U
SING
V
OICE
−R
ECOGNITION
T
ECHNOLOGY
A. E. Cetin, T. C. Pearson, A. H. Tewfik
ABSTRACT. An algorithm using speech recognition technology was developed to distinguish pistachio nuts with closed shells
from those with open shells. It was observed that upon impact with a steel plate, nuts with closed shells emit different sounds than nuts with open shells. Features extracted from the sound signals consisted of mel−cepstrum coefficients and eigenvalues obtained from the principle component analysis (PCA) of the autocorrelation matrix of the sound signals. Classification of a sound signal was performed by linearly combining the mel−cepstrum and PCA feature vectors. An important property of the algorithm is that it is easily trainable, as are most speech−recognition algorithms. During the training phase, sounds of nuts with closed shells and with open shells were used to obtain a representative vector of each class. During the recognition phase, the feature vector from the sample under question was compared with representative vectors. The classification accura-cy of closed−shell nuts was more than 99% on the validation set, which did not include the training set.
Keywords. Acoustic, Pistachio, Recognition, Sound.
n acoustical sorting system was developed by Pearson (2001) to separate pistachio nuts with closed shells from those with open shells. The sorting system included a microphone, digital signal−processing hardware, material handling equipment, and an air−reject mechanism. Upon impact with a steel plate, nuts with closed shells emitted different sounds than nuts with open shells. In Pearson’s study (2001), linear discrimi-nant analysis was used to classify nuts using three features ex-tracted from the microphone signal during the first 1.4 ms after impact. One of the discriminant features was the inte-grated absolute value of the microphone output signal during the first 0.11 ms after impact. The other two features were the number of data points in the digitized microphone signal, be-tween 0.6 and 1.4 ms after impact, having a slope and signal magnitudes below different preset threshold levels. Classifi-cation accuracy of this system was approximately 97% with a throughput rate of approximately 40 nuts/s. Although the frequency spectra from acoustics emitted from closed− and open−shell nuts were found to have general differences, sim-ple features from the frequency spectra (frequency corre-sponding to largest magnitude, and combinations of individual spectra magnitudes) were not found to be as useful for accurate classification of nuts (Pearson, 2001). Currently, closed−shell pistachio nuts are removed by mechanical de-vices, which have a lower classification accuracy (~95%) and
Article was submitted for review in July 2003; approved for publication by the Information & Electrical Technologies Division of ASAE in February 2004.
The authors are A. Enis Cetin, Professor, Department of Electrical and Electronics Engineering, Bilkent University, Ankara, Turkey; Tom C.
Pearson, ASAE Member Engineer, Agricultural Engineer, USDA−ARS−
GMPRC, Manhattan, Kansas; and Ahmed H. Tewfik, Professor, Department of Electrical and Computer Engineering, University of Minnesota, Minneapolis, Minnesota. Corresponding author: Tom Pearson, USDA−ARS, 1515 College Ave, Manhattan, KS 66502; phone: 785−776−2726; fax: 785−776−2792; e−mail: [email protected].
can damage kernels in open−shell pistachios by pricking them with a needle. The needle hole can give the appearance of an insect tunnel and cause rejection by the consumer. The acoustic−based system does not cause such damage. In-creased sorting accuracy of the acoustic sorter, coupled with low cost of the hardware, enables a payback period of less than one year.
In automatic speech recognition, words are usually recognized as a series of sub−word sounds called phonemes (Gold and Nelson, 2000). There can be several phonemes in a typical word, so the extraction of features must be continually performed in adjacent and sometimes overlap-ping short−time windows. A typical word may last about one second, and the corresponding speech signal for one word may contain 10,000 or more digitized samples. This signal is divided into short−time windows of 10 to 30 ms duration, containing about 250 samples each. In order to capture and identify all phonemes of a word, a set of features is necessary from each short−time window. Given a sequence of features obtained from an utterance, a pattern classifier is used to determine the final result. In speech recognition, a set of hidden Markov models or neural networks (Gold and Nelson, 2000; Quatieri, 2001) determines the corresponding word in the vocabulary of the recognition system. Parameters of the hidden Markov models are estimated from the feature vectors of the training data. In speaker identification, Gaussian−mix-ture models determine the speaker among a set of speakers from the feature vectors (Furui, 1981; Reynolds and Rose, 1995).
The most common features used in modern speech−recog-nition systems are called mel−cepstrum coefficients. These features are extracted from the speech signal with the help of short−time Fourier transforms (Quatieri, 2001; Young, 1996; Jabloun et al., 1999; Erzin et al., 1995). The concept of cepstrum, which is a discrete cosine transform of the log−spectrum of a signal, was introduced as a signal analysis tool by Tukey in the 1960s (Oppenheim and Schafer, 1975). It is used in many applications ranging from noise removal
660 TRANSACTIONSOFTHE ASAE
in audio to signal and image reconstruction from partial Fourier domain information (Quatieri, 2001; Cetin and Ansari, 1988). Mel−cepstrum is a modified version of the cepstrum and was designed to exploit the human auditory system by dividing the frequency domain in a non−uniform manner during cepstrum computation.
In addition to mel−cepstrum coefficients, eigenvalues obtained from principle component analysis (PCA) of the autocorrelation matrix of sound signal data sets are common-ly used feature vectors for modeling the spectrum of sound signals. Similar to every other automatic recognition algo-rithm, PCA−based systems also consist of two phases: training and recognition. In the training phase, feature vectors representing each data class are estimated from the training data. In the recognition phase, the feature vector of the current data is compared with the representative feature vector of each class. Principle component analysis has been widely studied in signal processing. Turk and Pentland (1991) used PCA projections as feature vectors to solve the problem of face recognition in images, using Euclidean distance as the similarity function. In this approach, the correlation matrix of the training data is first obtained, and its eigenvalues and eigenvectors are determined.
In this study, a new classification algorithm based on discriminating features used for voice−recognition systems is proposed for distinguishing acoustical impact emissions from pistachio nuts with closed and open shells. Given that voice recognition systems were developed as a generic signal−processing method to recognize a large vocabulary of words from a variety of speakers, this method has the potential to broaden the number of applications currently possessed by the acoustic sorter, as this same method can be applied to many different applications (Quatieri, 2001). In contrast, the specific algorithm developed by Pearson (2001) for recognizing open− and closed−shell nuts is specific to this one application.
M
ATERIALS ANDM
ETHODSSORTING SYSTEM
The experimental setup is described in detail in Pearson (2001). The system was designed to feed pistachio nuts to an impact surface, acquire the sound signal upon impact, process the data, and then divert the product into either an open−shell or closed−shell stream. The impact plate was made of a 50.8 mm wide by 50.8 mm thick polished stainless steel bar. The large thickness was required to minimize vibrations of the bar when impacted by a pistachio nut. A highly directional microphone (ME67 with K6 powering module, Sennheiser Electronics Corporation, Old Lyme, Conn.) was used to minimize the effect of ambient noise. The sound data was sampled at 250 kHz with a digital signal processing card (model 310, Delanco Spry, Rochester, N.Y.). When a pistachio impacted onto the plate, the microphone output signal ranged from 0 to ±0.7 V. Data acquisition began when the microphone output rose above 0.085 V. This threshold level was sufficient to trigger acquisition on virtually all nuts while preventing false triggering from ambient sound. Data acquisition continued for 1.4 ms after triggering, producing 350 data points. Impact sounds from sets of 300 closed− and 300 open−shell nuts (Kerman variety, 6% moisture dry basis, 2000 harvest) were collected from the
pistachio process stream just before mechanical closed− and open−shell separation. This set of nuts contained a variety of nut sizes (11 to 15 mm diameter). Nuts are not usually sized before open− and closed−shell separation, so no effort was made to obtain nuts of a specific size. Pistachio processors control moisture content of the nuts to keep them between 5% and 7% to maintain quality (Kadar et al., 1980). Nuts within this range of moisture do not exhibit different acoustic properties (Pearson, 2001). Finally, Kerman variety nuts are the only variety of commercial importance in the U.S.; therefore, other varieties were not studied. Training and recognition of nut−split types was carried out with different subsets, as will be discussed later. After training on this set of nuts, the algorithm was applied to three additional sets of nuts (each containing 300 open shell and 300 closed shell) having different size categories. One set contained relatively small nuts (10 to 13 mm diameter), a second set contained medium nuts (12 to 14 mm diameter), and a third set contained large nuts (13 to 16 mm diameter).
FEATURE EXTRACTION
Three different sets of features were used for classifying pistachio sounds as open or closed shell:
S Eigenvalues from PCA of the mel−cepstrum coefficients alone.
S Eigenvalues from PCA of sound amplitudes alone. Sound data (x) was normalized by the Euclidian norm of each sound vector, and the absolute value of sound samples was used instead of actual sound samples, i.e., xn(l) = | x(l) | /
|| x ||, l = 1, 2, 3,..., N is used in PCA analysis instead of actu-al sound samples, x(l).
S Eigenvalues from PCA of both the normalized sound am-plitudes linearly combined with eigenvalues from PCA of the mel−cepstrum coefficients.
MEL−CEPSTRUM COMPUTATION
The duration of the impact sound from pistachio nuts is much shorter than a typical word and some phonemes; therefore, only one short−time window, of duration 1.4 ms, was used, and only one set of mel−cepstrum coefficients was computed for each nut. Let x be a vector containing N sound samples; mel−cepstrum coefficients are obtained by the following computations:
S Discrete Fourier transform (DFT) x^ of the data vector x
is computed using the FFT algorithm and a Hanning win-dow.
S The DFT ( x^) is divided into M non−uniform sub−bands,
and the energy (ei, i = 1, 2,..., M) of each sub−band is
esti-mated. The energy of each sub−band is defined as
( )
∑
= = q p l i le ^x 2, where p and q are the indices of sub−band edges in the DFT domain. The sub−bands are distributed across the frequency domain according to a “mel−scale,” which is linear at low frequencies and logarithmic thereaf-ter. This mimics the frequency resolution of the human ear. Below 10 kHz, the DFT is divided linearly into 12 bands. At higher frequency bands, covering 10 to 44 kHz, the sub−bands are divided in a logarithmic man-ner into 12 sections. In this case, the Fourier domain is di-vided linearly into 12 bands below 10 kHz, and the frequency range covering higher frequencies from 10 to
44 kHz is divided in a logarithmic manner into 12 sections. Therefore, more emphasis is given to low−frequency in-formation than to high−frequency data. In other words, the DFT coefficients are grouped into M = 24 sub−bands in a non−uniform manner.
S The mel−cepstrum vector (c = [c1, c2,..., cK]) is computed
from the discrete cosine transform (DCT) (Ahmed et al., 1974):
( )
e[
k(
i .)
]
c M i i k log cos 05 1 − =∑
= pńM , k = 1, 2,..., K (1)where the size of the mel−cepstrum vector (K) is much small-er than data size N. The mel−cepstrum sequence is a decaying sequence for sound signals. A value of 20 was chosen for K, as coefficients with an index greater than K = 20 are usually negligible. The DCT has the effect of compressing the log− spectrum, thereby providing a small set of coefficients repre-senting most of the variance of the original data set. Another advantage of the DCT is that it is close to the optimum Karhu-nen−Loeve transform (Jayant and Noll, 1984) of highly cor-related random processes; thus, it approximately de−correlates the mel−scale logarithmic sub−band energies. The basis of the DCT resembles the basis of the Karhunen− Loeve transform, which is obtained by eigen−analysis of the autocorrelation matrix of the data. De−correlated cients are more suitable to modeling than correlated coeffi-cients. In automatic speech and speaker recognition, it is observed that mel−cepstrum coefficients (ck) give better
rec-ognition performance than sub−band energies (ei) or
logarith-mic sub−band energies, log(ei) (Quatieri, 2001).
PRINCIPLE COMPONENT COMPUTATION
Let C be the correlation or covariance matrix: ] ) )( [(x xm x xm T E C= − − (2)
where x represents the random sound vector, and xm is the
mean of x. The matrix C is an N × N matrix, where N is the size of data vector x. The eigenvectors of this matrix repre-sent the projection axes, or eigen−sounds of the data, and the eigenvalues represent the projection variance of the corre-sponding eigen−sound. Large eigenvalues of C are usually chosen as feature vectors, as these explain most of the vari-ance of the original data set before the transformation.
The correlation matrix is estimated from the training set of L sound vectors (x1, x2,..., xL) as follows: Let X = [(x1 − xm)
(x2 − xm)... (xL − xm)] be the matrix of the training vectors
obtained by concatenating the sound vectors. The mean vector (xm) is the average vector of the data set. An estimate
of C is given by Ce = XXT. The rank of matrix Ce is less than
or equal to L. Usually, the training vectors are linearly independent of each other; therefore, Ce has L non−zero
eigenvalues: k k k T u l u XX = , k = 1, 2,..., L (3)
where lk and uk are the eigenvalues and eigenvectors of Ce,
respectively. The largest L4 out of L eigenvalues are usually selected as a representative set of data, and the corresponding eigenvectors are used in the PCA analysis−based recognition systems.
Projections of a sound vector (x) onto the first L1
eigenvectors define a feature vector representing the signal x:
1 , 2 , 1 , x ... xL x x = [ω ω ω ω ] (4) where ).ωx,k =uk⋅(x−xm
In some practical situations, Ce is too large for eigenvalue
and eigenvector estimation. This was the case with the pistachio data set used in this study, as x contains N = 350 sound samples. This difficulty can be overcome by noting that the eigensystem of XTX has the same non−zero eigenvalues as Ce, since XXTXuk = lkXuk, where lk and uk are
the eigenvalues and eigenvectors of Ce, respectively. As a
result, the reduced eigensystem of XTX∈RLxL can be solved instead of Ce, as the size of the training set (L) is
usually less than the number of samples (N) in each data vector (x). The new eigenvalues are the same as eigenvalues of the original system, but eigenvectors are wk =Xuk.
TRAINING PHASE
In the pistachio recognition case, there are two classes of data: open shell and closed shell. Assume there are L/2 closed−shell nut sounds (x1, x2,..., xL/2) and L/2 open−shell
nut sounds (xL/2+1,..., xL). In the training phase of the
algorithm, this data is projected onto the eigenvectors, and the results are averaged to find a representative feature vector for each class. Let wo be the representative feature vector of
open−shell nuts: , 2 , 1 , o ... o o o ω ω ω ω = [ L1] (5) where
∑
= ⋅ − = ω /2 1 , ( ) 2L i m i k k o u x x L , k = 1, 2,..., L1 (6) Similarly, let w1 be the representative feature vector ofclosed−shell nuts: 1 , 1 2 , 1 1 , 1 1= ω ω ...ω L ω [ ] (7)
where w1,k is obtained, as in equation 6, from the rest of the
training data set.
The training phase of the algorithm is completed when wo
and w1 are obtained from the training data set. Training was
attempted with L/2 values of 5, 10, 15, 18, 20, and 30 nuts from each split category, and 280 nuts from each split type that were not used in the training set were used to validate the classification accuracy. However, in the case where 30 nuts from each split type were used in the training set, the remaining 270 nuts were used to validate classification accuracy in the recognition phase. In all cases, except where five nuts from each split type were used in the training set (L/2 = 5), only the eigenvectors corresponding to the 10 largest eigenvalues were used to find the representative vectors of closed− and open−shell nuts, i.e., the size of the feature vector was L1 = 10. For the training case where L/2 =
5, only the five largest eigenvalues were computed, i.e., L1=
5.
RECOGNITION PHASE
During the recognition phase of the algorithm, features are extracted from the current sound data and compared with the representative feature vectors of each class. Given a vector of sound data (x), its projection (wx) onto the eigenvectors
662 TRANSACTIONSOFTHE ASAE
between this feature vector (wx) and wo and w1 is computed.
If: 1 ω − ω < ω − ωx o x (8)
then it is assumed that the current sound vector (x) belongs to the open−shell nut class. Otherwise, it is assumed that it belongs to the closed−shell nut class.
MEL−CEPSTRUM BASED PCA OF SOUND DATA
In this case, the correlation matrix is defined in terms of the mel−cepstrum vectors instead of the sound vectors:
(
)(
)
[
T]
m m c c c c E C= − − (9)where cm is the mean of the mel−cepstrum vectors. This time,
matrix C is a K × K matrix, where K is the size of the mel− cepstrum vector (c). Matrix C is estimated as follows: Ce =
XXT, where X = [(c
1 − cm) (c2 − cm)... (cL − cm)] is the matrix
of the training vectors obtained by combining the mel−cep-strum vectors of L training sounds. The mean vector (cm) is
the average vector of the data set. Eigenvalues (lk) and
eigen-vectors (vk) of Ce are computed as in equation 3. Training and
recognition phases are the same as above, except that the sound vectors are replaced by mel−cepstrum vectors. During the recognition phase, the impact sound of a nut is used to compute the corresponding mel−cepstrum vector (c) using equation 1. Then, its projection onto the first L1 eigenvectors
of Ce is computed as follows: , 2 , 1 , c ... c c c ω ω ω ω = [ L1] (10)
where ωc,k =vk⋅
(
c−cm)
. The Euclidian distances to repre-sentative vectors of each class ωc−ωa and ωc−ωb are computed to classify the nut sound. The representative vec-tors wa and wb of each class are defined as in equations 5 to7, except that the training sound vectors are replaced by their mel−cepstrum vectors: , 2 , 1 , a ... a a a ω ω ω ω = [ L1] (11) where
(
)
∑
= ⋅ − = 2 1 2L/ i i m k a,k v c c L w , k = 1, 2,..., L1 (12)and ci represents the training mel−cepstrum vectors of the
open−shell nuts. Similarly, the vector wb is obtained using the
training vectors of the closed−shell nuts.
For the case in which both eigenvalues from PCA of the sound amplitudes and eigenvalues from PCA of mel−cepstral features are used together, a feature vector representing eigenvectors of the sound data was computed using equations 4 and 5. This vector was compared to the representative vectors of each class, and distances were computed as in equation 8. Then, a mel−cepstrum vector representing the same sound data was computed and compared with the mel−cepstrum vectors of each class. A final decision was based on the sum of the sound amplitude−based PCA and the mel−cepstral analysis−based PCA. We simply linearly combined the distances to the representative vectors to reach a final decision, i.e., we
compared α ωx−ωo +β ωc−ωa with α ωx−ω1 + b
c−ω ω
β to determine if the nut was an open−shell nut or a closed−shell nut. In this case, the weights a and b were simply set to 1.
It should be pointed out that the computational cost of this scheme during the recognition phase is not high. During the recognition phase, L1 inner products are computed.
Com-putationally expensive eigen−analysis is only carried out during the training phase, which can be implemented off line (Kuhn et al., 2000).
R
ESULTS ANDD
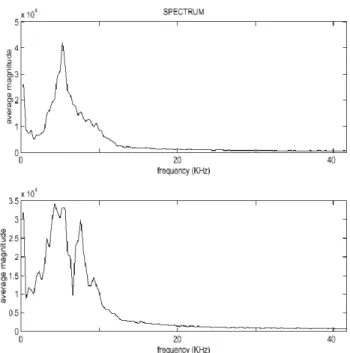
ISCUSSIONAverage frequency spectra from closed− and open−shell pistachio nuts are shown in figure 1. Closed−shell nuts have a broader frequency spectra, with a notable dip near 7 kHz. It appears that the mel−scale should be very suitable for distinguishing closed− and open−shell pistachios, as most of the impact sound energy lies at low frequencies, as shown in figure 1.
In table 1, classification results based on PCA of sound amplitudes are presented. The first column lists the number of training sounds for each class. The second and third columns list the percentage of correctly classified closed− and open−shell nuts in the validation set containing 280 sounds, except for the bottom row in which the validation set size was 270 because 30 nuts were used for training.
Only two out of 280 closed−shell nuts were misclassified in all cases, corresponding to 99.3% recognition accuracy for closed−shell nuts. The number of misclassified open−shell nuts decreased as the number of training sounds increased, up to the case in which 20 sound vectors were used in training each representative vector. Beyond this level, improvement in the recognition performance was not observed.
Figure 1. Spectra of impact sounds. The top plot was obtained by averag-ing the spectra of impact sounds of 20 open−shell nuts and the bottom by averaging 20 closed−shell nuts.
Table 1. Classification results for PCA of sound amplitudes. The second and third columns present the percent of correctly classified closed−
and open−shell nuts in a validation set containing 280 impact nuts.
No. of Training Nuts Closed Open
5 99.3 87.9 10 99.3 92.1 15 99.3 91.4 18 99.3 92.1 20 99.3 92.5 30[a] 99.3 92.5
[a] The validation set consisted of 270 nuts.
Table 2. Classification results for PCA of mel−cepstrum coefficients. The second and third columns present the percent of correctly
classified closed− and open−shell nuts in a validation set containing 280 sounds.
No. of Training Nuts Closed Open
5 76.7 100
10 82.9 100
15 91.8 100
20 93.2 100
In table 2, classification results based on PCA of the mel−cepstrum coefficients are presented. The first column lists the number of nuts used for training for each class. The second and third columns list the percentage of correctly classified closed− and open−shell nuts in the validation set containing 280 sounds. Open−shell nuts were correctly classified in all cases.
The method based on PCA features of sound amplitudes classified closed−shell nuts more accurately than open−shell nuts. On the other hand, the method based on mel−cepstral features classified open−shell nuts more accurately than closed−shell nuts, as shown in table 2. The most accurate recognition results were obtained when PCA of sound amplitudes was combined with mel−cepstral features, as summarized in table 3.
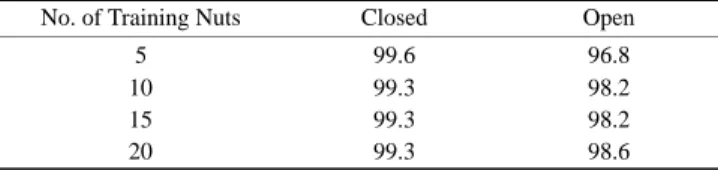
The number of misclassified open−shell nuts dropped to four, which corresponds to 98.6% recognition accuracy in open−shell nuts when the training set comprised 20 closed− shell nuts and 20 open−shell nuts (bottom row of table 3). Recognition accuracy of the closed−shell nuts remained the same (99.3%) after linear combination. This approach is similar to the use of a compound feature vector for representing speech data (Young, 1996). For example, a common software for developing voice−recognition sys-tems, Hidden Markov Tool Kit (HTK), uses both mel−cep-strum and differential cepmel−cep-strum, as well as signal energy, in recognition.
Applying the PCA of sound amplitudes combined with mel−cepstral features algorithm to sets of nuts having different sizes yielded comparable results, as shown in table 4. The medium−sized nuts had the highest accuracy, but only by approximately 2.5% over the closed−shell small and large nuts. Accuracy for the open−shell nuts varied only by 0.7% for the three nuts sizes. The average accuracy for all three size categories and the mixed set were 96.8% for closed shell and 98.9% for open shell. Using the same four data sets, the discriminant analysis routine described by Pearson (2001) classified the open−shell nuts with an average accuracy of 96.8% and the closed−shell nuts with an average accuracy of 98.8% (table 4). Thus, the method developed in this study appears to offer similar classification accuracy as
Table 3. Classification results for both PCA of sound amplitudes and mel−cepstrum coefficients. The second and third columns present
the percent of correctly classified closed− and open−shell nuts in a validation set containing 280 sounds.
No. of Training Nuts Closed Open
5 99.6 96.8
10 99.3 98.2
15 99.3 98.2
20 99.3 98.6
Table 4. Classification results for both PCA of sound amplitudes and mel−cepstrum coefficients using 20 training nuts and applied to nuts from different size categories. The results from the discriminant
method (Pearson, 2001) applied to the same nuts are given for comparison purposes. The values represent the
percent of correctly classified nuts.
Nut
PCA of Sound Amplitudes and Mel−Cepstrum Coefficients Discriminant Method (Pearson, 2001) Nut
Size[a] Closed Open Closed Open
Small 95.4 98.9 98.7 97.7
Medium 97.9 99.3 100 94.0
Large 94.6 98.6 98.3 98.3
Mixed 99.3 98.6 98.0 97.0
Average 96.8 98.9 98.8 96.8
[a] Small = 10−13 mm dia., medium = 12−14 mm dia., large = 13−16 mm
dia., and mixed = 11−15 mm dia.
the discriminant analysis method. However, since the accura-cies of the two methods are very close, a large amount of data would be needed to determine which method is most accu-rate. The primary advantage of the method developed in this study is that it is much more easily trained, and since it is based on methods used to distinguish characteristics of speech, it is perhaps more adaptable to other applications.
C
ONCLUSIONA method, based on voice−recognition technology, was developed for detecting open− and closed−shell pistachio nuts based on their impact acoustics. The method appears to be as accurate as the method developed by Pearson (2001). Most importantly, this method is easily trainable and may work for other types of pistachio defects or inspection of other agricultural products. This will be the basis of future study.
R
EFERENCESAhmed, N., T. Natarajan, and K. Rao. 1974. Discrete cosine transform. IEEE Trans. Computers 23(1): 90−93.
Cetin, A. E., and R. Ansari. 1988. A convolution−based framework for signal recovery and applications. J. Optical Soc. America A 5(8): 1193−1200.
Erzin, E., A. E. Cetin, and Y. Yardimci. 1995. Sub−band analysis for robust speech recognition in the presence of car noise. In
Proc. IEEE Int. Conf. on Acoustics, Speech, and Signal Processing 1: 417−420. Piscataway, N.J.: IEEE Press.
Furui, S., 1981. Cepstral analysis technique for automatic speaker verification. IEEE Trans. Acoustics, Speech, and Signal
Processing 29(4): 254−272.
Gold, B., and N. Nelson. 2000. Speech and Audio Signal
Processing: Processing and Perception of Speech andMusic.
664 TRANSACTIONSOFTHE ASAE
Jabloun, F., A. E. Cetin, and E. Erzin. 1999. Teager energy−based feature parameters for speech recognition in car noise. IEEE
Signal Processing Letters 6(10): 259−261.
Jayant, N. S., and P. Noll. 1984. Digital Coding of Waveforms. Englewood Cliffs, N. J.: Prentice−Hall.
Kader, A. A., J. M. Labavitch, F. G. Mitchell, and N. F. Sommer. 1980. Progress report (24 Oct. 80): Quality and safety of pistachio nuts as influenced by post−harvest handling procedures. In Annual Report, 44−51. Bakersfield, Cal.: California Pistachio Association.
Kuhn, R., J. C. Junqua, P. Nguyen, and N. Niedzielski. 2000. Rapid−speaker adaptation in eigenvoice space. IEEETrans. Speech and Audio Processing 8(6): 695−707.
Oppenheim, A. V., and R. W. Schafer. 1975. Digital Signal
Processing. Englewood Cliffs, N. J.: Prentice−Hall.
Pearson, T. C., 2001. Detection of pistachio nuts with closed shells using impact acoustics. Applied Eng. in Agric. 17(2): 249−253. Quatieri, T. F., 2001. Discrete−Time Speech Signal Processing:
Principles and Practice. New York, N.Y.: Prentice Hall PTR. Reynolds, D. A., and R. C. Rose. 1995. Robust text−independent
speaker identification using Gaussian−mixture speaker models.
IEEE Trans. Speech and Audio Processing 3(1): 72−83.
Turk, M., and A. Pentland. 1991. Eigenfaces for recognition. J.
Neuroscience 3(1): 71−86.
Young, S. J. 1996. Large vocabulary continuous speech
recognition: A review. IEEE Signal Processing Magazine 13(5): 45−57.
View publication stats View publication stats