Full Terms & Conditions of access and use can be found at
http://www.tandfonline.com/action/journalInformation?journalCode=ines20
International Journal of Neuroscience
ISSN: 0020-7454 (Print) 1543-5245 (Online) Journal homepage: http://www.tandfonline.com/loi/ines20
Assessment of the effect of cigarette smoking on
regional brain volumes and lesion load in patients
with clinically isolated syndrome
Gamze Durhan, Sevda Diker, Arzu Ceylan Has, Jale Karakaya, Asli Tuncer
Kurne, Rana Karabudak & Kader K. Oguz
To cite this article: Gamze Durhan, Sevda Diker, Arzu Ceylan Has, Jale Karakaya, Asli Tuncer Kurne, Rana Karabudak & Kader K. Oguz (2016) Assessment of the effect of cigarette smoking on regional brain volumes and lesion load in patients with clinically isolated syndrome, International Journal of Neuroscience, 126:9, 805-811, DOI: 10.3109/00207454.2015.1073727
To link to this article: https://doi.org/10.3109/00207454.2015.1073727
Accepted author version posted online: 13 Aug 2015.
Published online: 04 Sep 2015. Submit your article to this journal
Article views: 174
View related articles
View Crossmark data
ISSN: 0020-7454 print / 1543-5245 online DOI: 10.3109/00207454.2015.1073727
ORIGINAL ARTICLES
Assessment of the effect of cigarette smoking on regional
brain volumes and lesion load in patients with clinically
isolated syndrome
Gamze Durhan,
1Sevda Diker,
2Arzu Ceylan Has,
3Jale Karakaya,
4Asli Tuncer Kurne,
2Rana Karabudak,
2and Kader K. Oguz
3,51Department of Radiology, Ministry of Health Ankara Training and Research Hospital, Ankara, Turkey;2Department of Neurology, Hacettepe University Medical School, Ankara, Turkey;3National Magnetic Resonance Research Center (UMRAM), Bilkent University, Ankara, Turkey;4Department of Biostatistics, Hacettepe University, Ankara, Turkey; 5Department of Radiology, Hacettepe University Medical School, Ankara, Turkey
Purpose: Smoking has been associated with an increased risk of developing multiple sclerosis, disease pro-gression and clinical disability. We detected the effects of smoking on regional brain volumes and lesion load in patients with clinically isolated syndrome using quantitative magnetic resonance imaging. Materials and Meth-ods: Smoker patients (n = 16), smoker healthy controls (n = 13), non-smoker patients (n = 17) and non-smoker healthy controls (n = 14) underwent magnetic resonance imaging and neocortical volumes were measured. Le-sion load was calculated in terms of number and volume of white matter hyperintensities. Results: Smoking was associated with increased gray matter volumes in several regions of the brain. A tendency towards greater lesion load in smoker patients was found. Smoking duration was significantly negatively correlated with intracranial vol-ume and left hemisphere cortical gray matter volvol-ume. There was no relationship between regional brain volvol-umes and clinical disability scores, lesion load duration of the disease and degree of smoking exposure. Conclusions: Clinically isolated syndrome related regional brain atrophy might vary in extent and severity with smoking. De-spite increased lesion load, less cortical and deep gray matter damage with a possible neuroprotective effect occurs in smoking.
KEYWORDS: clinically isolated syndrome, cigarette smoking, brain volume
Introduction
Multiple sclerosis (MS) is a chronic inflammatory de-myelinating disease of the central nervous system (CNS) with a complex etiology that predominantly affects young adults [1].
With limited availability of the epidemiologic MS studies in Turkey, the prevalence of MS seems between 34/1000.000 and 101/100.000 in different districts of Turkey [2,3]. Although patients usually recover from their presenting episode, clinically isolated syndrome (CIS) often converts into MS even with increased rates if associated with several risk factors [4,5]. Of the
envi-Received 23 April 2015; revised 14 July 2015; accepted 14 July 2015
Correspondence: Kader K. Oguz, Department of Radiology, Hacettepe University Medical School, Sıhhiye, Ankara, Turkey, Postal code: 06410. Tel: +90 5305845430. Fax: +90 3123112145. E-mail: [email protected]
ronmental factors, cigarette smoking not only increases the risk of development of CIS to MS, but also modifies the clinical course of the disease [4].
Nicotine has been held responsible for the major-ity of the detrimental effects of smoking on the CNS [6–8]. It acts as an agonist within the cholinergic neu-rotransmitter system and nicotinic receptors are widely distributed within the CNS with the highest density in the thalami [6,9,10]. Although there has been some in-consistency in the results, magnetic resonance imaging (MRI) has been used as a tool to demonstrate the smok-ing related changes on the CNS: smaller gray matter (GM) [7,11,12] and white matter (WM) [13,14] brain volumes as well as greater corpus callosum (CC) volume [8]. Also Gazdzinski et al. found that chronic smoking in alcohol dependence was associated with more temporal WM volume [15].
MRI is an essential part of the diagnostic criteria in MS. Although atrophy of brain tissue is not included in
806 G. Durhan et al.
MS diagnostic criteria, decreased global or regional GM volumes in patients with CIS have been associated with a higher rate of conversion to MS [16,17].
In this study, it was aimed to determine whether smoking would result in distinct alterations in regional brain volumes of patients with CIS as assessed by quan-titative MRI. In addition, the relationship was examined between smoking duration, age at onset of smoking and regional brain volumes. The secondary objective of the study was to evaluate the potential influence of smoking on lesion load in patients with CIS.
Materials and methods
Participants
The institutional review board approved the study. All participants gave written informed consent.
A total of 60 right-handed, equivalently educated subjects participated in our cross-sectional study. Healthy subjects and patients were collected in four age-matched groups according to smoking habits and
presence of CIS: CISs (n= 16; F/M = 8/8; mean age
(±SD) = 34.3 (±8.9) years), HCs (n = 13; F/M =
6/7; mean age (±SD) = 33.7 (±7.4) years), CISns
(n = 17; F/M = 13/4; mean age (±SD) = 29.7
(±6.9) years) and HCns (n = 14; F/M = 10/4; mean
age (±SD) = 29.8 (±7.9) years). Non-smoker
partici-pants had smoked no more than five cigarettes in their lifetime.
Twenty-seven healthy volunteers were recruited from e-mail based on advertisement and volunteers from hos-pital workers. Those individuals underwent systemic and neurological examination and their medical records were reviewed. Healthy participants with any history of either substance abuse or dependence disorders other than nicotine dependence and contraindications to MRI were excluded from the study.
Thirty-three consecutive patients admitted to our instiution during the years 2012–2014 were included in the study. All patients fulfilled the McDonald diagnostic criteria for MS but had only one clinical episode con-taining optic neuritis, cervical and/or thoracic myelitis or brainstem/cerebellar syndrome. Exclusion criteria for the patients were the presence of any systemic or neurological disease other than CIS, receiving steroid therapy or having an attack within 4 weeks of the MRI scan. No cases were converted to clinically definite MS during the study. Same patients also constituted the participants of another MRI study on diffusion tensor imaging alterations.
All patients were evaluated by two neurologists (S. Diker, A. Tuncer) with 4 and 15 years of experience, respectively, unaware of the MRI findings.
Image acquisition and analysis
All the participants had T1-weighted three-dimensional (3D) high resolution images with 0.9 mm isotropic
vox-els (MPRAGE) (TR/TE: 2600/3.1 ms; matrix: 224 ×
256; NEX: 1; TA: 4.06; number of slices: 176; slice thickness: 1.00 mm; distance factor: 50%; voxel size: 1 mm; in plane resolutions: 1 mm) and double inversion-recovery sampling perfection with application opti-mized contrasts using different flip angle evolution (DIR
SPACE) (TR/TE: 7500/325 ms; matrix: 192 × 192;
NEX: 1; TA: 6.09; number of slices: 144; slice thickness: 1.12 mm without intersection gap; voxel size: 1 mm; in plane resolutions: 1 mm) imaging on a 3-Tesla MR scanner (Magnetom, Tim, Siemens, Germany). DIR SPACE sequence was used for better multiplanar de-lineation of the lesions.
The imaging data were free of motion artifact and no subject was discarded from the study. The
measure-ments of neocortical volumes (mm3) on 3D MPRAGE
T1WI were performed using FreeSurfer Version 4.5.1 (http://surfer.nmr.mgh.harvard.edu/). The automated procedures for volumetric measures of the different brain structures were described by Fischl et al. [18]. Fol-lowing automated segmentation, normalization to to-tal intracranial volume was obtained.The reconstructed cortical surface models for each participant were manu-ally inspected to ensure segmentation accuracy; regions with poor segmentation accuracy due to poor image quality or misregistration were excluded from further statistical analyses. Cortical surfaces were automatically parcellated and combined to create average volume for total GM and for frontal, temporal, parietal and occipi-tal lobar regions. The volume of T1 hypointense lesions was also calculated automatically by this software.
The coordinations of each hyperintense WM lesion on DIR SPACE imaging was recorded using BrainVoy-ager QX 2.6 for Linux (http://www.brainvoyBrainVoy-ager.com). The lesions were ranged by a bounding box in which all the intensities of voxels were fixed to a threshold for a clear visual distinction of lesions and parenchyma (http://support.brainvoyager.com/volumespace/107- volume-rendering/314-users-guide-masking-and-cutting.html). The number of the voxels-of-interest (VOIs) was calculated and the total volume of VOIs where the lesions were ranged by bounding box. In this way, it was aimed to determine the demyelinating hy-perintense lesion load in respect of number and volume of the lesions in the brain of patients with CIS. Patients received intravenous gadopentetate dimeglumine (0.01 mmol/kg) contrast material and postcontrast axial T1W 3D MPRAGE and coronal fat satureted images
(TR/TE= 550/15 ms; matrix = 256 × 256 NEX = 2)
were obtained at 5 min after injection in all patients to detect active demyelinating lesion.
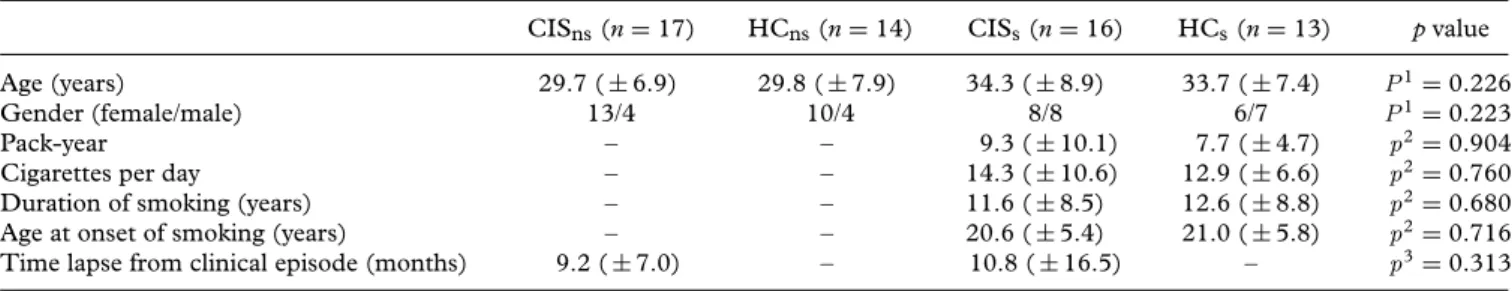
Table 1. Baseline demographic characteristics, clinical data and smoking histories for all groups. mean (±SD).
CISns(n= 17) HCns(n= 14) CISs(n= 16) HCs(n= 13) p value Age (years) 29.7 ( ± 6.9) 29.8 ( ± 7.9) 34.3 ( ± 8.9) 33.7 ( ± 7.4) P1= 0.226
Gender (female/male) 13/4 10/4 8/8 6/7 P1= 0.223
Pack-year – – 9.3 ( ± 10.1) 7.7 ( ± 4.7) p2= 0.904
Cigarettes per day – – 14.3 ( ± 10.6) 12.9 ( ± 6.6) p2= 0.760
Duration of smoking (years) – – 11.6 ( ± 8.5) 12.6 ( ± 8.8) p2= 0.680
Age at onset of smoking (years) – – 20.6 ( ± 5.4) 21.0 ( ± 5.8) p2= 0.716
Time lapse from clinical episode (months) 9.2 ( ± 7.0) – 10.8 ( ± 16.5) – p3= 0.313
CISssmoker patients with clinically isolated syndrome, HCssmoker healthy controls, CISnsnon-smoker patients with clinically isolated syndrome, HCnsnon-smoker healthy controls.
P1values among all groups.
p2values between all smoker individuals. p3values between patient groups.
Statistical analysis
Numerical variables were evaluated for normality of data distribution using the Kolmogorov–Smirnov
test. Descriptive statistics were stated as mean ±
standard deviation. Independent samples t-test was used to compare the means of two groups. The Mann Whitney U test was used to compare two groups for non-parametric data. A Spearman’s rho correlation coefficient was used to investigate the relationship between two variables. One-way analysis of variance was applied to compare the differences between groups. Multiple linear regression was performed to assess the association between two or more independent variables and a single continuous dependent variable. The anal-ysis was also accessed to detect whether confounding exists. The effect of group on dependent variables was examined by multiple linear regression model, after
adjustment for age and sex. A value of p ≤ 0.05 was
accepted as statistically significant. Data analysis was performed by IBM SPSS Statistics 21 software.
Results
Subjects and clinical characteristics
The patient group included 16 smokers (F/M = 8/8,
mean age (±SD) 34.3 (±8.9) years) and 17
non-smokers (F/M = 13/4, mean age (±SD) 29.7 (±6.9)
years). The mean time lapse from clinical episodes for
CISs and CISns were 10.8 (± 16.5) and 9.2 (±7.0)
months, respectively. CISs and CISns had a mean
ex-panded disability status scale (EDSS) of 0.06 and 0.18, respectively. Median EDSS of both patient groups is 0
(min= 0, max = 1).
The control group included 13 smokers (F/M =
6/7, mean age (±SD) 33.7 (±7.4) years) and 14
non-smokers (10/4 = F/M, mean age (±SD) 29.8 (±7.9)
years).
The demographic information, clinical data and smoking history are shown in Table 1. There was no
sig-nificant difference between CISs and HCs or between
CISns and HCns in terms of age and gender (all, p >
0.05). CISsand HCsshowed no difference in exposure
to smoking (all, p> 0.05). CISsand CISnswere similar
in duration of disease and EDSS (all, p> 0.05).
Volumetric comparisons in all groups
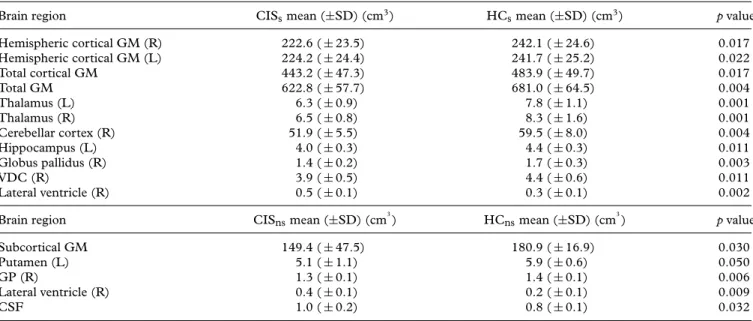
CISs had lower volume of bilateral hemispheric
corti-cal GM, total corticorti-cal GM, total GM, right cerebellar cortex, right globus pallidus (GP), ventral diencephalon (VDC), left hippocampus and bilateral thalami than
HCs(all, p≤ 0.05). CISnshad lower volume of
subcor-tical GM, left putamen, right GP and posterior CC than
HCns (all, p≤ 0.05). There was no parenchymal
cere-bral region with a greater volume in patients when pa-tients and control subjects were compared. The volume of right lateral ventricle was higher in the patient groups than in those of the matched controls. Furthermore,
compared to HCns, CISnsshowed significantly increased
volume of the cerebral spinal fluid (CSF). The regions with statistically different volumes and their mean vol-umes between the patients and control subjects are given in Table 2.
When HCsand HCnswere compared, the volumes of
bilateral cerebellar cortex, GP, VDC as well as thalami
were significantly greater in the smoking group (all, p≤
0.05) (Table 3).
Among the patients, volume analysis revealed that CISshad higher volumes of the intracranial, left
cerebel-lar cortex, left accumbens area and right GP than CISns.
There was no region of greater brain volume in CISns
relative to CISs(Table 4).
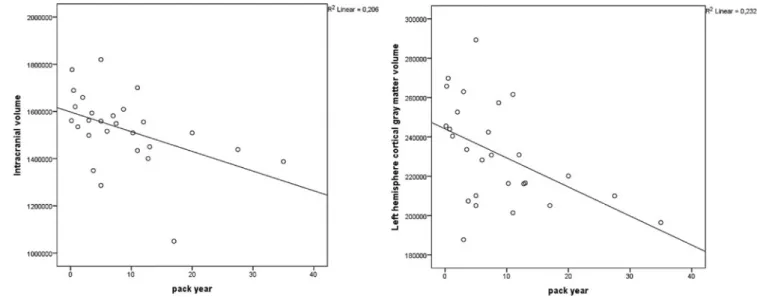
Regional brain volumes and lifetime exposure
to nicotine
Within overall smoking individuals, correlation analysis revealed a significant negative relationship between the
808 G. Durhan et al.
Table 2. Brain regions that show significantly different volumes between patients and controls, their mean volumes (±SD) and p values. Brain region CISsmean (±SD) (cm3) HCsmean (±SD) (cm3) p value Hemispheric cortical GM (R) 222.6 ( ± 23.5) 242.1 ( ± 24.6) 0.017 Hemispheric cortical GM (L) 224.2 ( ± 24.4) 241.7 ( ± 25.2) 0.022 Total cortical GM 443.2 ( ± 47.3) 483.9 ( ± 49.7) 0.017 Total GM 622.8 ( ± 57.7) 681.0 ( ± 64.5) 0.004 Thalamus (L) 6.3 ( ± 0.9) 7.8 ( ± 1.1) 0.001 Thalamus (R) 6.5 ( ± 0.8) 8.3 ( ± 1.6) 0.001 Cerebellar cortex (R) 51.9 ( ± 5.5) 59.5 ( ± 8.0) 0.004 Hippocampus (L) 4.0 ( ± 0.3) 4.4 ( ± 0.3) 0.011 Globus pallidus (R) 1.4 ( ± 0.2) 1.7 ( ± 0.3) 0.003 VDC (R) 3.9 ( ± 0.5) 4.4 ( ± 0.6) 0.011 Lateral ventricle (R) 0.5 ( ± 0.1) 0.3 ( ± 0.1) 0.002 Brain region CISnsmean (±SD) (cm3) HCnsmean (±SD) (cm3) p value Subcortical GM 149.4 ( ± 47.5) 180.9 ( ± 16.9) 0.030
Putamen (L) 5.1 ( ± 1.1) 5.9 ( ± 0.6) 0.050
GP (R) 1.3 ( ± 0.1) 1.4 ( ± 0.1) 0.006
Lateral ventricle (R) 0.4 ( ± 0.1) 0.2 ( ± 0.1) 0.009
CSF 1.0 ( ± 0.2) 0.8 ( ± 0.1) 0.032
CISssmoker patients with clinically isolated syndrome, HCssmoker healthy controls, CISnsnon-smoker patients with clinically isolated syndrome, HCnsnon-smoker healthy controls, SD standard deviation, GM gray matter, R right, L left, VDC ventral diencephalon, GP globus pallidus, CSF cerebral spinal fluid.
intracranial volume and pack-years (Spearman
correla-tion coefficient= −0.549; p = 0.003). Pack-years were
also significantly negatively correlated with left
hemi-sphere cortical GM (Spearman correlation coefficient=
−0.512; p = 0.006). (Figure 1).
Lesion load comparison between smoking
and non-smoking patients
The lesion load on T1W imaging as determined from volumes of WM hypointensities was greater in
smok-ing patients than non-smoksmok-ing patients (5.3 cm3 vs. 2.8
cm3; p= 0.05). CIS
shad a higher number and volume of
WM hyperintense lesion than CISnson DIR space
imag-ing, too. However, the difference did not reach statisti-cal significance. (15 vs. 11 and 5.2 cm3vs 2.4 cm3; p= 0.08 and 0.5). There was no correlation between
DIR-SPACE T2 hyperintense lesion load and significantly al-tered regional brain volumes including intracranial, left cerebellar cortex, left accumbens area and right GP.
Discussion
We found that smoking was associated with increased GM volumes in several regions of the brain in both pa-tients and controls. In contrast to the recent articles showing smaller GM volumes [7,11,12,15], we found that healthy smokers had greater GM volumes bilater-ally in the cerebellar cortex, thalamus, globus pallidus and VDC than healthy non-smokers. In this study, we found similar effects of cigarette smoking in both healthy controls and in patients with CIS compared to respec-tive matched non-smoking individuals. Our finding of
Table 3. Brain regions with statistically different volumes between non-smoking and smoking healthy controls, their mean volumes (±SD), p values.
Brain region HCnsmean (±SD) (cm3) HCsmean (±SD) (cm3) p value Cerebellar cortex (L) 49.0 ( ± 6.4) 56.2 ( ± 6.7) 0.026 Cerebellar cortex (R) 51.0 ( ± 6.3) 59.5 ( ± 8.0) 0.016 Thalamus (L) 6.6 ( ± 0.9) 7.8 ( ± 1.1) 0.049 Thalamus (R) 6.8 ( ± 0.9) 8.3 ( ± 1.6) 0.020 GP (L) 1.6 ( ± 0.09) 1.9 ( ± 0.3) 0.036 GP (R) 1.4 ( ± 0.1) 1.7 ( ± 0.3) 0.012 VDC (L) 3.6 ( ± 0.4) 4.3 ( ± 0.7) 0.050 VDC (R) 3.7 ( ± 0.3) 4.4 ( ± 0.6) 0.008
HCssmoker healthy controls, HCns non-smoker healthy controls, SD standard deviation, GM gray matter, L left, R right, GP globus pallidus, VDC ventral diencephalon.
Table 4. Brain regions with significantly different volumes in comparison to non-smoking and smoking patients, their mean values (±SD), and p values.
Brain region CISnsmean (±SD) (cm3) CISsmean (±SD) (cm3) p value Intracranial volume 1294.3 ( ± 135.6) 1501.6 ( ± 106.5) 0.0001 Cerebellar cortex (L) 46.7 ( ± 5.0) 51.0 ( ± 6.5) 0.036 Accumbens area (L) 0.6 ( ± 0.1) 0.7 ( ± 0.1) 0.001
GP (R) 1.3 ( ± 0.1) 1.4 ( ± 0.2) 0.032
CISssmoker patients with clinically isolated syndrome, CISnsnon-smoker patients with clinically isolated syndrome, SD standard devia-tion, L left, GP globus pallidus.
greater GM volumes in smoking relative to non-smoking patients with CIS was also observed in schizophrenia cases by Tregellas et al. demonstrating larger GM vol-umes in lateral prefrontal and superior temporal gyri us-ing voxel-based morphometry. The authors suggested preservation of these areas in smoking group, in addition to other regions belonging to prefrontal and limbic ar-eas with decrar-eased GM in the patients with schizophre-nia [19]. Nicotinic acetylcholine receptor (nAChR)s are extensively distributed in the human brain, with the highest density in the thalamus, substantia nigra and cerebral cortex in a decreasing order as well as cere-bral vasculature and astrocytes [9,20–22]. Given the as-sociations of brain region and subtype specific atten-uations in nAChRs with neuropsychiatric diseases in-cluding Alzheimer’s and Parkinson’s diseases, demen-tia with Lewy bodies, schizophrenia and autism, stud-ies revealing improvement following nicotine treatment in the animal Parkinsonian models, and larger putamen volumes in individuals with a greater lifetime nicotine exposure, nicotine has been regarded to have a neu-roprotective effect [22–24]. Either through mesolimbic system activation by nicotine addiction or binding to mostly concentrated nAChRs in the striatum, volume
changes in striatum with subsite-dependent alterations have been reported. Our study differs in that our small healthy group showed greater volumes of the GP, tha-lamus cerebellar cortex and VDC than non-smokers. Because our purpose was to study the effect of smok-ing on brains with CIS, we did not focus on nicotine dependence and measure Fagerstr ¨om score, rather we noted subjects’ lifetime use by pack-years. The finding of greater lifetime exposure associated with lesser left hemisphere cortical GM and total intracranial volume is in line with previous studies showing correlations be-tween pack-years of smoking and GM volume [7,11,25]. Thus, along with previous cognitive study results, these data suggest that the impact of chronic smoking on GM volume may be an attenuation, in contrast to a sin-gle one-time measurement compared with non-smokers [26,27].
In the present study, patients with CIS had vol-ume loss compared to matched individuals, in sev-eral brain structures. This was more widespread in
CISs including the thalamus, hippocampus,
cerebel-lum, VDC and hemispheric cortical GM. Enlargement of the lateral ventricle and CSF can be attributed to volume reductions in the patient groups. Thus, in a
810 G. Durhan et al.
longitudinal study of 34 patients with CIS, Raz et al. documented a progressive atrophy at 1-year follow-up [17]. T1 hypointense WM lesion load was greater in smoking patients than in non-smoking patients. We did not find such a significant difference, although lesion load was higher on DIR SPACE imaging, too. We be-lieve these findings may have a clinical implication given that non-enhancing demyelinating lesions on T1WI in CIS patients are associated with a higher risk of con-version to clinically definite MS along with the pres-ence of T2 hyperintense lesions invisible on T1WI [28]. In relapsing–remitting MS, EDSS worsening over 10 years was found to best correlate with the combination of baseline T1W lesion count and increasing T1W le-sion volume [29]. One reason why Arikanoglu et al. did not find an increased rate in conversion to MS despite a higher lesion load in smoking CIS patients might have been the measurement of only T2 hyperintense lesions in their study. Smoking was associated with increased T1hypo-, T2 hyperintense and contrast enhancing le-sion volumes and reduced regional volumes in MS [30]. In addition to worse disease at baseline, smoker patients with MS were faster in conversion to secondary progres-sive disease on up [31]. Also, in a 3-year follow-up study of 129 patients with CIS, it was suggested that smoking increased early conversion to MS after a clini-cally isolated syndrome [4].
Regardless of smoking, we observed atrophy in the thalamus, globus pallidus and putamen in our patients with very low EDSS scores compared to healthy controls as Henry et al. [32]. But, we cannot attribute deep GM atrophy to Wallerian degeneration from WM lesions due to lack of any correlation with neither EDSS nor lesion load in this study. This is in contrast to the findings of Tao et al., which suggested a link between subcortical GM and WM atrophy based on significant positive cor-relations with demyelinating lesions and clinical disabil-ity in MS patients [33]. The reason why we cannot find out any relation similar to Tao et al. is probably lower lesion load and EDSS scores in CIS patients compared to patients with MS.
The major noteworthy limitation in this study is the relative small sample sizes of our patient and control groups. One reason for that was the difficulty of hav-ing two matched control groups accordhav-ing to smokhav-ing habits of the patients. Due to small sample size we chose to not use Bonferroni correction for statistical analysis. Because, when sample size is small Bonferroni correc-tion gives rise to increase of type II errors [34,35]. But, it will be useful to make Bonferroni correction in the studies which have larger sample size. Also, we could not avoid relative female dominance in the non-smoker pa-tient and control groups, because women usually show fewer tendencies to smoking in our population. To elim-inate this limitation, we used statistical sex and age
corrected analysis. Because this study concentrated on CIS, our participants showed relatively younger age, and in turn, less lifetime cigarette smoking compared with previous studies on smoking in literature. These differ-ences might have resulted in some statistical insignifi-cance in the present study. Finally, because this study is a cross-sectional study, it is carried out in a short time and we could not estimate the conversion rate of CIS to MS. Since no patient showed conversion to MS until completion of the study. Future investigations consisting of larger patient and control groups with longer follow-up would give a more comprehensive understanding of smoking-related effects on the occurrence and course of demyelinating diseases.
Conclusion
The present study detected that CIS-related regional brain atrophy varies in extent and severity with cigarette smoking. Despite increased lesion load, less cortical and deep GM damage with a possible neuroprotective effect occurs in smoking.
Acknowledgements
The authors thank the National Magnetic Resonance Research Centre (UMRAM) for providing the MR facility.
Declaration of Interest
The authors report no conflicts of interest. The authors alone are responsible for the content and writing of the paper.
References
1. Noseworthy JH, Lucchinetti C, Rodriguez M, Weinshenker BG. Multiple sclerosis. New England J Med 2000;343(13):938–52. 2. Turk Boru U, Alp R, Sur H, Gul L. Prevalence of multiple scle-rosis door-to-door survey in Maltepe, Istanbul, Turkey. Neu-roepidemiology 2006;27(1):17–21.
3. C¸ elik Y, Birgili ¨O, Kiyat A, et al. Prevalence of multiple sclerosis in the metropolitan area of Edirne city, Turkey. Balkan Med J 2011;28:193–6.
4. Di Pauli F, Reindl M, Ehling R, et al. Smoking is a risk factor for early conversion to clinically definite multiple sclerosis. Multiple Sclerosis 2008;14(8):1026–30.
5. Miller DH, Chard DT, Ciccarelli O. Clinically isolated syn-dromes. Lancet Neurol 2012;11(2):157–69.
6. Azizian A, Monterosso J, O’Neill J, London ED. Magnetic res-onance imaging studies of cigarette smoking. Handbook Exp Pharmacol 2009;192:113–43.
7. Gallinat J, Meisenzahl E, Jacobsen LK, et al. Smoking and structural brain deficits: a volumetric MR investigation. Eur J Neurosci 2006;24(6):1744–50.
8. Paul RH, Grieve SM, Niaura R, et al. Chronic cigarette smok-ing and the microstructural integrity of white matter in healthy adults: a diffusion tensor imaging study. Nicotine Tobacco Res 2008;10(1):137–47.
9. Clarke PB. Nicotinic modulation of thalamocortical neurotrans-mission. Prog Brain Res 2004;145:253–60.
10. Gallinat J, Kunz D, Lang UE, et al. Serotonergic effects of smoking are independent from the human serotonin transporter gene promoter polymorphism: evidence from auditory cortical stimulus processing. Pharmacopsychiatry 2005;38(4):158–60. 11. Brody AL, Mandelkern MA, Jarvik ME, et al. Differences
be-tween smokers and nonsmokers in regional gray matter volumes and densities. Biol Psychiatry 2004;55(1):77–84.
12. Durazzo TC, Insel PS, Weiner MW. Alzheimer disease neu-roimaging I. Greater regional brain atrophy rate in healthy el-derly subjects with a history of cigarette smoking. Alzheimer’s Dementia: J Alzheimer’s Assoc 2012;8(6):513–9.
13. Longstreth WT Jr., Arnold AM, Beauchamp NJ Jr., et al. Inci-dence, manifestations, and predictors of worsening white mat-ter on serial cranial magnetic resonance imaging in the elderly: the cardiovascular health study. Stroke J Cerebral Circulation 2005;36(1):56–61.
14. Choi MH, Lee SJ, Yang JW, et al. Difference between smokers and non-smokers in the corpus callosum volume. Neurosci Lett 2010;485(1):71–3.
15. Gazdzinski S, Durazzo TC, Studholme C, et al. Quantitative brain MRI in alcohol dependence: preliminary evidence for ef-fects of concurrent chronic cigarette smoking on regional brain volumes. Alcoholism Clin Exp Res 2005;29(8):1484–95. 16. Calabrese M, Rinaldi F, Mattisi I, et al. The predictive value of
gray matter atrophy in clinically isolated syndromes. Neurology 2011;77(3):257–63.
17. Raz E, Cercignani M, Sbardella E, et al. Gray- and white-matter changes 1 year after first clinical episode of multiple sclerosis: MR imaging. Radiology 2010;257(2):448–54.
18. Fischl B, Salat DH, Busa E, et al. Whole brain segmentation: automated labeling of neuroanatomical structures in the human brain. Neuron 2002;33(3):341–55.
19. Tregellas JR, Shatti S, Tanabe JL, et al. Gray matter volume dif-ferences and the effects of smoking on gray matter in schizophre-nia. Schizophrenia Res 2007;97(1–3):242–9.
20. Heiss WD, Herholz K. Brain receptor imaging. J Nucl Med 2006;47(2):302–12.
21. Paterson D, Nordberg A. Neuronal nicotinic receptors in the human brain. Prog Neurobiol 2000;61(1):75–111.
22. Graham AJ, Martin-Ruiz CM, Teaktong T, et al. Human brain nicotinic receptors, their distribution and participation in neu-ropsychiatric disorders. Curr Drug Targets CNS Neurol Disor-ders 2002;1(4):387–97.
23. Das D, Cherbuin N, Anstey KJ, et al. Lifetime cigarette smok-ing is associated with striatal volume measures. Addiction Biol 2012;17(4):817–25.
24. Quik M, Campos C, Parameswaran N, et al. Chronic nicotine treatment increases nAChRs and microglial expression in mon-key substantia nigra after nigrostriatal damage. J Mol Neurosci 2010;40(1–2):105–13.
25. Zhang X, Salmeron BJ, Ross TJ, et al. Factors underlying pre-frontal and insula structural alterations in smokers. NeuroImage 2011;54(1):42–8.
26. Paul RH, Brickman AM, Cohen RA, et al. Cognitive status of young and older cigarette smokers: data from the international brain database. J Clin Neurosci 2006;13(4):457–65.
27. Stewart MC, Deary IJ, Fowkes FG, et al. Relationship between lifetime smoking, smoking status at older age and human cog-nitive function. Neuroepidemiology 2006;26(2):83–92. 28. Mitjana R, Tintore M, Rocca MA, et al. Diagnostic value
of brain chronic black holes on T1-weighted MR im-ages in clinically isolated syndromes. Multiple Sclerosis 2014;20(11):1471–7.
29. Giorgio A, Stromillo ML, Bartolozzi ML, et al. Relevance of hypointense brain MRI lesions for long-term worsening of clin-ical disability in relapsing multiple sclerosis. Multiple Sclerosis 2014;20(2):214–9.
30. Zivadinov R, Weinstock-Guttman B, Hashmi K, et al. Smoking is associated with increased lesion volumes and brain atrophy in multiple sclerosis. Neurology 2009;73(7):504–10.
31. Healy BC, Ali EN, Guttmann CR, et al. Smoking and disease progression in multiple sclerosis. Archives Neurol 2009;66(7):858–64.
32. Henry RG, Shieh M, Okuda DT, et al. Regional grey matter atrophy in clinically isolated syndromes at presentation. J Neurol Neurosurg Psychiatry 2008;79(11):1236–44.
33. Tao G, Datta S, He R, et al. Deep gray matter atrophy in multiple sclerosis: a tensor based morphometry. J Neurol Sci 2009;282(1–2):39–46.
34. Rothman KJ. No adjustments are needed for multiple compar-isons. Epidemiology 1990;1(1):43–6.
35. Perneger TV. What’s wrong with Bonferroni adjustments. BMJ 1998;316(7139):1236–8.