THE REPUBLIC OF TURKEY
BAHCESEHIR UNIVERSITY
UNDERWATER ELECTRO-OPTIC INTERCOM
SYSTEM DESIGN
Master Thesis
KAAN ALPER
THE REPUBLIC OF TURKEY
BAHCESEHIR UNIVERSITY
GRADUATE SCHOOL OF
NATURAL AND APPLIED SCIENCES
ELECTRICAL AND ELECTRONICS ENGINEERING
UNDERWATER ELECTRO-OPTIC INTERCOM
SYSTEM DESIGN
Master Thesis
KAAN ALPER
Thesis Advisor:
Associate Professor Dr. Sarper ÖZHARAR
THE REPUBLIC OF TURKEY BAHCESEHIR UNIVERSITY
GRADUATE SCHOOL OF NATURAL AND APPLIED SCIENCES ELECTRICAL AND ELECTRONICS ENGINEERING
Name of the thesis: Underwater Electro-Optic Intercom System Design Name/Last Name of the Student: Kaan ALPER
Date of the Defense of Thesis: 08.01.2018
The thesis has been approved by the Graduate School of Natural and Applied Sciences. Prof. Dr. Nafiz ARICA
Graduate School Director
I certify that this thesis meets all the requirements as a thesis for the degree of Master of Arts.
Asst. Prof. Cavit Fatih KÜÇÜKTEZCAN Program Coordinator
This is to certify that we have read this thesis and we find it fully adequate in scope, quality and content, as a thesis for the degree of Master of Arts.
Examining Comittee Members Signature
Thesis Supervisor _______________________
Assoc. Prof. Sarper ÖZHARAR
Member _______________________
Asst. Prof. Ömer POLAT
Member _______________________
vi
ACKNOWLEDGEMENT
Thanks to…
My supervisor Assoc. Prof. Sarper ÖZHARAR for guiding and supporting me over the years, for sharing his valuable knowledge with me and for his understanding.
My thesis committee members for all their guidance through my thesis process.
My director Selçuk ÖZYURT for his understanding and his helps through solving complicated electronic problems.
My family for being patient with my perpetual studentship, they have never lost their faith in me.
My wife Dr. Ezgi Ceren Dallı ALPER for her mental and motivational support while she was on duty far from home in Şırnak. She is my inspiration and motivation for continuing to improve my knowledge and move my career forward.
Finally, I would like to thank and dedicate my thesis to my grandfather and all other family members that passed away. He was the kindest and the most diligent person I have ever seen. Although it has been years since you have passed, I still keep your suggestions with me, every day.
v
ABSTRACT
UNDERWATER ELECTRO-OPTIC INTERCOM SYSTEM DESIGN
Kaan ALPER
Electrical and Electronics Engineering
Thesis Advisor: Associate Professor Dr. Sarper Özharar
January 2018, 71 pages
The underwater optical communication is getting more popular day by day. About 71 % of the Earth’s surface is covered with water and 96,5 % of this covered area is the oceans. During the past thousand years, human have never stopped exploring the oceans. Most of the comprehensive ocean explorations made underwater world and it became a great interest to the scientific, industrial and military societies. Underwater communication makes the underwater explorations possible. Bidirectional and secure underwater communication is a very challenging task even with nowadays technology, because the methods for wireless communication in air, do not work in water. In this thesis, Radio Frequency, acoustic and optical communication methods for underwater environment are inspected by comparing advantages and disadvantages of the methods. In addition to this, one transmitter and one receiver of underwater optical communication electronic system and one laryngophone system prototype is designed and constructed. The directional optical communication between one transmitter and one receiver has been successfully demonstrated on the field and error free audio communication has been successfully accomplished at a distance of 60 meters.
vi
ÖZET
SUALTI ELEKTRO OPTIK İNTERKOM SİSTEMİ TASARIMI
Kaan ALPER
Elektrik ve Elektronik Mühendisliği Tez Danışman: Doç. Dr. Sarper Özharar
Ocak 2017, 71 sayfa
Sualtı optik iletişimi her geçen gün daha popüler hale gelmektedir. Dünya yüzeyinin %71’i su ile kaplı olduğu gibi bu %71’ in %96,5’ini okyanuslar oluşturmaktadır. Geçen bin yıl boyunca, insanoğlu okyanusları keşfetmeyi hiç bırakmamıştır. Kapsamlı okyanus araştırmalarının çoğu su altı dünyasında yapılmış ve bilimsel, endüstriyel ve askeri sektörler tarafından büyük ilgi görmüştür. Sualtı keşifleri ancak ve ancak sualtı haberleşmesi ile mümkün kılınır. Çift yönlü ve güvenli sualtı iletişimi, havadaki kablosuz iletişim yöntemleri suda çalışmadığından ötürü, günümüz teknolojisiyle bile çok zordur. Bu tez çalışmasında, sualtı ortamında radyo frekansı, akustik ve optik iletişim yöntemleri, ilgili yöntemlerin avantaj ve dezavantajları karşılaştırılarak incelenmiştir. Buna ek olarak, bir verici ve bir alıcı sualtı optik iletişim sistemi elektronik tasarımı ve üretimiyle bir adet gırtlak mikrofonu prototipi yapılmıştır. Bir verici ve bir alıcı arasında yönlü optik iletişim başarılı bir şekilde gerçekleştirilmiş olup, hatasız sesli iletişim 60 metrelik bir mesafede gerçekleştirilmiştir.
vii CONTENTS TABLES ... ix FIGURES ... x ABBREVIATONS ... xii SYMBOLS ... xiv 1. INTRODUCTION ... 1
2. STATE of the ART ... 4
2.1 BACKGROUND ... 4
2.2 UNDERWATER WIRELESS COMMUNICATION (UWC) TYPES ... 6
2.2.1 RADIO FREQUENCY (RF) COMMUNICATION ... 6
2.2.2 ACOUSTIC COMMUNICATION ... 11
2.2.3 OPTICAL COMMUNICATION ... 14
3. MATERIALS AND METHODS... 24
3.1 SYSTEM DESIGN ... 24 3.2 TRANSMITTER DESIGN ... 24 3.2.1 CUSTOM LARYNGOPHONE ... 24 3.2.2 Transmitter Circuit ... 26 3.2.3 LED ... 31 3.3 Receiver Design ... 36
3.3.1 Custom Photo Detector Array ... 36
3.3.2 Receiver Circuit ... 39 4. OBSERVATIONS ... 43 4.1 Test Equipment ... 43 4.2 LED Test ... 44 4.3 Filter Test ... 45 4.4 Transmitter Test ... 55 4.5 Receiver Test ... 58 5. DISCUSSION ... 61 6. CONCLUSION ... 64 6.1 FUTURE WORKS ... 64 7. APPENDICES ... 66 7.1 Appendix A ... 66
viii
7.2 Appendix B ... 67
7.3 Appendix C ... 68
7.4 Appendix D ... 69
ix
TABLES
Table 1.1: Most Common Hand Sign Languages by RSTC (Recreational Scuba Training Council) ... 1 Table 2.1: The radio spectrum bands. ... 6 Table 2.2: Typical Bandwidth Performance of an Acoustic Communication System with Range... 13 Table 2.3: Wavelength Dependent Diffuse Attenuation Coefficient for Major Water Types. ... 23 Table 3.1: Technical Specifications of Arduino Pro Mini Development Board ... 28 Table 3.2: The PWM Frequencies with Corresponding Bit Depths and Code Settings . 31 Table 3.3: LXML-PE01-0070 Luxeon LED Specifications ... 35 Table 3.4: The Electrical Characteristics of BPW34 ... 38
x
FIGURES
Figure 2.1: Demonstration of Alexander Graham Bell’s Photophone. ... 5
Figure 2.2: Underwater RF Attenuation versus Frequency ... 9
Figure 2.3: Wavelength versus Frequency. ... 11
Figure 2.4: Colladon and Strum’s apparatus for measuring the speed of sound in the water. ... 12
Figure 2.5: Absorption of sound in sea water as a function of frequency 𝒅𝑩𝑯𝒛 ... 13
Figure 2.6: The electromagnetic spectrum ... 15
Figure 2.7: Schematic Outline of Jean Bernard Léon Foucault’s the Rotating Mirror Experiment that Determines the Speed of Light in Air and in Water. ... 16
Figure 2.8: Propagation Speeds versus Frequency Calculation in Matlab... 17
Figure 2.9: Form of Temporal Scattering ... 19
Figure 2.10: The global distribution of Jerlov water types. ... 21
Figure 2.11: The Diffuse Attenuation Coefficient versus Wavelength Graph for Various Jerlov Water Types. ... 22
Figure 3.1: System Design Schematic ... 24
Figure 3.2: Human Respiratory Passage Anatomy. (Guyton and Hall, 2006) ... 25
Figure 3.3: Kingstate KPEG116 Piezo Transducer and Frequency Response Graph ... 25
Figure 3.4: Schematic of Preamplifier Circuit ... 26
Figure 3.5: Custom Design Laryngophone ... 26
Figure 3.6: Arduino Pro Mini Development Board with Pin Outs ... 27
Figure 3.7: PWM Signal ... 29
Figure 3.8: PWM with Frequency Modulation ... 29
Figure 3.9: PWM versus PFM like Signal and with Frequency Modulation ... 30
Figure 3.10: Carrier Frequency, Original Signal and Modulated Signal Chart ... 30
Figure 3.11: The Schematic of Transmitter Circuit. ... 31
Figure 3.12: The Location and The Data Set of April 2013 Aqua Modis Satellite. ... 33
Figure 3.13: The Display of Data Set of April 2013 Aqua Modis Satellite. ... 33
Figure 3.14: Graphic of Irradiance/Transmittance versus Wavelength on Different Water Types. ... 34
Figure 3.15: Luxeon Rebel LED (LXML-PE01-0070)... 34
Figure 3.16: The Light Intensity versus Distances of LED plotted from Matlab Code .. 35
Figure 3.17: OPC1-2-COL Reflector Photo and Size Chart. ... 36
Figure 3.18: Finished Transmitter Unit ... 36
Figure 3.19: Silicon Based PIN Photodiode BPW34 ... 37
Figure 3.20: The Spectral Response of BPW34... 37
Figure 3.21: Photodiode Array Design ... 38
Figure 3.22: Receiver Circuit ... 39
Figure 3.23: OPA381 Datasheet Transimpedance Amplifier ... 40
Figure 3.24: LMC568 Low Power Phase Locked Loop Datasheet Example Circuit ... 41
Figure 3.25: LM386 Datasheet Example Circuit ... 41
Figure 3.26: Dayton BCE-1 Bone Conductive Speaker... 42
xi
Figure 4.1: Bitscope Micro Oscilloscope and Analyzer ... 43
Figure 4.2: Ocean Optics USB4000 Spectrophotometer ... 44
Figure 4.3: LED Spectral Graph ... 45
Figure 4.4: Phillips 9006 HB4 Light Bulb is used to Simulate Sun Light ... 46
Figure 4.5: Spectral Response Graph of Phillips 9006 Light Bulb ... 47
Figure 4.6: Spectral Response Graph of Direct Sun Light ... 47
Figure 4.7: Relative Spectral Response Graph of Direct Sun Light Cited on Literature 48 Figure 4.8: Blue Acetate Film Filter ... 49
Figure 4.9: Blue Acetate Film’s Spectral Graph ... 49
Figure 4.10: Green Acetate Film Filter ... 50
Figure 4.11: Green Acetate Film’s Spectral Graph ... 50
Figure 4.12: Blue and Green Acetate Films ... 51
Figure 4.13: Spectral Graph of Blue and Green Acetate ... 51
Figure 4.14: Two Green Acetate Films ... 52
Figure 4.15: Spectral Graph of Two Green Acetate Films ... 52
Figure 4.16: Two Blue Acetate Films ... 53
Figure 4.17: Spectral Graph of Two Blue Acetate Films... 53
Figure 4.18: Two Blue and Two Green Acetate Films ... 54
Figure 4.19: Spectral Graph of Two Blue and Two Green Acetate Films ... 54
Figure 4.20: Spectral Graph and Values of Chosen Filter Combination. ... 55
Figure 4.21: Sound signal frequency on oscilloscope ... 56
Figure 4.22: Carrier Frequency on oscilloscope ... 56
Figure 4.23: PFM like PWM Modulation ... 57
Figure 4.24: One transmitter and one receiver unit performing the communication. ... 57
Figure 4.25: Transimpedance Amplifier Output ... 58
Figure 4.26: Lf356 Output ... 59
Figure 4.27: LMC568 Output ... 59
Figure 4.28: LM386 Output ... 60
Figure 5.1: The underwater optical communication unit (left) and the free space optical communication unit (right) of the two-way optical communication system. ... 62
Figure 5.2: Underwater optical communication unit is placed on the sea floor and the free space optical communication unit is placed at the top of the crane. ... 63
xii
ABBREVIATONS
A : Ampere
ARM : Acorn RISC Machines CW : Clockwise
CPU : Central Processing Unit
D : Distance
dB : Decibel DC : Direct Current E : Efficiency
ELF : Extremely Low Frequency EM : Electro Magnetic
EMI : Electro Magnetic Immunity FPGA : Field Programmable Gate Array
g : Gram Hz : Hertz IR : Infrared kg : Kilogram KHz : Kilohertz Km : Kilometer
LED : Light Emitting Diodes
m : Meter MHz : Megahertz ml : Milliliter mm : Millimeter mV : Millivolt mW : Milliwatt nF : Nanofarad nm : Nanometer
xiii OWC : Optical Wireless Communication PCB : Printed Circuit Board
PFM : Pulse Frequency Modulation PLL : Phase Locked Loop
R : Resistance RF : Radio Frequency
RSTC : Recreational Scuba Training Council
S : Siemens
SLF : Super Low Frequency
UOWC: Underwater Optical Wireless Communication US : United States
V : Voltage
VLF : Very Low Frequency
xiv
SYMBOLS
Absorption Coefficient : a(λ)
Absorption Coefficient of Fluvic Acid : af0
Absorption Coefficient of Humic Acid : ah0
Absorption of Pure Water : aw
Attenuation : α
Attenuation Coefficient : c(λ)
Backscattering : bB(λ)
Concentration of Chlorophyll-a : Cc0
Concentration of Fluvic Acid : Cf
Concentration of Humic Acid : Ch
Concentration of Large Particles : Cl
Concentration of Small Particles : Cs
Conductance : G Conductivity : σ Cubic Meter : m³ Current : I Depth : h Diameter : Ø
Diffuse Attenuation Coefficient : Kd(λ)
Direct Current Voltage : Vdc
Exponential Coefficient of the Fluvic Acid : kf
Exponential Coefficient of the Humic Acid : kh
Fluid Density : ρ
Frequency : f
Input Voltage : Vin
Logarithmic Voltage Ratio : dBV
xv
Micro Volt : µV
Micro : µ
Ohm : Ω
Omega : ℧
Output Voltage : Vout
Optical Power : I
Particle Velocity : u
Peak to Peak Voltage : Vpp
Pi : π
Power : P
Pressure : p
Probability of Backscattering by large particles : bl(λ)
Probability of Backscattering by small particles : bs(λ)
Pure Water Scattering : bw(λ)
Refractive Index of Water : n
Salinity : s
Scattering : b(λ)
Specific Scattering Coefficients for large particles : bl0(λ)
Speed of light in free space : c
Speed of light in water : Vwater
Square Meter : m²
Transmitted Power : I0
Volt : V
1
1. INTRODUCTION
Communication has a really important role in society. Communication is derived from the latin word “communis”, means “make common”. Therefore, Communication means “to share” thoughts, ideas, messages and information by the way of speech, writing or signals. Through the communication, the world is safer, more efficient and enjoyable. However, communication has not accomplished the same impact under the water, although it is crucial for diver’s life.
For underwater communication, several methods and technologies are used by divers. These methods are using underwater writing slates, sign languages and electronic communicators (Oceanreef, 2010). Using hand sign languages are considered the most convenient and reliable way to communicate under the water (Oceanreef, 2010). Some of the most common hand sign languages are shown in Table 1.1.
Table 1.1: Most Common Hand Sign Languages by RSTC (Recreational Scuba Training Council)
Ascend, or I am going up (RSTC, 2005) (wikiHow, 2017).
Descend, or I am going down (RSTC, 2005, wikiHow, 2017).
Are you Ok? Or I am Ok! (RSTC, 2005, wikiHow, 2017).
There are varieties of electronic communicators, like using hydrophones, hard wire cables, radio frequency or acoustic. Hydrophones are waterproof sound transceivers
2
that produce audible sound and listen underwater, however there are limited use of hydrophones for classic diver communications, because it requires considerable power to reach required distances. The most popular communication method is hard wire communication. It is used between surface and divers, sound gathered by microphone and speaker integrated full-face masks and it has the best audio quality but on the other hand, it reduces mobility of divers and limits divers range. It also provides half and full duplex communications, however it is only used by deep divers, underwater workers and divers who need to be connected to surface for further supply needs (Oceanreef, 2010). Also, it requires expensive equipment, since divers are using different technologies to communicate wirelessly such as RF (Radio Frequency) and acoustic.
Radio Frequency based underwater communications held on mostly VLF (Very Low Frequency) and ELF (Extremely Low Frequency) radio waves. In both frequencies, underwater RF communication system requires large sized antennas and it consumes high energy when it is compared with other methods, because RF signals experience high losses when propagating through the water (Waite, 2002). On acoustic based underwater communication, sound is modulated on higher frequencies that human ears cannot detect. The speed of the acoustic waves in water is much greater than the acoustic waves in the air (Oceanreef, 2010). Due to this property of sound in the water, ultrasonic communicators are a part of underwater noise pollution that can affect marine organisms (Peng et al., 2015). Both technologies are one-time & one-way communication which is called half duplex communication, have low frequency signals that can carry low data rates due to limited physical characteristics and these signals are transmitted omni-directional, it means they can be intercepted or jammed by third parties. There is more energy efficient, more secure and more reliable way to communicate under the water: Optical Wireless Communication.
Light has been around for many millions of years. It has created life; it has created all the stuff needed for life. For many years, light has been used for making fire, for illumination, for healing, for heating, for signaling, for communication et cetera. Optical wireless communication exists for many years in form of beacon fires and smoke signals to convey a message and it can be found in almost all cultures.
3
The recent advancement in technology has gained significant pace after the invention of lasers and LEDs (light-emitting-diodes). Technology has been improving for the last few decades. Improvement in technology has effects on many areas such as everyday lives, social structures and communication. Since humans are limited in their ability to communicate underwater, as it is mentioned above, a solution is brought forth by creating a short range Underwater Optical Wireless Communication (UOWC) system based on LED, to overcome many of the obstacles presented in underwater communication. In this paper, a detailed report is given why and how a short range underwater optical wireless communication system is designed.
A brief introduction of the problem is given on this chapter. The following chapters will firstly be presenting the state of the art on underwater communication methods by indicating physical properties of the water. Secondly, it will be focused on the design and development of the short range UOWC by defining materials and by describing methods that will be used. Third, a detailed electronical and mechanical design will be given. Finally, electro-mechanical system integration will be explained and the results will be discussed.
4
2. STATE of the ART
In this chapter, historical background of underwater communication and all the necessary scientific works are presented, including methods, related theoretical backgrounds and all the advantages & disadvantages for each approach.
2.1 BACKGROUND
Underwater communication has a long history starting with the knowledge of sound propagating under the water. “If you cause your ship to stop, and place the head of a long tube in the water, and place the outer extremity to your ear, you will hear ships at a great distance from you.” Written in 1490 by Leonardo da Vinci (Benvenuto et al., 2011). But it was not widespread till the concept of submarine would be heard during World War I, therefore, research into underwater sound measurement systems became a necessity. In 1915, two physicists; Ernest Rutherford and Paul Langevin independently created a device for detecting the noise emitted from moving submarines by using piezoelectricity (Katzir, 2012). In 1945, the first underwater voice communication was performed by the Naval Underwater Sound Laboratory (Quazi and Konrad, 1982).
Free Space Optical Communication or Optical Wireless Communication (OWC) is an ancient technology that causes a transmission of an information carrying optical radiation, from one point to another, through a medium. Ancient Greeks and Romans used fire beacons for signaling, by 800 BC (Ghassemlooy et al., 2013). In 1880, first optical voice communication was performed by Alexander Graham Bell, with a device called Photophone (Hospitalier, 1882). Graham Bell constructed a system that modulated the sun radiation by his voice signal and transmitted to a distance of 200 meters.
5
Figure 2.1: Demonstration of Alexander Graham Bell’s Photophone.
Source: BELL, A. G. 1880. On the Production and Reproduction of Sound by Light. American Journal of Science, 20, 305-324.
Vibrations caused by the voice modulated the reflected sun radiation by a movable mirror, projected and transformed back into voice at the receiver. Photophone never became a commercial product due to its complex mechanical design and the intermittent nature of the sunlight, but it was attracted the interest of the military and high-pressure arc lamps were used to transmit voice in the tactical field (Uysal et al., 2016).
The following century, fiber optic and radio frequency communications improved rapidly and it started to dominate the telecommunication market. But in 1960, the invention of laser is accepted as a substantial milestone of wireless optical communication history (Beleffi, 2010). In 90s the idea of bidirectional ground-satellite laser communications became popular, and after the year 2000, research on the Free Space Optical (FSO) technologies expended all over the world, it is started to be seen in civil and military FSO applications more often (Beleffi, 2010).
Due to improvements in technology, underwater free space optical communication systems have become more popular in recent years with the invention of reliable, low cost light sources such as Light Emitting Diodes (LED) and diode lasers. In 1963, right after 3 years from invention of laser, Seibert Duntley proposed that light with wavelengths of 450nm to 550nm have relatively low attenuation property while passing through seawater (Duntley, 1963) and this property was experimentally proven by G. D. Gilbert and his friends in 1966 (Gilbert et al., 1966). The most comprehensive work has been done by N. G. Jerlov (Jerlov, 1976) and Mobley (Mobley, 1994). The biggest challenges are the attenuation and the scattering properties of water medium and it makes UOWC a very
6
challenging task. Due to the conducting and dynamically changing sea environment, most common used ways to communicate in air, do not work in water.
2.2 UNDERWATER WIRELESS COMMUNICATION (UWC) TYPES
There are three different types of communication on in the aquatic environment. These are Radio Frequency, Acoustic and Optic.
2.2.1 RADIO FREQUENCY (RF) COMMUNICATION
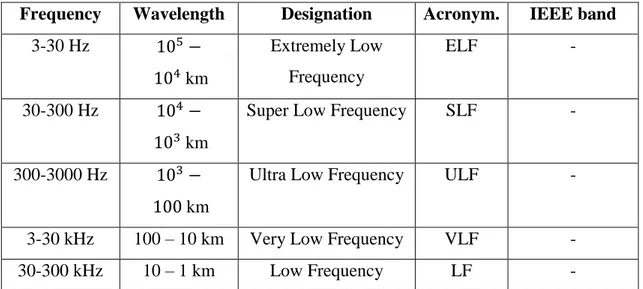
The term of “wireless” is generally used to describe RF technologies due to common usage of RF devices around the world. Radio Frequencies are consisted of electromagnetic waves and these are a form of radiant energy released by electromagnetic processes (Holt et al., 2010). Electromagnetic spectrum is formed by the frequency range of electromagnetic waves. The wavelength λ is reciprocally related to its frequency ƒ by the relationship:
λ=c
ƒ 2.1
where c is the speed of light in free-space with c ≈3×10⁸ m s⁄ .
Table 2.1: The radio spectrum bands.
Frequency Wavelength Designation Acronym. IEEE band
3-30 Hz 105− 104 km Extremely Low Frequency ELF - 30-300 Hz 104− 103 km
Super Low Frequency SLF -
300-3000 Hz 103− 100 km
Ultra Low Frequency ULF -
3-30 kHz 100 – 10 km Very Low Frequency VLF -
7 300kHz–
3MHz
1 km – 100 m Medium Frequency MF MF
3-30 MHz 100 – 10 m High Frequency HF HF
30-300 MHz 10 – 1 m Very High Frequency VHF VHF
300MHz– 3GHz
1 m – 10 cm Ultra High Frequency UHF UHF, L, S
3-30 GHz 10 – 1 cm Super High Frequency SHF S,C,X,Ku,K,Ka 30 – 300 GHz 1 cm – 1 mm Extremely High Frequency EHF Ka, V, W, mm
Source: IEEE 2009. IEEE Standard Letter Designations for Radar-Frequency Bands. In: SOCIETY, I. A. E. S. (ed.) IEEE Std 521-2002. New York: IEEE.
The RF is a very popular choice to communicate via wireless in terrestrial communications. However, underwater electromagnetic communications have been also very popular since the early days of radio (Lindsay, 1853, Lindsay, 1854, Lindsay, 1860) and had drawn great attention during 1960’s (Siegel and King, 1973). During this era, terrestrial radio frequency type communication was delivered by Morse Code or full band analogue voice communications over long distances. Researche aimed at performing these types of communications in the aquatic environment. Actually, ELF and SLF submarine communication is believed to be the only successfully performed electromagnetic operation under the water (U.S.Navy, 2003). According to report, US system and Russian system were respectively operating at 76 Hz and 82 Hz. Both systems were capable of transmitting a few characters per minute across the world. It was also capable of performing a one-way “bell ring” to call an individual submarine to the surface for terrestrial radio communication.
There are many restricting factors when performing RF communication in water. EM waves are severally attenuated in the aquatic environment; besides, they have different behavior in freshwater and seawater. Water is an insulator in its pure form, whereas, in nature, it contains dissolved salts and other compounds that make it a good partial conductor. Conductivity (σ) depends on both salinity and temperature of water. Sea water has a high conductivity when it is compared with fresh water, due to its high salt content
8
(Butler, 1987). High conductivity leads to strong attenuation of electromagnetic waves that are passing through water. A conducting element is defined as the following equation;
G=VI =R1 2.2
Where G is conductance, I is electrical current, V is electrical voltage and R is the electric resistance. The unit of conductance is Siemens and is shown by S and the rest;
S=1
Ω=Ω -1=A
V 2.3
Where Ω is the ohm, A is the ampere and V is the volt. Formerly, mho was used instead of Siemens. It is the reciprocal of the ohm, it is also backwards spelling of ohm and is shown upside down Greek letter omega; ℧.
In Figure 2.2 underwater RF attenuation versus frequency is shown based on Lloyd Butler’s work done in 1987. They took the seawater sample from the Red Sea and the freshwater sample from Adelaide. The Red Sea has high salt content, its conductivity varying from 2 𝑆 𝑚⁄ in the cold region, to 8 𝑆 𝑚⁄ in the warm region and average conductivity of the sea is about 4 𝑆 𝑚⁄ . The Adelaide water has a lower conductivity around 0,0546 𝑆 𝑚⁄ .
9
Figure 2.2: Underwater RF Attenuation versus Frequency
Source: BUTLER, L. 1987. Underwater Radio Communication. Amateur Radio. Melbourne: Wireless Institute of Australia.
The attenuation of the radio wave in the aquatic environment is calculated from the following equation;
α=0,0173×√(f×σ) 2.4
Where the is attenuation is α, f is the frequency and σ is conductivity. The unit of attenuation is 𝑑𝐵 𝑚⁄ , frequency and conductivity are respectively Hz and 𝑆 𝑚⁄ . From the equation α=0,0173×√(f×σ) 2.4, a frequency of 62.5 kHz will be attenuating 1,01 𝑑𝐵 𝑚⁄ in fresh water, hence it is attenuating 8,65 𝑑𝐵 𝑚⁄ in seawater with average salinity. But for a frequency of 62,5 Hz will be attenuating 0,032 𝑑𝐵 𝑚⁄ in fresh water and it is attenuating 0,273 𝑑𝐵 𝑚⁄ in seawater with average salinity. As it is easily seen that lower frequencies are less attenuating than higher frequencies.
10
The wavelength propagation is also different in water medium. It is calculated by the following equation:
λ=1000 × √10 (f×σ)⁄ 2.5
Where λ is the wavelength in meters, f is the frequency in Hz and σ is the conductivity in 𝑆
𝑚
⁄ . To reveal the correlation between the seawater and the fresh water Adelaide, the wavelength in space is taken as reference. From the equation λ=1000 × √10 (f×σ)⁄
2.5λ=1000 × √10 (f×σ)⁄ 2.5, the wavelength of a frequency of 62.5 kHz will
be in 54,13 meters in fresh water, 6,32 meters in seawater but it is normally 4,8 km for wavelength in space from equation λ=ƒc 2.1. The difference can also be seen on
11
Figure 2.3: Wavelength versus Frequency.
Source: BUTLER, L. 1987. Underwater Radio Communication. Amateur Radio. Melbourne: Wireless Institute of Australia.
As a result, in an aquatic medium, it is very difficult to perform a radio frequency communication (E. J. Hilliard and Gould, 1977). Due to its physical properties, it requires larger antennas and high energy to perform RF communication in the aquatic environment.
2.2.2 ACOUSTIC COMMUNICATION
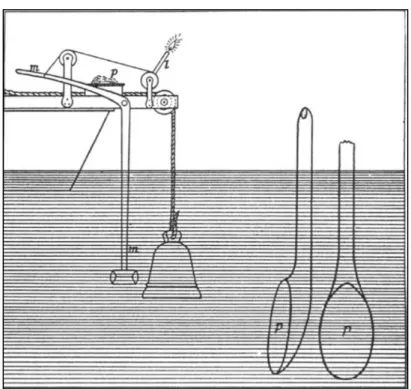
The term of “underwater wireless communication” is generally used to describe acoustic technologies due to its physical properties in water medium. The water is the ideal sound-propagating medium, because sound wave travels faster in water rather than it travels in the air. Therefore, acoustic communication has been the standard solution for submarine missions. Acoustic communication In 1826, a Swiss physicist Jean Daniel Colladon and
12
a French mathematician Charles Strum performed an experiment in Lake Geneva, for measuring the speed of sound (Gay-Lussac and Arago, 1827, Medwin and Clay, 1998).
Figure 2.4: Colladon and Strum’s apparatus for measuring the speed of sound in the water.
After the experiment, they found the value of 1435 𝑚 𝑠⁄ , but it was realized that the speed of sound in water varying by other parameters like; salinity, temperature and pressure. In sea water, the speed of the sound is close to 1500 𝑚 𝑠⁄ , it is also varied by the same parameters (Lurton, 2002). The speed of sound directly related with the physical characteristics of the water it increases with increasing temperature, salinity and pressure (Waite, 2002).
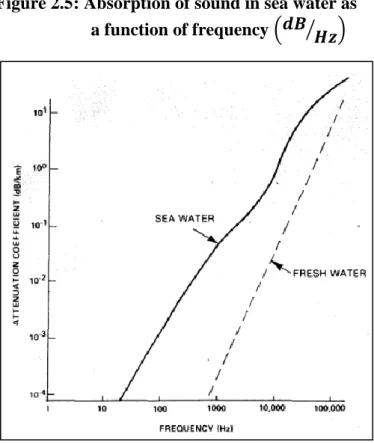
The physical characteristics of water allow to transmit data to long range distances, but it is relative to signal attenuation. The sound wave attenuation occurs due to viscosity and molecular relaxation (Waite, 2002). The attenuation of the sound wave in fresh water and salt water is shown in Figure 2.5. Low salinity means very low attenuation and it also means low propagation losses. The absorption of high frequencies is dominated by the viscosity of the water, on the other, the absorption of low frequencies is dominated by the dissolved compounds in the water (Lanzagorta, 2013). The attenuation due to molecular relaxation is only present in sea water. The molecular absorption is directly related with
13
dissolved compounds in water, such as boric acid and magnesium carbonate. Temperature, salinity and pressure (directly related to the depth) are the physical characteristics of the medium that affect the attenuation factor in both regimes.
Figure 2.5: Absorption of sound in sea water as a function of frequency (𝒅𝑩 𝑯𝒛⁄ )
Source: QUAZI, A. & KONRAD, W. 1982. Underwater Acoustic Communications. IEEE Communications
Magazine, 20, 24-30.
Despite the advantage, acoustic communication also carries some problems when the signal transmission speed is important (Liu et al., 2008). However, the sound wave propagation in water medium is highly dependent on frequency (Cochenour et al., 2008). In Table 2.2 the performance of typical acoustic communication systems is summarized.
Table 2.2: Typical Bandwidth Performance of an Acoustic Communication System with Range
Distance Range (km) Bandwidth (kHz) Data Rate
Very Long >100 <1 ~600 bps
Long 10-100 ~2-5 ~5 kbps
Medium 1-10 ~10 ~10 kbps
Short 0,1-1 ~10-100 ~30 kbps
Very Short <0,1 >100 ~500 kbps
Source: COCHENOUR, B. M., MULLEN, L. J. & LAUX, A. E. 2008. Characterization of the Beam-Spread Function for Underwater Wireless Optical Communications Links. IEEE Journal of Oceanic Engineering, 33, 513-521.
14
Acoustic communications also present other issues, such as sensitivity to multipath propagation, ambient noise and dispersion. Due to long propagation range of acoustic waves, acoustic communication is not a stealthy method to communicate, on the other hand, because of the problems that cited above, it is very difficult to perform a highly directional acoustic communication (Lanzagorta, 2013).
2.2.3 OPTICAL COMMUNICATION
The present technology of RF underwater communication requires huge antenna size, high transmitter power even in fresh water and suffers from high attenuation in the sea. On the other hand, acoustic underwater communication does not require big transceivers and it provides more physical flexibility to its platform. The acoustic signals can reach up to long rage distances due to physical properties of water. Nevertheless, it suffers from high latency and low data rates on long rage communication. It also distresses marine mammals due to utilized communication frequencies. To overcome these problems and to reach high-frequency data rates, optical communication is an obvious choice for underwater communication. However, underwater optical communication is a challenging task, since the optical beams are also suffered from attenuation caused by high absorption and scattering. But for short distances, it is the best solution for voice communication.
Underwater optical communication is still in development, it has some advantages of the RF communication, but not all the disadvantages. The electromagnetic waves vary from each other in lengths and in energy levels. The wavelength (λ), as the name implies, is the distance between two successive wave peaks. The energy levels are inversely proportional to the wavelengths; higher the wavelength, the shorter the energy level. The electromagnetic spectrum, is the arrangement of the electromagnetic waves according to the wavelengths or the energy levels. Light is a part of electromagnetic spectrum. The waves, that can be seen by human eye, are just a small part of electromagnetic spectrum. Figure 2.6 shows the entire electromagnetic spectrum. The wave theory indicates that the speed of light is decreasing in a denser medium, yet the particle theory of Newton says the opposite.
15
Figure 2.6: The electromagnetic spectrum
Source: UYSAL, M., CAPSONI, C., GHASSEMLOOY, Z., BOUCOUVALAS, A. C. & UDVARY, E. 2016. Optical wireless communications : an emerging technology. Signals and communication technology,. Switzerland: Springer,.
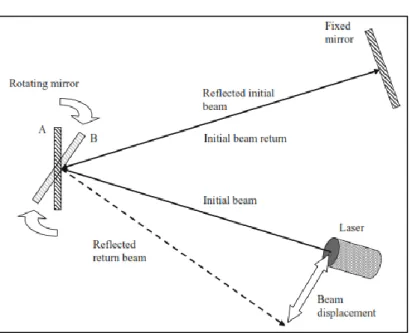
In the early 1600s, Galileo Galilei attempted to measure the speed of light with his assistant. They tried to measure the speed of light on different hilltops with a known distance between. They use a lantern to generate a light pulse and his assistant opened the shutter of a lantern as soon as he saw the light from Galilei’s. They tried the same experiment with different distances between them, unfortunately, they could not manage to measure the speed of light. Galilei concluded that light was too fast to be measured. In 1849, French physicist Armand Fizeau managed to measure the speed of light by his toothed gear setup. He estimated the speed of light c = 313.300 𝑘𝑚 𝑠⁄ . Right after Fizeau, in 1850, French physicist Jean Bernard Léon Foucault replaced the toothed gear with a mirror and he estimated c = 297.878,309 𝑘𝑚 𝑠⁄ . Foucault’s rotating mirror experiment’s purpose was not to physically measure the speed of light in water, yet to perceive what influence a section of water had upon the position of an image light beam. But the more accurate measurement made in 1958 by British Physicist Keith Davy Froome after the invention of radio interferometry and the result was c = 299.792,458 km s⁄ in vacuum (Koupelis, 2011).
16
Figure 2.7: Schematic Outline of Jean Bernard Léon Foucault’s the Rotating Mirror
Experiment that Determines the Speed of Light in Air and in Water.
Source: BEECH, M. 2012. The physics of invisibility a story of light and deception. New York, NY: Springer,
In 1621 Dutch mathematician and astronomer Willebrod Snell van Roijen discovered a law for the refraction of light (Beech, 2012). It is known as Snell’s Law;
n= c
Vmedium 2.6
As it is known the refractive index of water n = 1,33 (Tilton and Taylor, 1938), the speed of light in water; 𝑉𝑤𝑎𝑡𝑒𝑟 ≅ 225.407,863 𝑘𝑚 𝑠⁄ . Optical communication in water is very tricky due to high attenuation. But water media does not affect light much like other communication methods.
17
Figure 2.8: Propagation Speeds versus Frequency Calculation in Matlab
Source: Source Code is given on Appendix A
In Figure 2.8 it is shown propagation speeds versus frequency. Propagating light beam in water medium is subject to intense attenuation due to high absorption and scattering.
The optical properties of the water can be classified as inherent and apparent optical properties (Mobley, 1994). The inherent optical properties characterize optical parameters that only depend on the transmission medium by including the composition of that medium and particle substances present in it (Johnson et al., 2014). This characterization method is independent of light sources. Absorption coefficient, scattering coefficient and attenuation coefficient are the major inherent optical properties of the water (Spinrad et al., 1994). On the other hand, the apparent optical properties depend on not only the transmission medium, but also the geometrical structure of the light sources by including diffusion and collimation (Johnson et al., 2014). Radiance, irradiance and reflectance are the major apparent optical properties of the water (Spinrad et al., 1994). In an underwater communication system, the apparent optical properties are typically used to calculate ambient light levels for communication near the water surfaces, whereas the inherent properties are used to determine the budget of the communication link (Johnson et al., 2014). The inherent properties of the water have a greater impact on the communication link performance. The attenuation coefficient (c) is the most widely
18
used inherent property. It describes the loss of the optical power per meter and measured in 𝑚−1. It is derived by considering the explanations behind the photons that is not reaching to a receiver after being transmitted through an inhomogeneous medium. One reason should be the scattering, and it is considered when the photons is redirected by a refractive index boundary. Alternatively, the photon energy may be converted to heat or be absorbed by chemical contents of the medium and it is known as absorption (Johnson et al., 2014). The overall beam attenuation is consisted from scattering and absorption together. It is determined by Beer-Lambert’s Law, where the optical power (I) is based on the transmitted power (𝐼0) with a distance (d) and the attenuation coefficient (c) (Mobley, 1994).
I=I0 × e-cd 2.7
The exact value of the attenuation coefficient (c) depends on the wavelength (λ) and changes with different types and depth of the water. The form of the absorption and scattering spectra depend on the different biological factors and these are classified by their optical behavior. The absorption of pure water, absorption by chlorophyll-a and absorption by fluvic and humic acids are the main factors of absorption. The chlorophyll-a is the mchlorophyll-ain substchlorophyll-ance thchlorophyll-at mchlorophyll-akes chlorophyll-a group of chlorophyll-a photosynthesizing microorgchlorophyll-anism cchlorophyll-alled phytoplankton and the fluvic and humic acids are the main nutrients for phytoplankton (Johnson et al., 2013). The absorption coefficient a(λ);
a(λ)=aw(λ)+ah0Chexp(-khλ)+a0fCfexp(-kfλ)+ac0(λ) (Cc C c 0
⁄ )
0,602
2.8
Where 𝑎𝑤 is pure water absorption coefficient in 𝑚−1, 𝑎 ℎ
0 is the absorption coefficient of
humic acid in which equals to 𝑎ℎ0 = 18,828 𝑚2(𝑚𝑔)−1, 𝐶
ℎ is the concentration of humic
acid in 𝑚𝑔⁄𝑚3, 𝑘ℎ is the exponential coefficient of the humic acid in which equals to 𝑘ℎ = 0,01105 𝑛𝑚−1, 𝑎𝑓0 is the absorption coefficient of fluvic acid in which equals to 𝑎𝑓0 = 35,959 𝑚2(𝑚𝑔)−1, 𝐶
𝑓 is the concentration of fluvic acid in 𝑚𝑔⁄𝑚3, 𝑘𝑓 is the
exponential coefficient of the fluvic acid in which equals to 𝑘𝑓 = 0,0189 𝑛𝑚−1, 𝑎𝑐0 is the absorption coefficient of chlorophyll-a in 𝑚−1 and 𝐶𝑐0 is the concentration of chlorophyll-a in which equchlorophyll-als to 𝐶𝑐0 = 1 𝑚𝑔
𝑚3
19
Scattering is a change of course of an electromagnetic energy. It weakens the signal by reducing the amounts of photons reaching to the detector. When a photon backscattered photon reaches back to the detector, it travels a much longer path than a photon moving on a straight line, it causes a temporal distortion of the signal. Figure 2.9 shows the forms of scattering in time.
Figure 2.9: Form of Temporal Scattering
Source: STOTTS, L. B. 1978. Closed form expression for optical pulse broadening in multiple scattering media. Applied Optics, 17, 504-504.
The scattering by the pure water and by particle substance are the two biological factors that influence the scattering spectra. Furthermore, it is separated into small and large particles with a different scattering strength and different statistical distribution (Haltrin, 1999). The scattering b(λ) coefficient equation is given below where the back-scattering coefficient is bB(λ), the pure water scattering coefficient is bw(λ) [m-1], the probability of
back-scattering by small particles bs(λ), the probability of back-scattering by large
particles is bl(λ), the specific scattering coefficients for small particles bs0(λ) [𝑚 2
𝑔 ⁄ ], the specific scattering coefficients for large particles bl0(λ) [𝑚
2
𝑔
⁄ ], the concentration of small particles Cs [𝑔⁄𝑚3] and the concentration of large particles Cl [𝑔⁄𝑚3](Haltrin, 1999).
𝑏(𝜆) = 𝑏𝑤(𝜆) + 𝑏𝑠0(𝜆)𝐶
𝑠+ 𝑏𝑙0(𝜆)𝐶𝑙 2.9
𝑏𝐵(𝜆) = 0,5𝑏𝑤(𝜆) + 𝐵𝑠𝑏𝑠0(𝜆)𝐶𝑠+ 𝐵𝑙𝑏𝑙0(𝜆)𝐶𝑙 2.10
20 Bs = 0,039 𝑚2⁄ , 𝐵𝑔 𝑙 = 6,4 × 10⁻⁴ So; 𝑏𝑤(𝜆) = 0,005826 (𝑚−1) (400 𝜆 ) 4,322
,
2.11 𝑏𝑠0(𝜆) = 1,151302 ( 𝑚2 𝑔 ) ( 400 𝜆 ) 1,7,
2.12 𝑏𝑙0(𝜆) = 0,341074 (𝑚2 𝑔 ) ( 400 𝜆 ) 0,3.
2.13The effect of scattering on the attenuation coefficient is much less than absorption, except the particulate-rich water types.
In general, there are 4 types of sea water, pure sea water, clear ocean water, coastal ocean water and turbid harbor. In the pure sea waters, absorption is considered as the sum of the absorption in pure water and the absorption in water with a known amount of salt content. The absorption increases with the increase in wavelength. So, the red wavelength is more attenuated than the blue wavelength and for this reason, the deep ocean water is seen rich blue color. In general, ocean waters are rich with dissolved particles like dissolved salts, minerals and organic matters. The first quantitative classification was derived by a Swedish Oceanographer Nils Gunnar JERLOV. The classification splits the ocean as open (clear) ocean water and coastal water. He categorized the clear ocean waters based on their concentration of suspended particles and their geographical locations. It is subdivided into 4 categories, Type IA, IB, II and III. The coastal waters split into groups 1-9, representing the increasing turbidity. These water types have a much higher concentration of dissolved particles where it increases the turbidity level so the effect of absorption and scattering is also increased. The highest concentration of dissolved particles is in the turbid harbors. It limits the propagation of optical beam due to high absorption and high scattering. In Figure 2.10 the distribution of water types over the earth’s surface is shown.
21
Figure 2.10: The global distribution of Jerlov water types.
Source: APEL, J. R. 1987. Principles of ocean physics, London ; Orlando, Academic Press.
The term of diffuse attenuation coefficient is the most comprehensive measurements of ocean water quality, due to its ease of measurement. This value simplifies the amount of attenuation for a collimated light beam and so the calculation is made just between the diffuse attenuation coefficient, Kd(λ) and the attenuation coefficient, C(λ). However, this
calculation is not straightforward because, Kd(λ) is measured using propagation of solar
radiation through the water. The more comprehensive work is done by Jerlov in 1970’s. By the help of the knowledge of diffuse attenuation coefficient leads scientists to use many sources of ocean information. In
Figure 2.11 it is shown how various water types (The clear ocean waters are assigned
range from cleanest to dirtiest by I-III and the coastal waters are assigned range from 1 to 9.) have a different wavelength dependent diffuse attenuation coefficient.
22
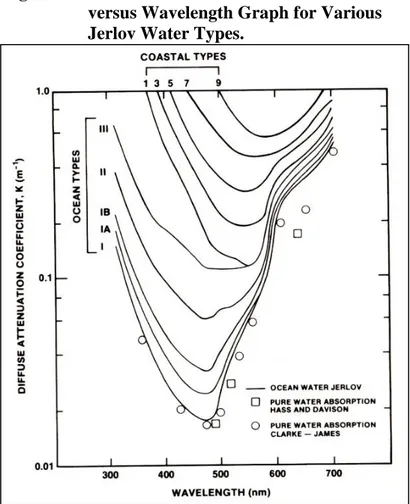
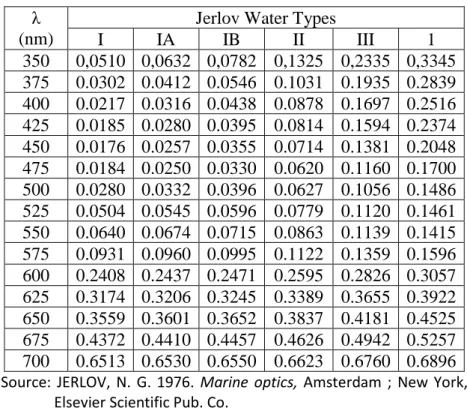
Figure 2.11: The Diffuse Attenuation Coefficient versus Wavelength Graph for Various Jerlov Water Types.
Source: JERLOV, N. G. 1968. Optical oceanography, Amsterdam, New York etc., Elsevier Pub. Co.
The typical values of diffuse attenuation coefficient (𝐾𝑑(𝜆)) associated with wavelength and six major water types are given in Table 2.3.
23
Table 2.3: Wavelength Dependent Diffuse Attenuation Coefficient for Major Water Types.
λ (nm)
Jerlov Water Types
I IA IB II III 1 350 0,0510 0,0632 0,0782 0,1325 0,2335 0,3345 375 0.0302 0.0412 0.0546 0.1031 0.1935 0.2839 400 0.0217 0.0316 0.0438 0.0878 0.1697 0.2516 425 0.0185 0.0280 0.0395 0.0814 0.1594 0.2374 450 0.0176 0.0257 0.0355 0.0714 0.1381 0.2048 475 0.0184 0.0250 0.0330 0.0620 0.1160 0.1700 500 0.0280 0.0332 0.0396 0.0627 0.1056 0.1486 525 0.0504 0.0545 0.0596 0.0779 0.1120 0.1461 550 0.0640 0.0674 0.0715 0.0863 0.1139 0.1415 575 0.0931 0.0960 0.0995 0.1122 0.1359 0.1596 600 0.2408 0.2437 0.2471 0.2595 0.2826 0.3057 625 0.3174 0.3206 0.3245 0.3389 0.3655 0.3922 650 0.3559 0.3601 0.3652 0.3837 0.4181 0.4525 675 0.4372 0.4410 0.4457 0.4626 0.4942 0.5257 700 0.6513 0.6530 0.6550 0.6623 0.6760 0.6896
Source: JERLOV, N. G. 1976. Marine optics, Amsterdam ; New York, Elsevier Scientific Pub. Co.
24
3. MATERIALS AND METHODS
In this chapter, all the experimental work and setup is explained and all the materials together with all the equipment that are used for the project and for the experiments are listed.
3.1 SYSTEM DESIGN
The prototype consists of one setup that has one transmitter system and one receiver system separately. The system design and its components are shown in Figure 3.1.
Figure 3.1: System Design Schematic
3.2 TRANSMITTER DESIGN
The transmitter system consists of one custom made laryngophone design, one sound amplifier (preamplifier) circuit, one system on chip (SOC) module as the modulator, one led driving circuit and one led.
3.2.1 CUSTOM LARYNGOPHONE
Laryngophone is a type of contact microphone that detects vibrations directly from user’s throat, especially from Larynx area that contains the human vocal cords. The Larynx area is shown in Figure 3.2. The advantages of laryngophone are to the sensor capable of picking up speech even in extremely noisy environments, due to its strategical measurement area. Other types of microphones do not function properly under these conditions due to a high level of background noise. As if sound travels much more faster in underwater environmental, laryngophone is the best choice to detect the voice of divers.
25
Figure 3.2: Human Respiratory Passage Anatomy. (Guyton and Hall, 2006)
A sufficiently large volume of air and facial mobility are required in order to speak underwater. (Oceanreef, 2010) A full-face mask or a half mask are used by divers to be able to breath underwater environment. By wearing a full-face mask, divers can speak without having any difficulties, on the other hand, speaking with half mask is difficult while the regulator is in the diver’s mouth. But full-face masks lead diver to consume much more air compared to when they use a half mask.
In our system, a Kingstate KPEG116 piezo transducer was used to detect voice signals. It has 30 V maximum operating voltage and an operating temperature between -30oC
+85oC. Since piezo transducers have high impedance, it needs a preamplifier circuit that
has a high input impedance.
Figure 3.3: Kingstate KPEG116 Piezo Transducer and Frequency Response Graph
First design made by using BF245A, a JFET transistor that produced for many decades by several companies. But it is now discontinued. BF545A has the same electrical
26
characteristic with a different electronic package. Both have a very high input impedance and relatively low noise. In Figure 3.4 the schematic of preamplifier circuit is shown.
Figure 3.4: Schematic of Preamplifier Circuit
The finished design is shown in Figure 3.5.
Figure 3.5: Custom Design Laryngophone
3.2.2 Transmitter Circuit
Transmitter circuit consists of three parts. One microcontroller for quantizing analog signal, one led driver circuit and one led to transmit signal. Most of the microcontrollers have an Analog to Digital Converter to quantize an analog signal. Microcontrollers are
27
capable of detecting Transistor to Transistor Logic (TTL) binary signals. In electronics binary 1 signal represents the supply voltage of the microcontroller and binary 0 signal represents ground of the microcontroller. Binary signals are digital signals that can only be detected by a digital input of the microcontroller. An analog to digital converter (ADC) is a useful feature that converts an analog voltage signal to a digital number.
Arduino Pro Mini is a microcontroller board that designed with Atmega328. It has 14 digital input/output pins, 6 analog inputs, an on-board oscillator and an onboard regulator. Arduino is an open-source platform based on easy to use software and hardware. In Figure 3.6 Arduino Pro Mini development board and its pinout are shown. In Appendix B the open source circuit schematic of Arduino Pro Mini development board is given.
Figure 3.6: Arduino Pro Mini Development Board with Pin Outs
Source: SPARKFUN. 2014. Graphical Datasheet of Arduino Pro Mini 328 - 5V/16MHz [Online].
Sparkfun. Available:
https://cdn.sparkfun.com/datasheets/Dev/Arduino/Boards/ProMini16MHzv1.pdf [Accessed 2017].
28
Table 3.1: Technical Specifications of Arduino Pro Mini Development Board
Microcontroller ATmega328 Power Range 5-12 V Operation Voltage 5V
Digital I/O Pins 14 (6 are PWM capable)
UART 1
SPI 1
I2C 1
Analog Input Pins 6 Max. DC current per I/O pin
40 mA Flash Memory 32 KB
SRAM 2 KB
EEPROM 1 KB
Clock Speed 16 MHz
Not every pin of a microcontroller has an ability to do analog digital conversions. On Arduino Pro Mini board, ADC pins have an “A” in front of its label (A0 to A5). Atmega328 microcontroller has a 10-bit analog to digital conversion capability. It means, it can measure 1024 (210) discrete analog levels. The ADC has a fairly complex working principle. The most common technique uses the analog voltage to charge an internal capacitor, once the capacitor is charged, it starts to discharge across an internal resistor and the capacitor discharge time measured. The microcontroller monitors the number of clock cycles that have passed before the capacitor is discharged and when the ADC is complete, this number of cycles is returned. The ADC value is a ratio metric value; ADC assumes 5V is 1023 and anything lower than 5V is the ratio between 5V and 1023.
𝑟𝑒𝑠𝑜𝑙𝑢𝑡𝑖𝑜𝑛 𝑜𝑓 𝑡ℎ𝑒 𝐴𝐷𝐶 (1023) 𝑆𝑦𝑠𝑡𝑒𝑚 𝑉𝑜𝑙𝑡𝑎𝑔𝑒 (5𝑉) =
𝐴𝐷𝐶 𝑅𝑒𝑎𝑑𝑖𝑛𝑔 (𝑥)
𝐴𝑛𝑎𝑙𝑜𝑔 𝑉𝑜𝑙𝑡𝑎𝑔𝑒 𝑀𝑒𝑎𝑠𝑢𝑟𝑒𝑑 (𝑦) 3.1
For sampling a high impedance, signal Data Input Disable Register (DIDR) of the microcontroller is used. The DIDR is an ADC register that disconnects the digital inputs from the necessary ADC channels. An analog signal causes an electromagnetic interference and it leads the digital input to constantly toggle high and low. It creates excessive noise near the ADC channel. The digital inputs and ADC have an internal capacitance, and what if DIDR not used in ADC process, it will slow down the frequency of the input signal. In general, Arduino does not use DIDR, but it can be activated by adding “DIDR0 = 0x01;” in code. It activates DIDR on analog 0 channel. Atmega328 can work with ADC clock frequency up to 500kHz. By the help of the datasheet of
29
Atmega328, for setting the sampling frequency “ADCSRA = 0xe5;” which needs to be added to the code. It sets the ADC to clock frequency/32, where the clock frequency is 16MHz resulting in 500kHz sampling frequency.
Once the analog signal is quantized, it is needed to be create a driving Pulse Width Modulation (PWM) signal to drive the LED. Atmega328 has a versatile of PWM usage. Simply PWM is a voltage control method, at fixed cycles the amount of power corresponding to the power that system needs for the output. In Figure 3.7 the PWM signal shown with constant remaining cycles.
Figure 3.7: PWM Signal
In the system PWM signal is used to generate a carrier frequency to the voice signal. Normally Voltage Controlled Oscillators (VCO) are used for frequency modulation (FM) or phase modulation (PM). But VCO circuits are more complicated rather than microcontrollers. It requires discrete components to setup the carrier frequency. In Figure
3.8 the FM modulation on a PWM modulation is shown. The signal is now inside a Phase
Locked Loop (PLL) with a constant cycle. PLLs are commonly used to generate, modulate, demodulate, filter or recover a noisy signal.
Figure 3.8: PWM with Frequency Modulation
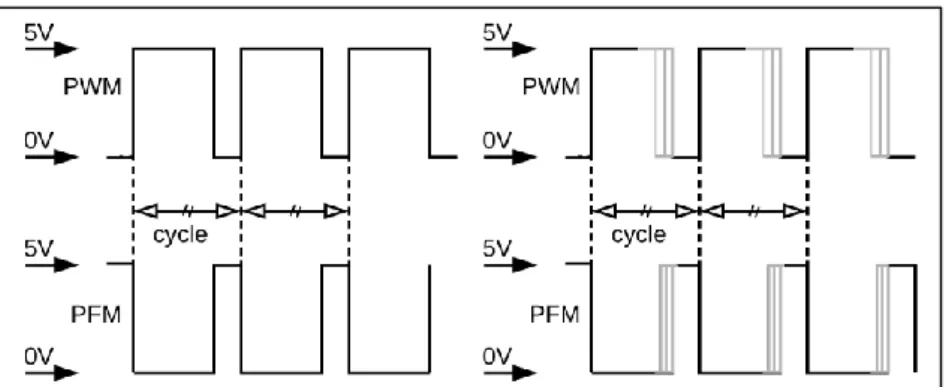
In this system, a Pulse Frequency like Modulation (PFM) is used. It is more energy efficient and most likely the inverse of PWM signals. In Figure 3.9 the difference between PWM and PFM like signals are shown with Frequency Modulation. Arduino is not
30
capable of generating high frequency PFM like signals. By using an inverting MOSFET, the circuit now is capable of converting PWM signal into PFM like signal.
Figure 3.9: PWM versus PFM like Signal and with Frequency Modulation
The cycle length is the same for each signal value, and this is set as the MAX value that the counter will handle. It is also called the resolution of the signal and determined as the duty cycle. The MAX value is 255 and the lower value is 0 for Atmega328, therefore, with 8-bit resolution, 256 possible positions can be obtained by 28. The higher MAX value
means the higher bit depth, but it lowers the frequency. Arduino is capable of generating 12 different PWM frequencies with 12 different bit depths. In Table 3.2 it is shown the different PWM frequencies with corresponding bit depths and “PWM_FREQ” that is needed to be assigned in code.
Figure 3.10: Carrier Frequency, Original Signal and Modulated Signal Chart
31
Table 3.2: The PWM Frequencies with Corresponding Bit Depths and Code Settings
Fast – PWM_MODE 1
Frequency PWM_FREQ Bit Depth
Fcpu=16 MHz Value Single Dual
250 kHz 0x003F 6-bit 12-bit 125 kHz 0x007F 7-bit 14-bit 62,5 kHz 0x00FF 8-bit 16-bit 31,3 kHz 0x01FF 9-bit N/A 15,6 kHz 0x03FF 10-bit N/A 7,81 kHz 0x07FF 11-bit N/A 3,91 kHz 0x0FFF 12-bit N/A 1,95 kHz 0x1FFF 13-bit N/A 976 Hz 0x3FFF 14-bit N/A 488 Hz 0x7FFF 15-bit N/A 244 Hz 0xFFFF 16-bit N/A
122 Hz N/A N/A N/A
The 62,5 kHz is the most suitable frequency that can be chosen. It is above the human hearing frequency of 20 kHz and it has the 8-bit and 16-bit depth options when a single or dual PWM used. Dual PWMs are the mixture of an upper and lower value to generate one analog signal. It most likely corrects the signal errors and leads high resolution signal. The code is written in C language and Arduino sketch is used to compile and upload the code to microcontroller board. The written C code is given in Appendix C section. The electronic schematic of transmitter circuit is shown in Figure 3.11.
Figure 3.11: The Schematic of Transmitter Circuit.
3.2.3 LED
The wavelength of the LED is very important for underwater optical communication. The wavelength is directly correlated with the diffuse attenuation coefficient. For
32
determination of λ, the April 2013 data set of Aqua MODIS satellite are used. The coordinates of data are 39° 4'48.00"N and 26°39'36.00"S, between Lesbos Island and Turkey in the Aegean Sea. (Figure 3.12)
The attenuation coefficient is calculated with empirical formulas. To derivate Kd, in 1981,
Austion and Petzold made a linearization to a sample data of irradiance and radiance. (Austion and Petzold, 1981)
𝐾𝑑 ⃗⃗⃗⃗ (𝜆) = 𝐾𝑤(𝜆) + 𝐴 [ 𝐿𝑤(𝜆1) 𝐿𝑤(𝜆2)] 𝐵 3.2 Where, = 0,15645 , 𝐿𝑤 =𝑅𝑟𝑠(𝜆) 𝐸𝑑(𝜆) ⁄ , 𝐵 = −1,5401, λ=488 nm is the wavelength that Kd will be calculated, λ1 = 555 nm and λ2 = 488 nm are two wavelengths within the
blue-green spectral region, Kw(488~490) = 0,016 m-1 is the pure water diffuse attenuation
coefficient in 488 nm. 𝐾𝑑 ⃗⃗⃗⃗ (488) = 0,016 + 0,15645 × [𝑅𝑟𝑠(488)𝐸𝑑(488) 𝑅𝑟𝑠(555)𝐸𝑑(555)] −1,5401 (3.3) Note that
𝐸
𝑑(488
)𝐸
𝑑(555
)⁄ is approximately equal to 1,03, because the value for different sun angles at the surface varies slightly. (Lee et al., 2005) 𝑅𝑟𝑠(488) = 0,00463 𝑠𝑟−1 and 𝑅
𝑟𝑠(555) = 0,00166 𝑠𝑟−1 are taken from the data of Aqua Modis
Satellite. (Figure 3.13) 𝐾𝑑 ⃗⃗⃗⃗ (488)= 0,016 + 0,15645 × [1,03 × 0,00463 0,00166] −1,5401 = 0,04679 𝑚−1 3.4
33
Figure 3.12: The Location and The Data Set of April 2013 Aqua Modis Satellite.
Figure 3.13: The Display of Data Set of April 2013 Aqua Modis Satellite.
It is seen that calculated 𝐾⃗⃗⃗⃗ (488) value is 0,04679 m𝑑 -1 and the satellite data value of
𝐾𝑑
⃗⃗⃗⃗ (488) is 0,05342 m-1. The approximation is around ±0,00663. For these coordinates,
it is determined from Table 2.3 that Aegean Sea is water type IB for 500nm wavelength. The spectra of downwelling irradiance In Figure 3.14 the irradiance/transmittance versus wavelength graphic is given for each water types. When it is compared with wavelength
34
dependent diffuse attenuation coefficient of Jerlov, (Table 2.3) 505 nm is the optimal wavelength that can be chosen for the application.
Figure 3.14: Graphic of Irradiance/Transmittance versus Wavelength on Different Water Types.
Source: JERLOV, N. G. 1976. Marine optics, Amsterdam ; New York, Elsevier Scientific Pub. Co.
For each prototype one LCML-PE01-0070 Luxeon Rebel High Power Cyan Led is used.
Figure 3.15: Luxeon Rebel LED (LXML-PE01-0070)
35
Table 3.3: LXML-PE01-0070 Luxeon LED Specifications
LED Color Cyan
Lumens @ 350 mA 76 Lumens @ 700 mA 122 Efficacy (lm/W) @ 350mA 75 Efficacy (lm/W) @ 700mA 51 Typical Wavelength (nm) 490 to 520 Wavelength Range (nm) 505 Beam Angle 125
Recommended Operating Current (mA) 700 Maximum Rated Drive Current (mA) 1000 Typical Forward Voltage (Vf) 3.25 Maximum Forward Voltage (Vf) 3.51 Thermal Resistance (C°/W) 10 Maximum Junction Temperature (C°) 150 Operating Temperature Range (C°) -40-135 Dimensions L x W x H (mm) 4.5 x 3 x 2
The laws of Lambert and Beer also can be used for calculating the weakening of the light under the water.(Bazeille et al., 2012) The Beer-Lambert law is given by:
𝐼𝜆,𝑑 = 𝐼𝜆,0 × 𝑒−𝐾𝜆𝑑 3.5
Where, λ is the wavelength, Iλ,d is the intensity of light with λ wavelength at a distance d
from the light source, Iλ,0 is the intensity of light with λ wavelength at the light source.
Since the intensity and the beam angle of the LED are respectively 76 lumens and 125o, it gives 656,3 lux for 1 centimeter distance.
Figure 3.16: The Light Intensity versus Distances of LED plotted from Matlab Code
36
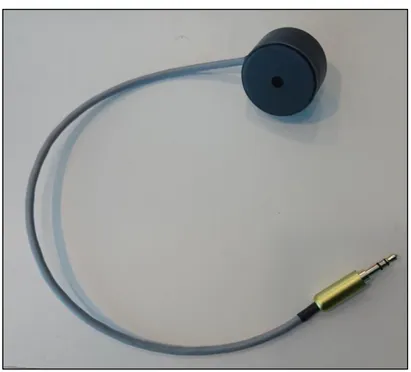
For getting better results, it is needed to decrease the beam angle, so a OPC1-2-COL reflector is used on the LEDs. It reduces the LED output beam angle to 13o.
Figure 3.17: OPC1-2-COL Reflector Photo and Size Chart.
Figure 3.18: Finished Transmitter Unit
3.3 Receiver Design
The receiver system consists of one custom made photo detector array, one transimpedance amplifier (preamplifier) circuit, one signal conditioning and demodulator circuit, one sound amplifier circuit and a custom-made bone conductive speaker design.
3.3.1 Custom Photo Detector Array
Photodiodes are very small photo-voltaic cells. Typically, they have a much smaller surface area to minimize the capacitance and they are optimized to minimize leakage
37
currents and noise. When a photon hits the surface of a photodiode, electrons start to mobilize by producing currents which is proportional to the number of photons.
Photodiodes are available in a variety of sizes from the “small area” to the “large area”. The difference between these is the surface area size of the silicon substrate that effects the device capacitance. The small area photodiodes are mostly used in high-speed receivers due to its low capacitance. The low capacitance allows better frequency response. Most of the silicon photodiodes have the best optical response in the near-infrared wavelengths around 750-900 nm, but they still have a reasonable optical response in the lower portion of the spectrum.
The silicon-based PIN photodiode BPW34 is very common in the market. It has a variety of usage due to wide range spectral response, low internal capacitance, low price and market availability. The spectral response of BPW34 is given on Figure 3.20.
Figure 3.19: Silicon Based PIN Photodiode BPW34
38
The radiant sensitive area of BPW34 is 7.5 mm2. Four BPW34 are connected in parallel for increasing the surface area to 30 mm2. It also increases the internal capacitance to 160 pF, that it is directly related to receiver frequency capability. One can note that the capacitance value did not cause any problem with receiving frequency. The electrical characteristics of BPW34 are listed in Table 3.4.
Table 3.4: The Electrical Characteristics of BPW34
Parameters Test Conditions Min. Typ. Max.
Breakdown Voltage IR=100 uA 60 V - -
Reverse Dark Current VR=10 V - 2 nA 30 nA
Diode Capacitance VR=3 V, f=1 MHz - 25 pF 40 pF
Range of Spectral Bandwidth
- - 430 to 1100 nm -
Rise Time VR=10 V, RL=1 kohm,
λ= 820 nm - 100 ns -
Fall Time VR=10 V, RL=1 kohm, λ= 820 nm
100 ns
39
3.3.2 Receiver Circuit
The receiver circuit consists of three parts. A photodetector with preamplifier, signal conditioning, demodulation and sound amplifier. The receiver circuit design is shown in Figure 3.22.
Figure 3.22: Receiver Circuit
To acquire a good quality signal with a photodiode, it is needed to use an amplifier to boost the signal. A transimpedance amplifier is the most suitable amplifier method that can be used. When a current is provided to the input of the transimpedance amplifier, it produces a voltage proportional to its input current. OPA381 has over 250kHz transimpedance bandwidth with high precision and with very low 1/f noise. Photodiodes will source around 200µA, OPA381 offers a low impedance input and it allows to apply enough conversation gain to boost the signal and converts it to voltage. The basic circuit example is given on Figure 3.23.
40
Figure 3.23: OPA381 Datasheet Transimpedance
Amplifier
After the signal acquired from the transimpedance amplifier, a high precision JFET input operational amplifier LF356 is used for conditioning the signal. When the modulated signal acquired, it enters to LMC568. LMC568 is a low power phase locked loop integrated circuit. A phase locked loop (PLL) is a circuit makes a specific framework that track with another. A PLL consists of a phase detector and a voltage controlled oscillator. The input signal is compared with the phase of the voltage controlled oscillator output, by the phase detector and an error signal is produced. In all applications, the PLL circuit tracks the phase of the input signal, locks it and demodulates the signal. The reference circuit design is taken from the datasheet of LMC568. After the demodulated signal is obtained, pure voice communication signal, it is needed to be amplified.