FEN VE MÜHENDİSLİK DERGİSİ
Cilt: 9 Sayı: 2 sh. 63-76 Mayıs 2007SEISMIC PERFORMANCE ASSESSMENT OF
REINFORCED CONCRETE STRUCTURES
(BETONARME YAPILARIN
SİSMİK PERFORMANSININ DEĞERLENDİRİLMESİ)
Taner UÇAR*, Mustafa DÜZGÜN**
ABSTRACT/ÖZET
In this study, determination of the performance levels of structural systems by the Capacity Spectrum Method and the Displacement Coefficients Method, which are used to determine performance levels of structures by considering structural capacity obtained from pushover analysis is intended. For this purpose, five-storey reinforced concrete 3D frame system structures having the same floor plan are considered in the analysis. Also, to observe the differences in the performance levels, a sample structure having same story heights in the first phase and then first story height is increased in order to examine the weak story irregularity is taken into consideration. Structures are designed in accordance with Turkish Standards (TS 500) and the Turkish Earthquake Code. Life safety (LS) structural performance level is chosen as a target for the sample structures under a design earthquake that may be exceeded in a 50-year period with 10 percent probability. The capacity curves of the sample structures are obtained from pushover analysis and their performance levels are determined by the Capacity Spectrum Method and the Displacement Coefficients Method.
Bu çalışmada yapı sistemlerinin artımsal itme analizi ile belirlenen yapısal kapasitesini esas alan ve yapıların performans seviyesinin belirlenmesinde kullanılan Kapasite Spektrumu Yöntemi ve Deplasman Katsayıları Yöntemi ile performans seviyelerinin belirlenmesi amaçlanmıştır. Bu amaçla, kat planları aynı olan beş katlı betonarme çerçeveli sistemli yapılar dikkate alınmıştır. Ayrıca performans seviyelerindeki farklılıkları görmek üzere seçilen yapının önce tüm katları aynı yükseklikte tasarlanmış, daha sonra zemin kat yükseklikleri arttırılarak ortaya çıkan zayıf kat düzensizliğinin etkisi irdelenmeye çalışılmıştır. Yapılar, TS 500 ve DBYBHY 2007 kuralları çerçevesinde tasarlanmıştır.Kullanılan yapı sistemleri için 50 yıllık süreç içinde aşılma olasılığı %10 olan tasarım depremi etkisi altında can güvenliği (CG) performans seviyesi hedeflenmiştir. Artımsal itme analizi ile yapıların kapasite eğrileri elde edilmiş ve Kapasite Spektrumu Yöntemi ve Deplasman Katsayıları Yöntemi ile performans seviyeleri belirlenmiştir.
KEYWORDS/ANAHTAR KELİMELER
Pushover analysis, Capacity spectrum method, Displacement coefficients method, Performance level
Artımsal itme analizi, Kapasite spektrumu yöntemi, Deplasman katsayıları yöntemi, Performans seviyesi
*Dokuz Eylül Üniversitesi, Mimarlık Fakültesi, Mimarlık Bölümü, İZMİR
1. INTRODUCTION
Various analysis methods, both elastic (linear) and inelastic (nonlinear), are available for the analysis of reinforced concrete structures. The methods that take part in codes and used for analyses of structures under lateral loads, are generally based on linear-elastic behaviour of structures under earthquake effects. In linear-elastic analysis of structural systems, elastic earthquake forces are reduced according to defined reduction factor, which varies based on typical inelastic response of structural systems. Although an elastic analysis gives a good indication of the elastic capacity of structures and indicates where first yielding will occur, but it can not predict failure mechanism of structure and account for redistribution of forces during the progressive yieldings (ATC 40, 1996).
The damages and the economical losses during the last major earthquakes (Loma Prieta earthquake and Northridge earthquake), introduced a new approach in seismic design of structures called ‘Performance Based Design and Evaluation’. In performance based design and evaluation of structures under earthquake effects, it is necessary to determine the nonlinear behaviour of structures. Both nonlinear time history analysis and nonlinear static analysis procedures are used for this objective. The most basic inelastic analysis method, known as the Time History Analysis, is considered very complex and impractical for general use. For this reason, nonlinear static analysis methods have become popular.
The central focus of the nonlinear static analysis methods is the generation of the capacity curve or pushover curve. This curve represents lateral displacement as a function of the force applied to the structure. The use of nonlinear static analysis methods for design and evaluation helps engineers to understand better how structures will behave when subjected to major earthquakes, where it is assumed that the elastic capacity of the structure will be exceeded (ATC 40, 1996).
The most common used nonlinear static analysis procedures for the evaluation of the performance levels of structures are the Capacity Spectrum Method, which uses the intersection of the capacity curve with a reduced response spectrum to estimate the maximum displacement and the Displacement Coefficients Method, which provides a direct numerical process for calculating the displacement demand.
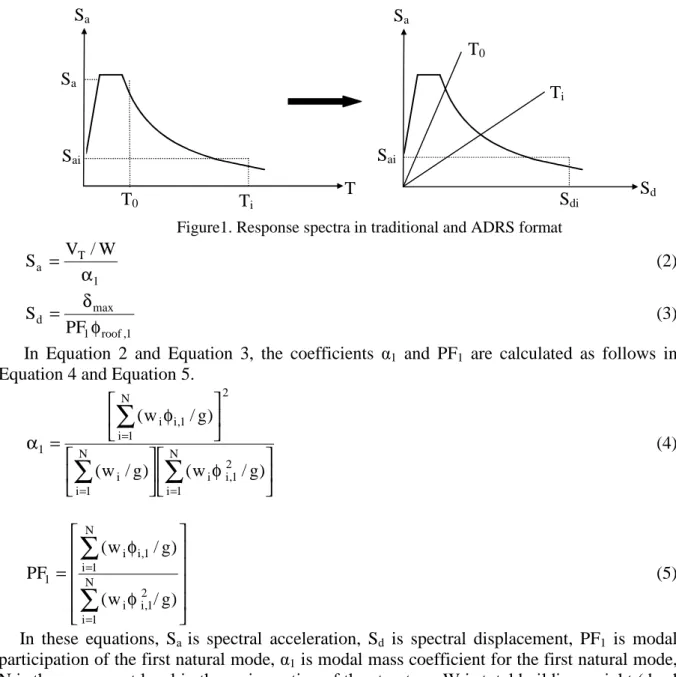
2. CONCEPTUAL DEVELOPMENT OF THE CAPACITY SPECTRUM METHOD Application of the Capacity Spectrum Method requires both the demand response spectra and structural capacity curves to be plotted in the spectral acceleration vs. spectral displacement format which is known as Acceleration-Displacement Response Spectra (ADRS). In order to convert a spectrum from the traditional spectral acceleration, Sa vs
period, T format found in the building code to ADRS format, it is necessary to determine the value of Sdi for each point on the curve, Sai, Ti (Figure 1). This can be done by Equation 1
(ATC 40, 1996). 2 2 ai di 4 T S S π = (1) In order to use the Capacity Spectrum Method, it is also necessary to convert the capacity curve obtained from pushover analysis in terms of base shear, VT and roof displacement, δmax
to the capacity spectrum (Figure 2). Capacity spectrum is the representation of the capacity curve in ADRS format. This transformation can be done by using Equation 2 and Equation 3.
Figure1. Response spectra in traditional and ADRS format
1 T a W / V S α = (2) 1 , roof 1 max d PF S φ δ = (3) In Equation 2 and Equation 3, the coefficients α1 and PF1 are calculated as follows in
Equation 4 and Equation 5.
φ φ = α
∑
∑
∑
= = = ) g / w ( ) g / w ( ) g / w ( N 1 i 2 1 , i i N 1 i i 2 1 , i N 1 i i 1 (4) φ φ =∑
∑
= = N 1 i 2 1 , i i N 1 i 1 , i i 1 ) g / w ( ) g / w ( PF (5)In these equations, Sa is spectral acceleration, Sd is spectral displacement, PF1 is modal
participation of the first natural mode, α1 is modal mass coefficient for the first natural mode,
N is the uppermost level in the main portion of the structure, W is total building weight (dead weight of building plus likely live loads), Wi/g is mass assigned to level i, φi,1 is amplitude of
mode 1 at level i and φroof,1 is normalized amplitude of mode 1 at roof level.
Figure 2. Conversion of capacity curve to capacity spectrum
T Sa T0 Ti Sa Sai Sd Sdi Sa Sai T0 Ti (δmax ) VT Capacity Curve Vi δi Sd Sa Capacity Spectrum Sai Sdi
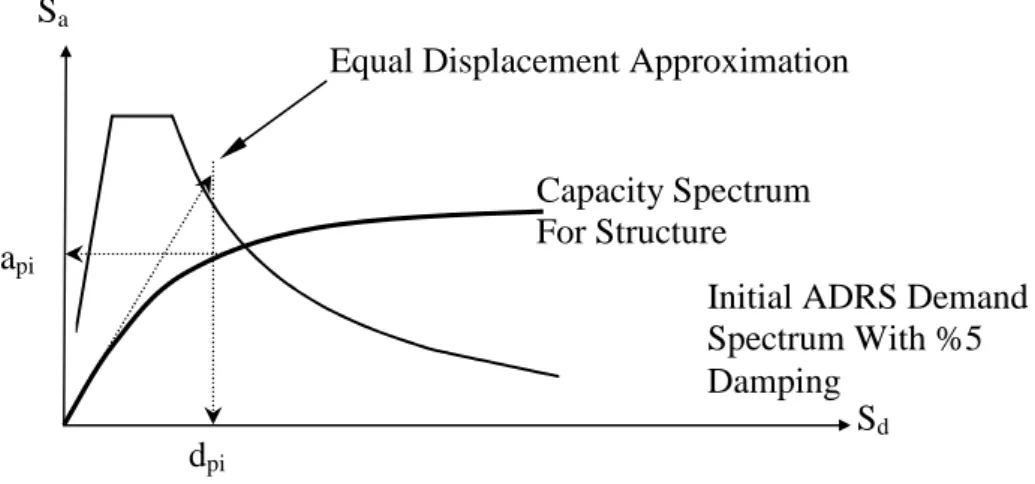
After the representation of response spectra and capacity curves in ADRS format, an initial performance (maximum acceleration api and displacement dpi) point is selected. This
may be based on equal-displacement approximation as shown in Figure 3 or any other point based on engineering judgment (FEMA 440, 2004).
Figure 3. Selection of initial performance point
Another step in the Capacity Spectrum Method is the construction of bilinear representation of capacity spectrum. A bilinear representation of the capacity spectrum is needed to estimate the effective damping and appropriate reduction of spectral demand. This bilinearezation defines the initial period, T0, yield displacement, dy, and yield acceleration, ay
(Figure 4).
By using the values obtained from bilinear representation of capacity spectrum, the values of post-elastic stiffness, α, and ductility, μ, can be calculated as follows in Equation 6 and Equation 7 (FEMA 440, 2004).
Figure 4. Bilinear representation of capacity spectrum
Sa dpi Sd Capacity Spectrum For Structure api
Initial ADRS Demand Spectrum With %5 Damping
Equal Displacement Approximation
Sa dpi Sd Capacity Spectrum For Structure api
Bilinear Representation Of Capacity Spectrum T0
ai
dy
Area 1
− − = α y y y pi y pi d a d d a a (6) y pi d d = µ (7) By using the calculated values of post-elastic stiffness and ductility, the corresponding effective damping, βeff, and the corresponding effective period, Teff, can be calculated.
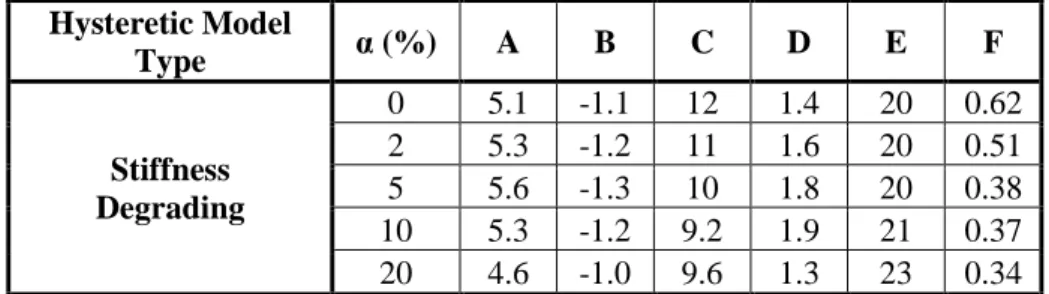
Effective viscous damping values for all hysteretic model types and alpha values have the following form, where β0 is hysteretic damping (FEMA 440, 2004):
0 3 2 eff =A(µ−1) +B(µ−1) +β β for μ < 4.0 (8a) 0 eff =C+D(µ−1)+β β for 4.0 ≤ μ ≤ 6.5 (8b) 0 2 0 eff 2 eff T T ) 1 ( F 1 ) 1 ( F E +β − µ − − µ = β for μ > 6.5 (8c) Values of the coefficients in these equations for effective damping of the hysteretic model type are given in Table 1 (FEMA 440, 2004).
Table 1. Coefficients to be used in equations 8a, 8b, 8c for effective damping Hysteretic Model Type α (%) A B C D E F Stiffness Degrading 0 5.1 -1.1 12 1.4 20 0.62 2 5.3 -1.2 11 1.6 20 0.51 5 5.6 -1.3 10 1.8 20 0.38 10 5.3 -1.2 9.2 1.9 21 0.37 20 4.6 -1.0 9.6 1.3 23 0.34
Effective period values for all hysteretic model types and alpha values have the following form (FEMA 440, 2004):
[
]
0 3 2 eff G( 1) H( 1) 1T T = µ− + µ− + for μ < 4.0 (9a)[
]
0 eff I J( 1) 1T T = + µ− + for 4.0 ≤ μ ≤ 6.5 (9b) 0 eff 1 1 T ) 2 ( L 1 ) 1 ( K T + − − µ + − µ = for μ > 6.5 (9c) Values of the coefficients in the equations for effective period of the hysteretic model type are shown in Table 2 (FEMA 440, 2004).Using the effective damping, βeff, B(βeff) which is used to adjust spectral acceleration
ordinates, is calculated (FEMA 440, 2004). (%) ln 6 . 5 4 B eff β − = (10) Spectral acceleration ordinates are adjusted with the equation given below (FEMA 440, 2004).
) ( B ) S ( ) S ( eff 5 % a a β = β (11)
Table 2. Coefficients to be used in equations 9a, 9b, 9c for effective period Hysteretic Model Type α (%) G H I J K L Stiffness Degrading 0 0.17 -0.032 0.10 0.19 0.85 0.00 2 0.18 -0.034 0.22 0.16 0.88 0.02 5 0.18 -0.037 0.15 0.16 0.92 0.05 10 0.17 -0.034 0.26 0.12 0.97 0.10 20 0.13 -0.027 0.11 0.11 1.00 0.20
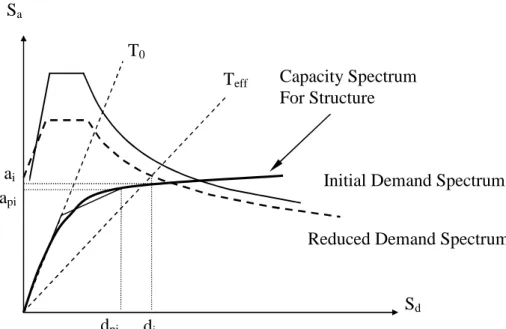
The estimated maximum displacement, di, is determined by using the intersection of the
radial effective period, Teff, with the ADRS adjusted for βeff. The estimated maximum
acceleration, ai, corresponds to di on the capacity curve (Figure 5).
The estimated maximum displacement, di, is compared with the initial assumption. If it is
within acceptable tolerance (0.95dpi ≤ di ≤ 1.05dpi), the performance point corresponds to ai
and di. If it is not within the acceptable tolarance, the procedure mentioned above is repeated.
Figure 5. Determination of estimated maximum displacement using direct iteration
The obtained ai and di values are converted to base shear and maximum roof displacement
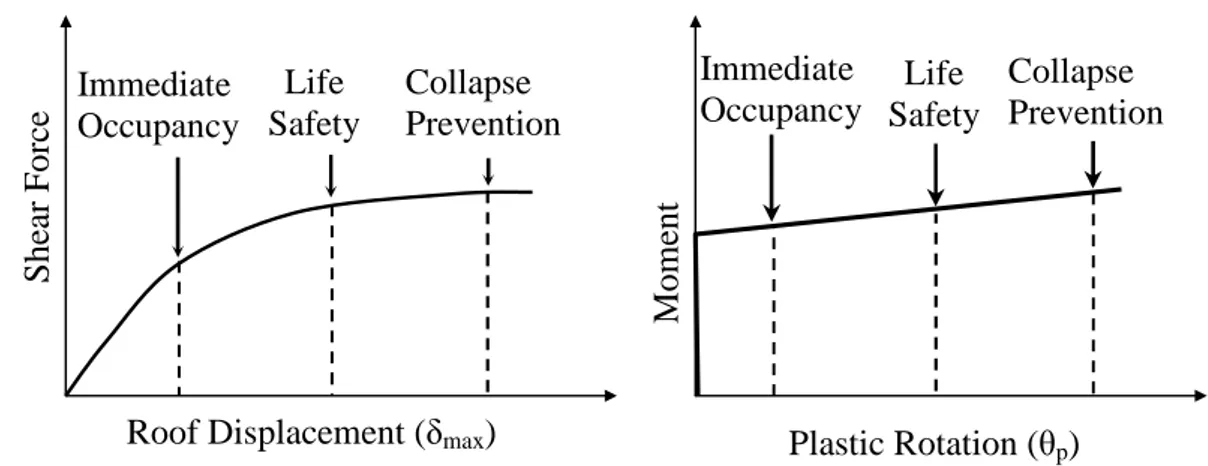
by using the following equations. W S VT =α1 a (12) d 1 , roof 1 max =PFφ S δ (13) To determine the performance level of a structure, the structure is statically pushed to the performance point. Comparing the maximum displacement value and internal force-deformation states with the limit values, the performance level of the structure can be determined (İrtem and Türker, 2002) (Figure 6).
Sa dpi Sd Capacity Spectrum For Structure api T0 ai di Teff
Initial Demand Spectrum
Figure 6. Determination of performance level
3. THE DISPLACEMENT COEFFICIENTS METHOD
The Displacement Coefficients Method provides a direct numerical process for calculating the displacement demand. It does not require converting the capacity curve into spectral coordinates.
The nonlinear force-displacement relationship between base shear and displacement shall be replaced with an idealized relationship to calculate the effective lateral stiffness, Ke, and
effective yield strength, Vy, of the structure. This relationship shall be bilinear, with initial
slope Ke and post yield slope Ks. Line segments on the idealized force-displacement curve
shall be located using an iterative graphical procedure that approximately balances the area above and below the curve. The effective lateral stiffness, Ke, shall be taken as the secant
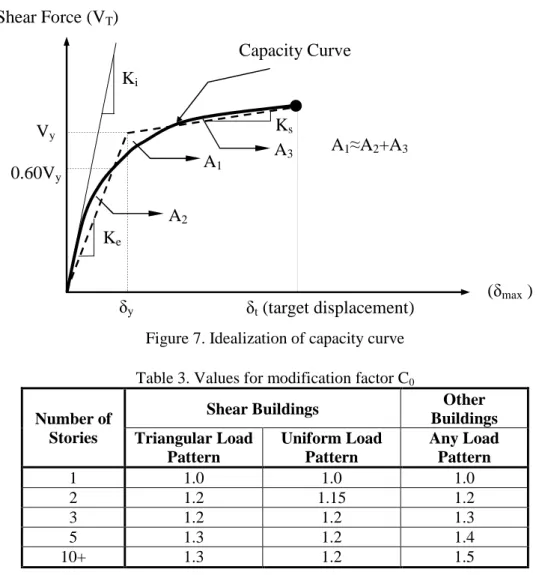
stiffness calculated at the base shear force corresponding to 60% of the effective yield strength of the structure (ATC 40, 1996) (Figure 7).
The effective fundamantal period in the direction under consideration shall be based on the idealized force-displacement curve and can be calculated in accordance with the Equation 14. e i i e K K T T = (14)
where Ti is elastic fundamental period in the direction under consideration calculated by
elastic dynamic analysis, Te is effective period of the structure, Ki is elastic lateral stiffness of
the structure in the direction under consideration and Ke is effective lateral stiffness of the
structure in the direction under consideration.
The target displacement shall be calculated in accordance with Equation 15 (FEMA 440, 2004). g 4 T S C C C 2 2 e a 2 1 0 T π = δ (15) In this equation C0 is modification factor to relate spectral displacement of an equivalent
single degree of freedom system to the roof displacement of multi degree of freedom system. C0 can be taken as the first modal participation factor (PF1φroof,1) at the level of the control
node, the modal participation factor at the level of the control node is calculated using a shape vector corresponding to the deflected shape of the structure at the target displacement or the appropriate value from Table 3.
Plastic Rotation (θp) Immediate Occupancy Collapse Prevention Life Safety Immediate Occupancy Life Safety Collapse Prevention
Roof Displacement (δmax)
S h ear F o rce Mo m ent
Figure 7. Idealization of capacity curve
Table 3. Values for modification factor C0
Number of Stories
Shear Buildings Other
Buildings Triangular Load Pattern Uniform Load Pattern Any Load Pattern 1 1.0 1.0 1.0 2 1.2 1.15 1.2 3 1.2 1.2 1.3 5 1.3 1.2 1.4 10+ 1.3 1.2 1.5
C1 is the modification factor which relates expected maximum inelastic displacements to
displacements calculated for linear elastic response. C1 can be determined from Equation 16.
2 e 1 aT 1 R 1 C = + − (16) where Te is the effective fundamental period of the single degree of freedom model of the
structure in seconds and R is the strength ratio computed with Equation 17. The constant , a, is equal to 130, 90 and 60 for the site classes B, C and D, respectively.
m y a C W / V S R= (17) Cm is the effective mass factor from Table 4. Cm shall be taken as 1.0 if the fundamental
period, T, is greater than 1.0 second. For periods greater than 1.0 sec., C1 may be assumed to
be 1.0.
C2 is the modification factor to represent the effect of pinched hysteretic shape, stiffness
degradation and strength deterioration on maximum displacement response. It is recommended that the C2 coefficient to be as follows.
2 2 T 1 R 800 1 1 C − + = (18) C1 may be assumed to be equal to 1.0 for periods greater than 0.7 sec.
Shear Force (VT) (δmax ) Capacity Curve δy δt (target displacement) 0.60Vy Vy Ke Ks Ki A2 A1 A3 A1≈A2+A3
Table 4. Values for effective mass factor Cm No. of Stories Concrete Moment Frame Concrete Shear Wall Concrete Pier- Spandrel Steel Moment Frame Steel Concentric Braced Frame Steel Eccentric Braced Frame Other 1-2 1.0 1.0 1.0 1.0 1.0 1.0 1.0 ≥3 0.9 0.8 0.8 0.9 0.9 0.9 1.0 4. CASE STUDIES
To determine the performance levels, five-storey reinforced concrete 3D frame system structures having the same floor plan are considered in the analyses. To observe the differences in the performance levels, the above mentioned five-storey reinforced concrete structure is taken into consideration with the same story heights (story height=3m) and then in the second phase, the first story height (first story heights=5m) is increased intentionally to examine the weak story irregularity.
Two five-storey reinforced concrete 3D frame system structures are designed geometrically and materially in accordance with TS 500 and the Turkish Earthquake Code (TS500, 2000; DBYBHY, 2007). Life safety structural performance level is chosen as a target for the sample structures under a design earthquake that may be exceeded in a 50-year period with 10 percent probability (DBYBHY, 2007).
In the study; the five-storey reinforced concrete 3D frame system structure with the same story heights is symbolized as RC 5.1., the five-storey reinforced concrete 3D frame system structure with the increased first story height is symbolized as RC 5.2..
The floor plan of the structures considered in the analyses are given in Figure 8.
Figure 8. Floor plan for the RC 5.1. and the RC 5.2.
The parameters used in the design of the five-storey reinforced concrete 3D frame system structures and the dimensions of structural members are given in Table 5.
5 m 5 m 5 m 5 m 1 2 3 4 5 A B C D E 5 m 5 m 5 m 5 m
Table 5. The parameters used in the design of the five-storey reinforced concrete 3D frame system structures and the dimensions of the structural members
Five-storey Reinforced Concrete 3D Frame System Structures (RC 5.1. and RC 5.2.)
Earthquake Zone 1
Effective Ground Acceleration Coefficient, A0 0.40
Soil Type Z2
Structure Importance Coefficient, I 1
Structural System Behaviour Coefficient, R 8
Concrete Type C20
Steel Type S420
Slab Thickness (cm) 12
Dimensions of Beams (cm) [In all stories] 25x50
Dimensions of Columns (cm) [In all stories] 50x50
4.1. Pushover Curves of The Structures
To obtain the pushover curves of the structures SAP 2000 Structural Analysis Programme is used (CSI SAP 2000 V-8.1.5, 2002). In pushover analyses of the structures, plastic hinge hypothesis is taken into consideration. In that hypothesis, it is assumed that plastic deformations are considered to gather in sections called plastic hinge and other parts of system behave linear elastic. For effective stiffness values, the values given in FEMA 356 are used. In the performance evaluations of the structures, limit values for different performance levels given in FEMA 356 in terms of plastic hinge rotation are taken into consideration (FEMA 356, 2000). Capacity curves obtained from the pushover analyses are presented in Figure 10 for the sample structures.
Figure 10. Capacity curves of the five-storey reinforced concrete 3D frame system structures
The results obtained from the Capacity Spectrum Method For the sample structures are presented below. In Table 7, δmax is the displacement value and VT is the shear force value at
the calculated performance point.
RC 5.1. RC 5.2.
Table 7. Performance point values of the structures obtained by the Capacity Spectrum Method Structure Type 1 roof,1 PFφ α1 Teff (sec) Βeff (%) Sa (g) Sd (cm) δmax (cm) VT (kN) RC 5.1. 1.275 0.828 1.192 15.800 0.225 10.40 13.260 3160.040 RC 5.2. 1.225 0.931 1.410 13.197 0.155 13.20 16.170 2525.928
By performing the calculation steps of the Displacement Coefficients Method, the performance point of the sample structures are determined and the corresponding values of that point are given in Table 8.
Table 8. Performance point values of the structures obtained by the Displacement Coefficients Method Structure Type C0 C1 C2 Sa (g) Te (sec) δmax (cm) VT (kN) RC 5.1. 1.275 1.026 1.009 0.576 0.797 12.000 3180.5181 RC 5.2. 1.225 1.017 1.000 0.468 1.034 15.478 2531.7773
4.2. Determination of Performance Levels of the Structures
The performance levels of the sample structures are determined by both using the Capacity Spectrum Method and the Displacement Coefficients Method. The numbers of plastic hinges occurred in structural members, the maximum plastic hinge rotations, the maximum story drifts and the performance levels which are determined with the two methods, are given below.
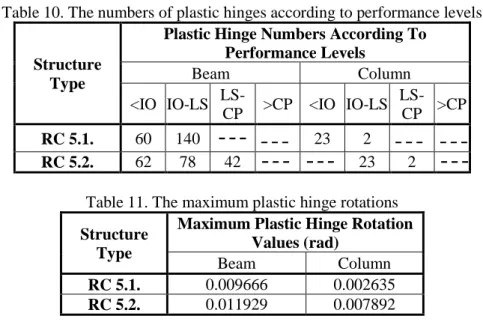
4.2.1. Determination of Performance Levels by Using the Capacity Spectrum Method To evaluate the performance levels of the sample structures, the structures are statically pushed to the target displacement value, which was determined by the Capacity Spectrum Method. The numbers of plastic hinges in beams and columns, the maximum plastic hinge rotations in the performance point and the maximum total drifts of the structures statically pushed to the performance point are given in Table 10, Table 11 and Table 12 respectively.
Table 10. The numbers of plastic hinges according to performance levels
Structure Type
Plastic Hinge Numbers According To Performance Levels Beam Column <IO IO-LS LS-CP >CP <IO IO-LS LS-CP >CP RC 5.1. 60 140 23 2 RC 5.2. 62 78 42 23 2
Table 11. The maximum plastic hinge rotations Structure
Type
Maximum Plastic Hinge Rotation Values (rad)
Beam Column
RC 5.1. 0.009666 0.002635
Table 12. The maximum story drifts Structure Type Maximum Story Drift (%) Performance Level RC 5.1. 1.146 IO-LS RC 5.2. 1.319 IO-LS
According to the values given in Table 10, Table 11 and Table 12, the performance levels of the sample structures are determined. The performance level of the five-storey reinforced concrete 3D frame system structure with the same story heights (RC 5.1.) is found to be between the Immediate Occupancy and the Life Safety. For the five-storey reinforced concrete 3D frame system structure with the increased first story height (RC 5.2.), the performance level between the Life Safety and the Collapse Prevention is obtained.
4.2.2. Determination of Performance Levels by Using the Displacement Coefficients Method
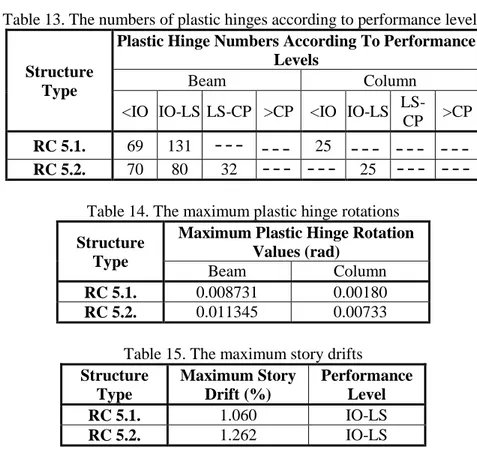
To evaluate the performance levels of the sample structures, the structures are statically pushed to the target displacement value, which was determined by the Displacement Coefficients Method. The numbers of plastic hinges in beams and columns, the maximum plastic hinge rotations in the performance point and the maximum total drifts of the structures statically pushed to the performance point are given in Table 13, Table 14 and Table 15 respectively.
Table 13. The numbers of plastic hinges according to performance levels
Structure Type
Plastic Hinge Numbers According To Performance Levels
Beam Column
<IO IO-LS LS-CP >CP <IO IO-LS
LS-CP >CP
RC 5.1. 69 131 25
RC 5.2. 70 80 32 25
Table 14. The maximum plastic hinge rotations Structure
Type
Maximum Plastic Hinge Rotation Values (rad)
Beam Column
RC 5.1. 0.008731 0.00180
RC 5.2. 0.011345 0.00733
Table 15. The maximum story drifts Structure Type Maximum Story Drift (%) Performance Level RC 5.1. 1.060 IO-LS RC 5.2. 1.262 IO-LS
Using the values given in Table 13, Table 14 and Table 15, the performance levels of sample structures are determined. The performance level of the five-storey reinforced concrete 3D frame system structure with the same story heights (RC 5.1.) is found to be between the Immediate Occupancy and the Life Safety. For the five-storey reinforced
concrete 3D frame system structure with the increased first story height (RC 5.2.), the performance level between the Life Safety and the Collapse Prevention is obtained.
5. CONCLUSIONS
In this study, it is intended to determine the performance levels of structural systems under earthquake effects by using the Capacity Spectrum Method and the Displacement Coefficients Method, which are both used to determine performance levels of structures by considering structural capacity obtained from pushover analysis. For this purpose, five-storey reinforced concrete 3D frame system structures having the same floor plan are considered in the analyses. To observe the differences in the performance levels, the above mentioned five-storey reinforced concrete structure is taken into consideration having the same story heights in the first phase and then the first story height is increased intentionally in order to examine the weak story irregularity.
Two five-storey reinforced concrete 3D frame system structures are designed geometrically and materially in accordance with TS 500 and the Turkish Earthquake Code. Life safety structural performance level is chosen as a target for the sample structures under a design earthquake that may be exceeded in a 50-year period with 10 percent probability.
Considering the performance levels for the sample structures obtained by the Capacity Spectrum Method and the Displacement Coefficients Method, it can be said that the mentioned two methods gives nearly the same performance levels.
According to the performance evaluation with the Capacity Spectrum Method and the Displacement Coefficients Method, the five-storey reinforced concrete 3D frame system structure with the same story heights (RC 5.1.) can easily get the Life Safety performance level under the design earthquake. For the five-storey reinforced concrete 3D frame system structure with the weak story irregularity (RC 5.2.), the obtained performance levels are worse than the performance levels of the five-storey reinforced concrete 3D frame system structure having the same story heights (RC 5.1.). In the sample structure with the weak story irregularity, the values of plastic hinge rotations in beams and columns (especially in the first story colums) and the story drifts are increased.
Considering the results obtained from this study, the earthquake behaviour of the structure with the weak story irregularity is in the negative aspect. In case with weak story irregularity, the total earthquake force that the structure can resist, which is called the seismic capacity of the structure, is decreased.
REFERENCES
ATC 40 (1996): “ATC 40 Seismic Evaluation and Retrofit of Concrete Buildings (V.1)”, Washington DC.
CSI SAP 2000 V-8.1.5. (2002): “Integrated Finite Element Analysis and Design of Structures Basic Analysis Reference Manual”, Computer and Structures Inc., Berkeley, California. DBYBHY (2007): “Deprem Bölgelerinde Yapılacak Binalar Hakkında Yönetmelik”, İnşaat
Mühendisleri Odası İzmir Şubesi Yayını, Bayındırlık ve İskan Bakanlığı.
FEMA 356 (2000): “FEMA 356 Prestandart and Commentary For The Seismic Rehabilitation Of Buildings”, Washington DC.
FEMA 440 (2004): “FEMA 440 Improvement of Nonlinear Static Seismic Analysis Procedures”, Washington DC.
İrtem E., Türker K. (2002): “Yapıların Deprem Yükleri Altındaki Lineer Olmayan Davranışının Belirlenmesinde Kullanılan Statik Yöntemlerin Karşılaştırılması”, Balıkesir Üniversitesi IV. Mühendislik-Mimarlık Sempozyumu, sf. 425-436.
TS 500 (2000): “TS500 Betonarme Yapıların Tasarım ve Yapım Kuralları”, Türk Standartları Enstitüsü.