The European Research Journal
http://www.eurj.org
Original
Article
e-ISSN: 2149-3189 DOI: 10.18621/eurj.376346
The importance of red cell distribution width and
neutrophil-lymphocyte ratio as a new biomarker in
rheumatoid arthritis
Tuba Tülay Koca1, Aydın Arslan2, Filiz Çiledağ Özdemir3, Ejder Berk11Department of Physical Medicine and Rehabilitation, Sütçü İmam University School of Medicine, Kahramanmaraş, Turkey 2Department of Orthopaedics and Traumatology, Gelişim University School of Medicine, Elit Medical Center, İstanbul, Turkey 3Department of Physiotherapy and Rehabilitation, İnönü University Faculty of Health Sciences, Malatya, Turkey
ABSTRACT
Objective. Rheumatoid arthritis (RA) is a long-lasting autoimmune disorder that primarily affects the joints.
Various biomarkers have been used for the prognosis and clinical follow-up. There are few studies that have investigated whether or not neutrophil-lymphocyte ratio (NLR) and red cell distribution width (RDW) are good indicators of systemic inflammation. The present study aims to explore the prognostic value of RDW and NLR in rheumatoid arthritis (RA) as a new inflammatory marker. Methods. RA patients (n = 124) who presented to the Rheumatology outpatient clinic in our hospital between March 2015 and May 2015 were included in this study retrospectively. As a first group, 47 clinically active RA patients who had high acute phase proteins were included. In the second group, 73 clinically in-remission RA patients who had normal acute phase proteins were included. Fifty-five healthy volunteers constituted the control group. Results. The mean RDW was found to be 15.2 ± 2.9 in the active group; 14.6 ± 2 in the inactive group and 13.4 ± 1.4 in the control group (p < 0.01). The mean NLR was found to be 3.7 ± 2.2 in the active group; 3.7 ± 1.6 in the inactive group and 3.2 ± 0.9 in the control group (p = 0.190). There were statistically significant differences between the RDW values of the active-period RA patients with the control group (p < 0.01). There was statistically significant difference between RDW values of active RA and inactive RA patients (p < 0.01). The NLR results between the RA group and the control group (p = 0.700); the active RA group, and the inactive RA group (p = 0.169) were similar. There was not statistically difference between the NLR values of active RA patients with the control group (p = 0.360). There was statistically difference between the NLR values of inactive RA patients with the control group (p = 0.047). Conclusion. RDW was found higher in all RA group than control, additionally was also higher in active RA group than remission group. NLR values of remission group was higher than control.
Eur Res J 2018
Keywords: rheumatoid arthritis, erythrocyte distribution width, biomarker, neutrophil-lymphocyte ratio
Address for correspondence:
Tuba Tülay Koca, MD., Assistant Professor, Sütçü İmam University School of Medicine, Department of Physical Medicine and Rehabilitation, Kahramanmaraş, Turkey E-mail: [email protected]
Introduction
Rheumatoid arthritis (RA) is a long-lasting autoimmune disorder that primarily affects the joints. It typically results in warm, inflated, and painful joints [1]. The course of disease in RA is variable. Various biomarkers have been used for the prognosis and clinical follow-up [1, 2].
Red cell distribution width (RDW) is a measurement that shows heterogeneity of erythrocyte volume, a condition also known as anisocytosis. RDW has been shown in recent studies to be increased in inflammatory as well as in arteriosclerotic cardiac diseases [2].
The neutrophil to lymphocyte ratio (NLR) is usually calculated by dividing the number of neutrophils into the number of lymphocytes in peripheral blood samples; it can sometimes be obtained from infiltrated tissue cells such as tumor tissue [3, 4]. This ratio has been used as a subclinical inflammation marker for many diseases. RDW and NLR are one of the important total blood cell count parameters [1-4].
Sometimes, markers such acute phase proteins, C-reactive protein (CRP) and erythrocyte sedimentation rate (ESR) are insufficient to show disease activity. Acute phase proteins are insufficient to indicate a systemic inflammatory response, because they increase only as an indirect result of local inflammatory processes. In addition, ESR and CRP values can be affected by a recent infection and therefore are nonspecific for prediction of the inflammation [5-8].
However, there are few studies that have investigated whether or not NLR and RDW are good indicators of systemic inflammation. The present study aims to explore the prognostic value of RDW and NLR in RA as a new inflammatory marker.
Methods
RA patients (n = 124) who attempt to the Rheumatology outpatient clinic of our hospital between March 2015 and May 2015 were included in this study. As a first group, 47 clinically active RA patients who had high acute phase proteins were included. In the second group, 73 clinically in-remission RA patients who had normal acute phase proteins were included. Fifty-five healthy volunteers constituted the control group.
Diagnosis of RA was done according to the 2010 American College of Rheumatology (ACR)/ The European League Against Rheumatism (EULAR) classification criteria. Inclusion criteria were RA diagnosis without any infection, any other systemic inflammatory disease, trauma history, bleeding and malignancy. Biochemical, hematological, and inflammatory parameters were measured. Clinical anamnesis and complete blood parameters and derivates, RDW and NLR values, rheumatoid factor (RF, 0-20), CRP (0-4.9 mg/L), ESR (0-20 mm/h) were obtained from the hospital data in all groups. Laboratory parameters CRP > 15 mg/L, ESR > 28 mm/h values were accepted as high inflammation together with clinical signs.
The study approved by the local ethics committee and was adhered to the principles of Helsinki declaration.
Statistical Analysis
The SPSS 16 version was used for data analysis. Descriptive data were presented as mean ± standard deviation and median scores. The coherence of variables to normal distribution (normality) was analyzed using the Kolmogorov–Smirnov test. One-way Anova and student t tests were used to analyze normally distributed data and Kruskall Wallis test was used to compare abnormal distrubuted data among groups. A P value of <0.05 was considered statistically significant.
Results
Descriptive characteristics of the groups were shown in Table 1. The mean age of RA patients in the active period was 53.5 ± 13.7 years; the mean age of RA patients in the inactive period of the disease was 48.7 ± 13.61 years; the mean age of the control group was 48.3 ± 13.81 years (p = 0.027).
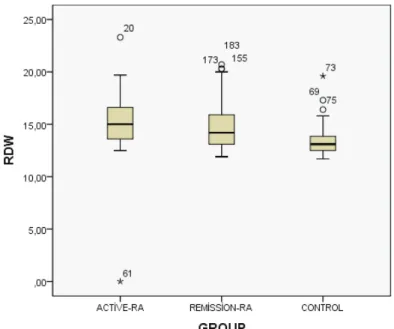
The mean RDW was found to be 15.2 ± 2.9 in the active group; 14.6 ± 2 in the inactive group and 13.4 ± 1.4 in the control group (p < 0.01). The mean NLR was found to be 3.7 ± 2.2 in the active group; 3.7 ± 1.6 in the inactive group and 3.2 ± 0.9 in the control group (p = 0.190).
There were statistically significant differences between the RDW values of the active-period RA patients with the control group (p < 0.01) (Figure 1)
!
Figure 1.Boxplot of red cell distribution width (RDW) values among the groups.
!
Figure 2.Histogram of neutrophil-lymphocyte Ratio (NLR) values between rheumatoid arthritis (number 1) and control (number 0) groups.
Table 1. Characteristics of demographic and laboratory data
Active RA
(n = 47) Inactive RA (n = 73) Control (n = 55) p value
Age (year) Gender (M/F) Sedimentation (mm/h) CRP (mg/dL) Leukocyte (!103) Erythrocyte (!103) Thrombocyte (K/mm3) Hemoglobin (gr/dL) Lymphocyte (!103) Monocyte (!103) Basophil (!103) Eosinophil (!103) RDW (%) NLR (%) 53.5 ± 13.7 9/52 49.51 ± 13.4 2.22 ± 2.9 7.68 ± 1.7 4.73 ± 0.4 297.0 ± 65.0 13.06 ± 1.26 2.16 ± 0.67 0.67 ± 0.23 0.05 ± 0.02 0.14 ± 0.09 15.2 ± 2.9 3.7 ± 2.2 48.7 ± 13.61 13/64 20.00 ± 9.30 0.52 ± 0.28 7.75 ± 2.42 4.8 ± 0.40 268.8 ± 49.4 13.55 ± 1.12 2.3 ± 0.89 0.62 ± 0.21 0.05 ± 0.02 0.18 ± 0.13 14.6 ± 2 3.7 ± 1.6 48.3 ± 13.81 13/43 17.38 ± 9.05 0.39 ± 0.22 7.45 ± 1.93 4.92 ± 0.47 263.49 ± 53.80 14.06 ± 1.70 2.34 ± 0.64 0.52 ± 0.19 0.04 ± 0.02 0.17 ± 0.11 13.4 ± 1.4 3.2 ± 0.9 0.027 0.47 < 0.01 0.02 0.370 0.270 0.110 < 0.01 0.570 0.870 0.080 0.370 < 0.01 0.190 Data are shown as mean ± standard deviation. CRP = C- reactive protein (CRP), NLR = neutrophil-lymphocyte ratio, RA = rheumatoid arthritis, RDW = red cell distribution width
(Table 1). There was statistically significant difference between RDW values of active RA and inactive RA patients (p < 0.01).
The NLR results between the RA group and the control group (p = 0.700); the active RA group, and the inactive RA group (p = 0.169) were similar. There was not statistically difference between the NLR values of active RA patients with the control group (p = 0.360). There was statistically difference between the NLR values of inactive RA patients with the control group (p = 0.047).
When we divide our RA patients into two groups on the bases of RF-positive and RF-negative, statistically difference was found in RDW values between the groups (p = 0.041) (Table 2) (Figure 2).
Discussion
RA is a chronic autoimmune disease that is characterized by widespread synovitis results in joint damage and erosion in the articular cartilage and marginal bone [1]. RA pathophysiology shares the common cascades with atherosclerosis, including endothelial dysfunction related to the underlying chronic inflammation [5].
At the onset of the disease, many patients are negative for the rheumatoid factor (RF), but 85% of the patients will show positivity in the course of disease. High RF levels indicate destructive joint disease6. In recent years, many laboratory tests specific to disease monitoring have been developed in RA [9].
RDW is a quantitative measurement that shows the volume heterogeneity of red blood cells and RDW has been used in differential diagnosis of anemia. Many studies have shown that RDW, also called anisocytosis, increases during systemic inflammation or the cardiometabolic effect [6, 7]. In addition to differential diagnosis of anemia, recent evidence shows that anisocytosis is an important indication for cancer, cardiovascular disease, venous thromboembolism, diabetes, community-acquired pneumonia, chronic obstructive pulmonary disease,
kidney and liver failure, and other acute and chronic illness [10, 11].
It is a well-known fact that red blood cell life is approximately 120 days, and rapid changes in RDW values are more powerful for predicting chronic inflammation in RA patients with acute infections as compared with ESR and CRP levels. Many studies have found RDW to be positively correlated with CRP and ESR [12-14].
In the study by Baynes et al. [15], which evaluated hematological parameters of 265 RA patients, measurements of iron-related RDW of RA patients were studied. In all study groups, a slight decrease in hemoglobin and mean corpuscular volume (MCV) values were found to be related to an increase in RDW, ESR, and platelet levels. In another study by Hassan
et al. [16], RDW level was found to be a useful
parameter to show inflammation and high risk of progress. A high level of RDW also had a strong and independent correlation with ESR and CRP in systemic lupus erythematosis [17, 18], Sjögren syndrome [19], systemic sclerosis [20], and familial mediterranean fever [21] patients in recent studies. RDW has also been found to be related to cardiovascular disease in various diseases [22].
High numbers of neutrophils are mostly associated with poor prognosis and an increased mortality rate. In recent years, studies that addressed the relation between inflammation and neutrophils subtypes have shown an increasing trend. It has been reported that the NLR value increases in response to activity in various inflammatory diseases [22-26]. However, the clinical importance of these values for evaluating RA progression remains unclear. In the study by Mercan
et al. [23], NLR was shown to be an inexpensive and
easily measurable method for evaluating the disease activity in patients with RA and AS. According to the study by Fu et al. [24], the NLR is found positively correlated with ESR, CRP, and disease activity score (DAS 28) values in RA patients. Uslu et al. [25] have reported that NLR and the platelet-lymphocyte ratio (PLR) values showed a positive correlation in RA patients. Another study by Tekeoglu et al. [26] also showed that mean platelet volume (MPV) and NLR values change according to activity level of the disease.
The NLR has also been used as a marker for various systemic autoimmune diseases such as ankylosing spondylitis [27], familial mediterranean fever [21, 28], Behçet syndrome [29], Sjögren syndrome [19], systemic lupus erythematosus [30],
Table 2. Comparisons of RF presence with RDW/NLR
RF negative RA
(n = 60) RF positive RA (n = 64)
RDW
NLR p = 0.041 p = 0.260
NLR = neutrophil-lymphocyte ratio, RA = rheumatoid arthritis, RF = rheumatoid factor, RDW = red cell distribution width !
and psoriasis [31]. In recent years, complete blood parameters and derivates are guiding us in showing the severity of diseases especially in inflammatory rheumatic diseases [32-34].
In this study, statistically significant differences of RDW values among the three groups have led us to think that the RDW might be positively related to inflammation and also to ESR and CRP values. ESR and CRP values were used to separate the two groups of RA patients. Those two parameters sometimes are not able to diagnose active disease, in half of active RA patients these parameters may be found normal. They are also affected by the infection. On the other hand, RDW values of both RA groups were found higher compared with those of the control group. This indicates that RDW can be used as an inflammation marker, both in diagnosis and clinical follow-up. When RA patients were separated into two groups as RF positive and negative, it was observed that the RDW value was higher in positive group. According to that result, we can conclude that RDW might be used as a biomarker for determining the severity of the disease.
We compared the values of NLR among all three groups. We only found a statistically difference between the NLR values of remission period-RA patients with control group. In the light of this result, we may say that NLR may show chronic inflammation. We should also conclude that there could be other factors that affect NLR. İn elderly patients who are in an active period of the disease may be seen as normal in laboratory and it may have affected the results of the study. Additionally, NLR was not found to be related with the RF. In young patients at an early stage of the disease, the positivity of RF is 15%, which is independent of disease progression; it becomes positive over time. These younger patients could have affected the results of the study.
The Limitations of the Study
One of the limitation of our study is having a small sample size due to low prevalence of the disease. Additionally as it is a retrospective study, we could not calculate DAS 28 score because most of the patients’ visual analogous score (VAS), number of tender and swollen joints and duration of morning stiffness were not found in the hospital data. İn most of RA patients chronic anemia is observed over time. But we didnt consider the hemoglobin, vitamin B12, and folic acid values that may affect the RDW values.
Conclusions
According to our study; RDW was found higher in all RA group than control, additionally was also higher in active RA group than remission group. NLR values of remission-RA group was found higher than control. Biomarkers that measures the activity of RA disease is a rapidly growing field in recent years. RDW and NLR biomarkers might contribute as a potential marker to detect diagnosis and disease activity in RA patients.
Conflict of interest
The authors disclosed no conflict of interest during the preparation or publication of this manuscript.
Financing
The authors disclosed that they did not receive any grant during conduction or writing of this study.
References
[1] Majithia V, Geraci SA. Rheumatoid arthritis: diagnosis and management. Am J Med 2007;120:936-9.
[2] Nishimura K, Sugiyama D, Kogata Y, Tsuji G, Nakawaza T, Kawano S, et al. Meta-analysis: diagnostic accuracy of anti-cyclic citrullinated peptide antibody and rheumatoid factor for rheumatoid arthritis. Ann Intern Med 2007;146:797-808.
[3] Wang X. Neutrophil to lymphocyte ratio in relation to risk of all-cause mortality and cardiovascular events among patients undergoing angiography or cardiac revascularization: a meta-analysis of observational studies. Atherosclerosis 2014;234: 206-13.
[4] Wang J. The clinical significance of tumor-infiltrating neutrophils and neutrophil-to-CD8+ lymphocyte ratio in patients with resectable esophageal squamous cell carcinoma. J Transl Med 2014;12:7. [5] Chimenti MS, Triggianese P, Conigliaro P, Candi E, Melino G, Perricone R.The interplay between inflammation and metabolism in rheumatoid arthritis. Cell Death Dis 2015;17:e1887.
[6] Giles JT. Cardiovascular disease in rheumatoid arthritis: Current perspectives on assessing and mitigating risk in clinical practice. Best Pract Res Clin Rheumatol 2015;29:597-613.
[7] Salvagno GL, Sanchis-Gomar F, Picanza A, Lippi G. Red cell distribution width: a simple parameter with multiple clinical applications. Crit Rev Clin Lab Sci 2015;52:86-105.
[8] Goodnow CC. Multistep pathogenesis of autoimmune disease. Cell 2007;130:25-35.
[9] Holzınger D, Föll D. [Biomarkers for chronic inflammatory diseases]. Z Rheumatol 2015;74:887-97. [Article in German] [10] Sanmartí R, Gómez-Puerta JA. [Biomarkers in rheumatoid arthritis]. Rheumatol Clin 2011;6S3:S25-8. [Article in Spanish] [11] Sertoglu E, Kayadibi H, Uyanık M. Is single red cell distribution width without iron, folic acid and vitamin B12 enough to decide? Hepatol Res 2014;44:1371.
[12] Peng YF, Zhang Q, Cao L, Liu Y, Chen D, Sun YK, et al. Red blood cell distribution width: a potential marker estimating disease activity of ankylosing spondylitis. Int J Clin Exp Med 2014;7:5289-95.
[13] Peristein TS, Weuve J, Pfeffer MA, Beckman JA. Red blood cell distribution width and mortality risk in a community-based prospective cohort. Arch Intern Med 2009;169:588-94.
[14] Harrington AM, Ward PC, Kroft SH.I ron defiency anemia, beta-thalassemia minor, and anemia of chronic disease: a morphologic reappraisal. Am J Clin Pathol 2008;29:466-71.
[15] Baynes RD, Bothwell TH, Bezwoda WR, Gear AJ, Atkinson P. Hematologic and iron-related measurements in rheumatoid arthritis. Am J Clin Pathol 1987;87:196-200.
[16] Hassan S, Antonelli M, Ballou S. Red cell distribution width: a measure of cardiovascular risk in rheumatoid arthritis patients. Clin Rheumatol 2015;34:1053-7.
[17] Vaya A, Hernandez JL, Calvo J, Mıco L, Romagrolı M, et al. RDW in patients with systemic lupus erythematosus influence of anemia and inflammatory markers. Clin Hemorrheol Microcirc 2013;54:333-9. [18] Hu ZD, Chen Y, Zhang L, Sun Y, Huang YL, Wang QQ, et al. Red blood cell distribution width is a potential index to asses the disease activity of systemic lupus erythematosus. Clin Chim Acta 2013;425:202-05.
[19] Hu ZD, Sun Y, Guo J, Huang YL, Qin BD, Gao Q, et al. Red blood cell distribution width and neutrophil/lymphocyte ratio are positively correlated with disease activity in primary Sjögren's syndrome. Clin Biochem 2014;47:287-90.
[20] Farkos N, Szabo A, Larond V, Sarlos DP, Minier T, Prohaszka Z, et al. Clinical usefullness of measuring red blood cell distribution witdh in patients with systemic sclerosis. Rheumatology (Oxford) 2014;53:1439-45.
[21] Özer S, Yılmaz R, Sönmezgöz E, Karaaslan E, Taşkın S, Bütün İ, et al. Simple markers for subclinic inflammation in patients with familial mediterranean fever. Med Sci Monit 2005;21:298-303.
[22] Rodriguez-Carrio J, Alperi-Lopez M, Lopez P, Alonso-Castro S, Ballina-Garcia FJ, Suarez A. Red cell distribution width is associated with cardiovascular risk and disease parameters in rheumatoid arthritis. Rheumatology (Oxford) 2015;54:641-6.
[23] Mercan R, Bitik B, Tufan A, Bozbulut UB, Atas N, Ozturk MA, et al. The association between neutrophil/lymphocyte ratio and disease activity in rheumatoid arthritis and ankylosing spondylitis. J Clin Lab Anal 2016;30:597-601.
[24] Fu H, Qin B, Hu Z, Ma N, Yang M, Wei T, et al. Neutrophil- and platelet-to-lymphocyte ratios are correlated with disease activity in rheumatoid arthritis. Clin Lab 2015;61:269-73.
[25] Uslu AU, Küçük A, Şahin A, Ugan Y, Yılmaz R, Güngör T, et al. Two new inflammatory markers associated with disease activity score-28 in patients with rheumatoid arthritis: neutrophil-lymphocyte ratio and platelet-lymphocyte ratio. Int J Rheum Dis 2015;18:731-5.
[26] Tekeoğlu İ, Gürol G, Harman H, Karakeçe E, Çiftçi İH. Overlooked hematological markers of disease activity in rheumatoid arthritis. Int J Rheum Dis 2016;19:1078-82.
[27] Gökmen F, Akbal A, Reşorlu H, Gökmen E, Güven M, Aras AB, et al. Neutrophil-lymphocyte ratio connected to treatment options and inflammation markers of ankylosing spondylitis. J Clin Lab Anal. 2015;29:294-8.
[28] Uslu AU, Deveci K, Korkmaz S, Aydin B, Senel S, Sancakdar E, et al. Is neutrophil/lymphocyte ratio associated with subclinical inflammation and amyloidosis in patients with familial Mediterranean fever? Biomed Res Int 2013;2013:185317.
[29] Alan S, Tuna S, Türkoğlu EB. The relation of neutrophil-to-lymphocyte ratio, platelet-to-neutrophil-to-lymphocyte ratio, and mean platelet volume with the presence and severity of Behçet's syndrome. Kaohsiung J Med Sci 2015;31:626-31.
[30] Qin B, Ma N, Tang Q, Wei T, Yang M, Fu H, et al. Neutrophil to lymphocyte ratio (NLR), platelet to lymphocyte ratio (PLR) were useful markers in assessment of inflammatory response and disease activity in SLE patients. Mod Rheumatol 2016;26:372-6.
[31] Kim DS, Shin D, Lee MS, Kim HJ, Kim DY, Kim SM, et al. Assessments of neutrophil to lymphocyte ratio and platelet to lymphocyte ratio in Korean patients with psoriasis vulgaris and psoriatic arthritis. J Dermatol 2016;43:305-10.
[32] Koca TT. Does obesity cause chronic inflammation? The association between complete blood parameters with body mass index and fasting glucose. Pak J Med Sci 2017;33:65-69.
[33] Yunchun L, Yue W, Jun FZ, Qizhu S, Liumei D. Clinical significance of red blood cell distribution width and inflammatory factors for the disease activity in rheumatoid arthritis. Clin Lab 2016;62:2327-31.
[34] He Y, Liu C, Zeng Z, Ye W, Lin J, Ou Q. Red blood cell distribution width: a potential laboratory parameter for monitoring inflammation in rheumatoid arthritis. Clin Rheumatol 2018;37:161-7.