8. 134 (1978) 8. 134 (1978)
Structure Activity Relationship (SAR) Studies on the Tricyclic Antidepressor Compounds Marketed in Turkey. II*
Türkiyede Satılan Trisiklik Antidepresör Bileşikler Üzerinde Yapı Etki Ilişkisi Araştırmaları. II*
Ningur NOYANALPAN**
INTRODUCTION
Tricyclic compounds consititute an important class of the anti-depressor medicinals°. One of the rings in these compounds is seven membered. This seven membered ring has a nitrogen atom in aze-pin derivatives, two nitrogen atoms in diazeaze-pin derivatives, an oxy-gen atom in oxepin derivatives or all—carbon in cycloheptatrien derivatives.
Various analytical aspects of tricyclic antidepressor compounds have been investigated. Among these thin layer chromatography separation methods, (2-8) quantitative determinations with ultraviolet spectrophotometer, (9-1 1) colorimetric determinations (12), and sepa-rations with tic using azeotrop mixtures (6) can be mentioned.
More than one goal have been considered in undertaking this research. First of all it is quite evident in present time that one can produce valuable informations about the mechanisms of effect of the medicinals by using the SAR methods (13). In fact from time to time with the SAR methods an unusual behaviour of the organism can be brought to the level of comprehension, i.e. in this research the compounds which were the subject to study have been accumu-lated along two lines of different a, and a o values and also of diffe-
Redaksiyona verildiği tarih: 30 Mayıs 1978 * for previous paper see. This Journal 8, 80 1978
rent r and s values. Considering this feature one may conclude that these compounds produce their effects in the organism by interac-ting with two different species of enzymes or in short with two different mechanisms. Another feature of this research is the applicability in practice. The cost of biological tests is getting higher everyday. Therefore it is very &sirable to establish some means of estimating the quantity of a new compound that produces a respond in a biological system, before commencing the experiments. This would save a lot of time and waste of money. With this re-search it now seems possible to estimate the dosage of a new com-pound having the same structural and biological properties before starting a biological experiment.
For the sake of SAR studies a number of parameters have been used. (14-18) One of these parameters which is most frequently and successfully used is the log P. (19,20), Others have not been exploited that much. In this research n—octanol has been used as the organic phase for the determination of partition coefficients. For this deter-mination a preliminary procedure was required. All of the com-pounds are salts of various kinds. Therefore they had to be transformed
into organic bases to provide their solubiıity in organic medium. But this transformation had to be in such a way as to simulate the biological medium. Thus all of the compounds have been dissolved in water, the pH of the solution has been brought to 7.8 and the parti-tion coefficients have been determined using these aqueous soluparti-tions and n—octanol. This pH value is the closest to that of the biological medium where the absorbtion of such compounds is the highest.
After the dei ermination of log P of each compond the graphs have been drawn, by using allways the log P values on the abscissa and either LD 50 (Molar concentration) itself or logarithmic values of it on the ordinate.
Also a series of chromatographic studies has been done to find out the solvent system that gives the best separation. After calcu-lating RM values graphs have been drawn by plotting them versus LD500m. c.) . Although the graphs are similar to Graph I the cor-relations are not as good.
EXPERIMENTAL
All of the compounds processed in this research have been me-dicinal degree pure, melting point and IR spectrum of each compo-und have been compared with the catalog data. All of the solvents have been supplied from Merck, Riedel or Aldrich. n—octanol has been purified by column distillation over NaOH. The ultraviolet spectrophotometer has been a Pye—Unicam SP-1700. The melting points have been determined with a Büchi SMP-20 apparatus and giyen without correction. In thin layer chromatography studies a mixture of Kieselgel G and Kieselgel HF 254 (90 -I- 10) has
been
used on the plates of dimensions 10x10 cm or 20x20 cm with a la-yer thickness of 0.3 mm. The plates have been run in tanks of2 O x 20 cm dimensions checked under UV light then sprayed with vanillin, reagent.Entire calculations have been performed with a TI-58 prog-rammable calculator equipped with a PC-100 A.
Derivation of Standard Lines
10.0 mg from each compound has been weighed predsely, where weighing precisely was not possible a larger amount was dis-solved in water and corresponding amount in millilitres has been abstracted. The aqueous solution containing 10.0 mg of compound has been brought to a volume close to 50 mı. The pH of the solu-tion was adjusted to 7.8 by 0.01 N NaOH solusolu-tion. When the pH adjustment was completed the volume of the solution was preciseiy 50.0 ml.
Starting from these solu tions primarily standard graphs have been prepared. Three different dilutions have been used at a time. 1.0 ml from each solution has been diluted to 10.0 ml. 20.0 mı and 40.0 ml. A part of each solution has been transfered into a UV chamber of 1 cm pathlength, the absorbances have been measured at certain wavelengths. Using the absorbance values at different dilutions standard graphs have been prepared and also parameters have been derived.
Determination of Partition Coefficients
Precisely 25.0 nil has been taken from the 50.0 ml solution of compoiınd (thus 5.0 mg). 25.0 ml n—octanol has been added to this solution. The flask has been placed in a water bath at a cons-tant temperature of 40°C. Meanwhile the inner temperature has been kept at 37°C. The solution was constantly stirred with a mag-netic bar. The stirring and heating continued for 24 hours. Then the flask was removed frcm bath, cooled at room temperature. After the layers separated the solution was transfered into centrifuge tubes and centrifuged till perfect clearity.
1.0 ml has been taken from the octanol layer, transfered into a measured flask and completed to 20.0 ml with n—octanol. Suffici-ent amount of this solution has been taken into a UV chamber of 1 cm pathlength and absorbances were measured as before for the determination of standard lines.
Again 1.0 ml has been taken from aqueous layer, transfered into a measured flask and completed to 20.0 ml with distilled water. Sufficient amount has been taken into a UV chamber of 1 cm path-length and again absorbances have been read at appropriate wave-lengths.
For the construction of graphs and derivation of appropriate equations these values have been employed.
The values found have been carried on standard graphs, the bisecting points gaye quantities directly. But it was not possible to read beyond the second decimal whereas the results are magnified either 400 or 500 times respectively to reach the quantities in mother liquours. Therefore a mathematical means of calculation has been derived using the slopes of standard lines.
RESULTS
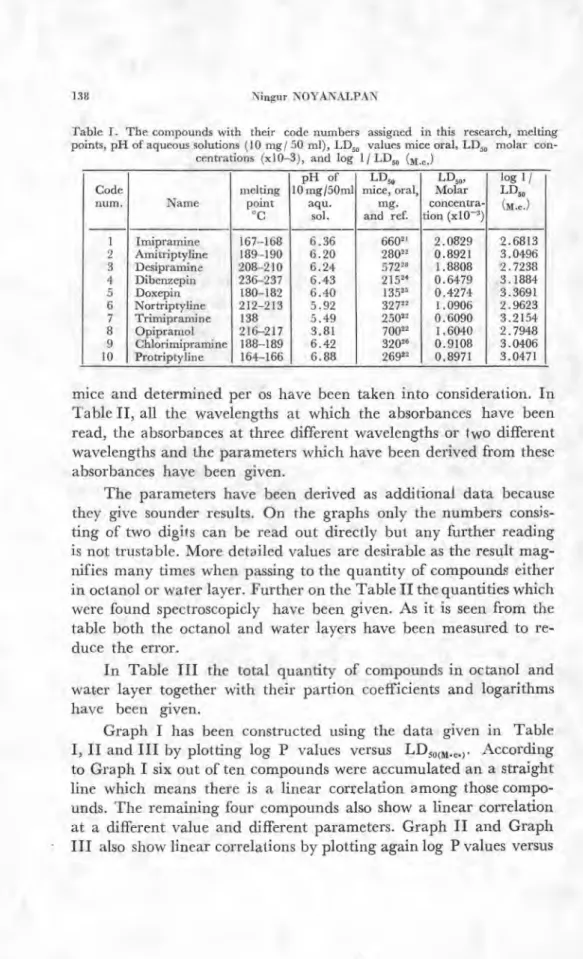
The compounds which have been used in this research have been exhibited in Table I, along with their melting points determi-ned during the study, their
LD50
values reported in the literature and their LD50 molar concentrations, LD„ (m•c . ) . A uniformity has been provided in choosing theLD,,,
values. Only these for theTable I. The compounds with their code numbers assigned in this research, melting points, pH of aqueous solutions (10 mg/ 50 ml), LD, values mice oral, LD„ molar con-
centrations (x10-3), and log 1/ LD„ ( M c. ) Code num. Name melting point °C pH of 10 mg /50m1 aqu. sol, LD„ mice, oral, mg. and ref. LD„, Molar concentra- don (x10 -3) log 1/ LD„ (m.c. ) I I --. em cn d. Le ) c.0 Y-- CO 01 C ş 1 Imipramine 167-168 6.36 66021 2.0829 2.6813 Amitriptyline 189-190 6.20 28022 0.8921 3.0496 Desipramine 208-210 6.24 572 28 1.8808 2.7238 Dibenzepin 236-237 6.43 215 24 0.6479 3.1884 Doxepin 180-182 6.40 13525 0.4274 3.3691 Nortriptyline 212-213 5.92 32722 1.0906 2.9623 Trimipramine 138 5.49 25022 0.6090 3.2154 Opipramol 216-217 3.81 70022 1.6040 2.7948 Chlorimipramine 188-189 6.42 3202' 0.9108 3.0406 Protriptyline 164-166 6.88 26922 0.8971 3.0471
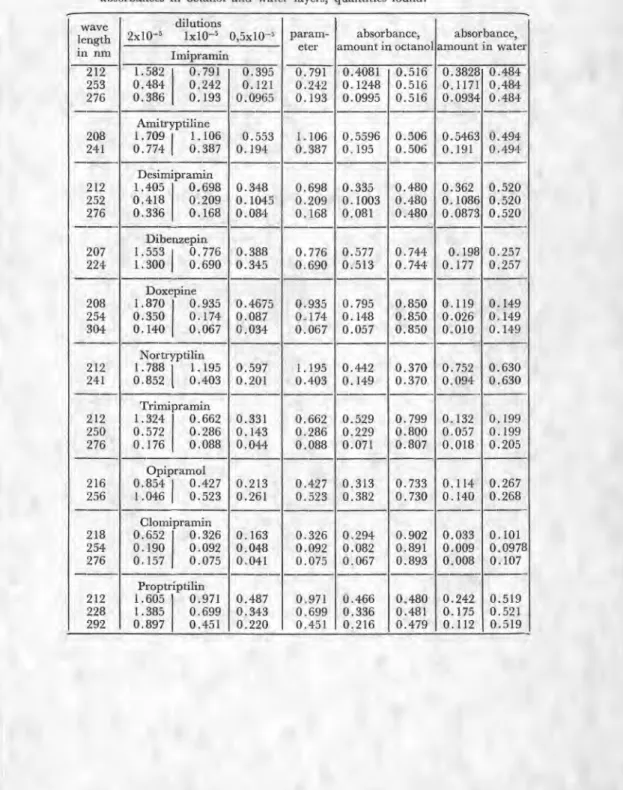
mice and determined per os have been taken into consideration. In Table II, all the wavelengths at which the absorbances have been read, the absorbances at three different wavelengths or two different wavelengths and the parameters which have been derived from these absorbances have been giyen.
The parameters have been derived as additional data because they give sounder results. On the graphs only the numbers consis-ting of two digits can be read out directly but any further reading is not trustable. More detailed values are desirable as the result mag-nifies many times when passing to the quantity of compounds either in octanol or water layer. Further on the Table II the quantities which were found spectroscopicly have been giyen. As it is seen from the table both the octanol and water layers have been measured to re-duce the error.
In
Table III the total quantity of compounds in octanol and water layer together with their partion coefficients and logarithms have been giyen.Graph I has been constructed using the data giyen in Table
I, II
and III by plotting logP
values versus I.,D, o(m. c.) • According to Graph I six out of ten compounds were accumulated an a straight line which means there is a linear correlation among those compo-unds. The remaining four compounds also show a linear correlation at a different value and different parameters. Graph II and Graph III also show linear correlations by plotting again logP values versus
Table II. Compounds with their wavelengths, dilutions, absorbances, parameters, and absorbances in octanol and water layers, quantities found.
wave ]ength in nm dilutions 2x10' 1x10⁻⁵ 0,5x10⁻⁵ param- eter absorbance, amount in octanol absorbance, amount in water Imipramin 212 1.582 0.791 0.395 0.791 0.4081 0.516 0.3828 0.484 253 0.484 0.242 1 0.121 0.242 0.1248 0.516 0.1171 0.484 276 0.386 0.193 0.0965 0.193 0.0995 0.516 0.0934 0.484 Anntryptiline 208 1.709I 1.106 0.553 1.106 0.5596 0.506 0.5463 0.494 241 0.774
I
0.387 0.194 0.387 0.195 0.506 0.191 0.494 Desim'pramin 212 1.405 0.698 0.348 0.698 0.335 0.480 0.362 0.520 252 0.418 0.209 0.1045 0.209 0.1003 0.480 0.1086 0.520 276 0.336 0.168 0.084 0.168 0.081 0.480 0.0873 0.520 Dibenzepin 207 1.553 0.776 0.388 0.776 0.577 0.744 0.198 0.257 224 1.300I
0.690 0.345 0.690 0.513 0.744 0.177 0.257 Doxepine 208 1.870 0.935 0.4675 0.935 0.795 0.850 0.119 0.149 254 0.350 0.174 0.087 0.174 0.148 0.850 0.026 0.149 304 0.140 0.067 0.034 0.067 0.057 0.850 0.010 0.149 Nortryptilin 212 1.7881
1.195 0.597 1.195 0.442 0.370 0.752 0.630 241 0.852 i 0.403 0.201 0.403 0.149 0.370 0.094 0.630 Trimipramin 212 1.324 0.662 0.331 0.662 0.529 0.799 0.132 0.199 250 0.572 0.286 0.143 0.286 0.229 0.800 0.057 0.199 276 0.176 0.088 0.044 0.088 0.071 0.807 0.018 0.205 Opipramol 216 0.854 0.427 0.213 0.427 0.313 0.733 0.114 0.267 256 1.046I
0.523 0.261 0.523 0.382 0.730 0.140 0.268 Clomipramin 218 0.652 0.326 0.163 0.326 0.294 0.902 0.033 0.101 254 0.190 0.092 0.048 0.092 0.082 0.891 0.009 0.0978 276 0.157 0.075 0.041 0.075 0.067 0.893 0.008 0.107 Proptriptilin 212 1.605 0.971 0.487 0.971 0.466 0.480 0.242 0.519 228 1.385 0.699 0.343 0.699 0.336 0.481 0.175 0.521 292 0.897 0.451 0.220 0.451 0.216 0.479 0.112 0.519Table. III.. Compounds with their quantities passing into water and octanol layers, partition coefficients and log P values.
Comp. code number quant. in oct. quant. in wa. Partition coefficient log p -. c. ..1 en ct ■ ı n CO 1" , C O cn C > ... . 2.58 2.42 1.0661 0.0278 2.53 2.47 1.0242 0.0104 2.40 2.60 0.9230 -0.0347 3.72 1.28 2.9062 0.4633 4.25 0.75 5.6666 O . 7533 1.85 3.15 0.5873 -0.2311 4.00 1.00 4.0000 0.6020 3.66 1.34 2.7313 0.4363 4.48 0.52 8.6153 0.9352 . 2.40 2.60 0.9230 -0.0347
log LD50(m. c . ) and log 1 / LD 5o(m. c.) respectively. Graph II and Graph III represent better correlation lines as being perfectly parallel.
After the graphs have been completed, mathematical means have been calculated. Linear correlation equations have been deri-ved for each of the two groups. The equations will be discussed later.
In thin layer chromatography studies a number of solvent sys-tems reported before have been tried and sorted out according to the results. Some of them gaye good results while the others did not. The solvent systems that gaye good results 'have been listed in Table IV together with the R f values. In, order to make a SAR study these solvent systems have been further investigated. No solvent sys-tem mentioned is good enough to give good R5.4 values and to si-mulate biological medium, although some correlations with R M
values have been attained with a less precision. Again these graphs show roughly the same pattern as Graph I.
DISCUSSION
In this research two parameters have been investigated for the SAR of tricyclic antidepressor compounds, the log P and RM.
Graph I which is constructed by using the log P values and plotting them versus L14 (Molar concentration) values shows good correlations and thus renders a relationship between biological effects and partitioning properties of the compounds. The correla-tions are linear. One can use these graphs directly for estimating
0,2 0.4 0.6 0.8 10
log P
Graph I. log P versus LD„( m.e .)
the biologicaly effective doses of a new compound. It is also possible to derive the correlation equations of these lines. After constructing the correlation. tables, Equation (I) and Equation (II) have been cal-culated for correlation lines I and II respectively. The equations have been giyen within 95 % confidence intervals.
0.2 0.4 Q6 0.8 1.0 log P
Graph II. log P versus log LD,„( m.e .) log L Dso (M.C.)
0.2 0.4 0.6 0.8 1.0
npound code number Scl sys. RE So sys. Rf So sys. Rf Sol. sys. Rf Sol. sys. RE Sol. sys. Rf SoL sys. Rf Sol. sys. RE SoL sys. RE 0.4815 0.5560 0.6404 0.5701 ;A ;A W4 W4 W ..1 ;A ;14 W .4 W4 W4 0.6448 F 0.4914 G 0.4672 II 0.7142 J 0.2745 0.1698 0.9649 0.8455 0.2280 0.6880 F 0.5746 G 0.6926 H 0.1904 J 0.5000 0.2430 0.3017 0.4228 0.2347 0.2056 F 0.2500 G 0.1570 H 0_1238 J 0.0980 0.2952 0.5238 0.5203 0.4561 0.5370 F 0.5863 G 0.5041 H 0.4190 J 0.4019 Le ) 0.4811 0.8070 0.7624 (:4 0.2368 0.6388 F 0.5259 G 0.8197 H 0.1714 J 0.5196 0.2430 0.4205 0.4797 0.2983 0.2752 F 0.3103 G 0.1721 H 0.1333 J 0.1176 0.7830 0.9260 0.4947 0.8421 0.8504 F 0.1983 G 0.8511 H 0.8761 J 0.6372 0.1852 0.2403 0.3333 0.2368 0.2523 F 0.6379 G 0.2582 H 0.2190 J 0.3431 0.2361 0.7009 0.7317 0.6754 0.7570 F 0.5603 G 0.6639 II 0.1333 J 0.4215 0.1404 0.2803 0.3984 0.1842 0.1401 F 0.2069 G 0.0909 H 0.1238 J 0.0784 Solvent systems A) Ethanol/ Carbontetrachloride (16:84)
B) Diethylether / Aceton / Ethylacetate / Diethylamin (85:11:2:2) C) Benzene / Aceton/ Diethylamin (50:10:5)
D) Benzene / Diethylether / Aceton/ Ammonia (35:35:351) E) Chloroform / Aceton / Ammonia (50:50 :1)
F) Aceton/ Methanol/ Ammonia (50:50:1) G) Aceton/ Ammonia (99:1)
H) Dioxan / Benzene Ammonia (7:12:1) J) Chloroform / Methanol/ (90:10)
Reference 6
LD„ (m ,,, = -0.599 (T 0.136) log P + 0.917 (T 0.061) (I) n r s 6 -0.987 0.132 LD„(M. e . ) = -1.11 0.86) log P + 2.00 (T 0.44) (II) n r s 4 -0.969 0.152 It is quite evident from Eq. (I) that the correlation among the first group is very good. The correlation coefficient is quite close to 1, s value is quite small and r 2 is also big enough. Also in the second group the correlation is good. As the correlation coefficients of both lines are negative these are negative correlations. The equations derived
from log 1 / LD„ (m. c.) versus log P tables are better as predicted. In thin layer chromatography studies a number of solvent sys-tems gaye good separations. But only a few of them gaye same R M
vs. LD 50(m . c. ) correlations comparable to that of log P vs. LD„• The correlations thus obtained are not as good as Graph I, but stili show almost same pattern. Here again there are two correla-tion lines.
After the construction of graphs mentioned before and deriva-tion of the equaderiva-tions (I) and (II) it is now possible to estimate roughly effective doses of a new compound belonging to same structural class and having same chemical properties. One can make such estimations simply by finding the partition coefficient and placing it on the graph or inserting it into the equations (I) and (II). As there are two correlation lines or two equations one should find two values of which one is expected to be very close to the actual value. Considering the cost of biological tests and efforts involved, this saves a lot of time and unneglectable waste of material. In fact for a number of compounds treated there are more than one LD„ values reported (21,23,25) although they are all determined in mice by oral teatment. At first this seemed somehow odd but after obtaining the results of this research one can make some assumptions which seem perceivable. In Graph I the only LD„ values which show a perfect correlation have been giyen but there are also other values reported which shift and come closer to the other line of correlation. This
seems possible only if there are more than one mechanism of action or more then one enzyme species with which these compounds in-teract.
Starting from this assumption now it becomes possible to ex-plain the confusion on chromatography plates which have been run with different solvent systems. As it has already been mentioned the compounds show different R f values with even slightly different solvent systems although necessary precautions have been taken to bring the starting material at pH 7.8 stili they look more or less like Graph I. lt is quit e evident from tic studies that particularly Com-pounds number 2, 6, 7 and in a few cases Compound 1 show shifts. In one solvent system some of them seem to be closer to correlation line I and in another solvent system they seem to be closer to correlation line II. This miqht be a reason why more than one LD„ have been reported before particularly for those compounds.
SUMMARY
In this research structure activity relationship of tricyclic anti-depressor compounds have been studied using log P and R M
After determining the partition coefficients and log P values they have been plotted versus LD„ values reported in literature and graphs have been constructed.
On the graph thus obtained there are two lines of correlation. Six compounds build one of the correlation lines and four build the ot-her. Also correlation equations have been derived after constructing the correlation tables. The equations have good r values and small s values.
A series of tic studies has shown that a similar correlation can also be produced on tic plates with a poorer precision. Also the equations derived thereof have smaller r values and larger s values. Looking at the results obtained with log P vs. LD„ plotting and several R1 vs. LD„ plotting one can bring some comments on the variances in reports about the ',D si, values of these com-pounds.
ÖZET
Bu araştırmada log P ve
RM
parametreleri kullanılarak trisiklik antidepresör bileşikler arasındaki yapı etki ilişkileri incelenmiştir. Bileşiklerin dağılma katsayıları saptandıktan sonra bunların loga-ritmaları literatürde verilmiş bulunan LD„ değerlerinin molar kon-santrasyonlarına karşı çizilerek grafik hazırlanmıştır. Bu sekilde elde edilen grafikte iki lineer korelasyon doğrusu görülmektedir. Bu doğrulardan birisi üzerinde bileşiklerden altısı yer almaktadır. Diğer dördü ise ikinci korelasyon doğrusunu oluşturmaktadır. Bu doğrular için kullanılan bilgilerden yararlanarak korelasyon tablo-ları oluşturulmuş ve korelasyon denklemleri hesaplanmıştır. Kore-lasyon denklemlerinin r değerleri l'e oldukça yakındır, s değerleri ise küçüktür. Ayrıca bir seri ince tabaka kromatografisi çalışması ile yukarıda adı edilen grafiğe benzer sonuçlara ulaşılmıştır. Bu gra-fiklerde de yine iki korelasyon doğrusu görülmektedir. Ancak bu doğ ru-lar log P x LD 50 grafiğinden elde edilen kadar sağlıklı değildir. Bunların denklemlerinin r değerleri daha küçüktür, s değerleri ise daha büyüktür. Bu çalışma ile hem pratik alanda yararlanabilecek bir sonuç elde edilmiştir, hem de ilaçların etki mekanizmalarına özge bir dav-ranışa dikkat çekilmiştir. Pratik alanda yararlanış, bu gruptan yeni sentez edilen bir bileşiğin biyolojik sistemde denenmesi gereken dozunu kabaca saptamak yönünden mümkündür. Yeni yapılan bir bileşik için kolay bir çalışma ile dağılma katsayısı saptandıktan sonra bu değeri grafikte ya da denklemde yerine koyarak biyolojik sistemde etkili olabilecek dozu hakkında kabaca bilgi edinmek mümkündür. Bu hem parasal yönden hem de yitirilen çaba ve zaman yönünden yararlar sağlamaktadır.Bunun yanı sıra literatürde bu gruptan bazı bileşikler için bir-den fazla LD„ değerinin verildiği görülmektedir. Her ne kadar bu değerlerin tümü farede ve oral yolla saptanmış ise de birbirlerin-den önemli ayrıcalıklar göstermektedir. Yapılan bu çalışmada adı geçen değerler ayrı ayrı yerine konulduğunda bir kısmının I Nolu doğru üzerinde yer almasına karşın diğerlerinin II Nolu doğru üze-rinde yer aldığı görülmüştür. Böyle bir durum için bileşiklerin or-ganizmada değişik iki etki mekanizması ile etkilerini göstermesi ya da organizmada değişik iki enzim ile etkileşmeleri söz konusu ola-bilir. Aynı özelik yapılan bir seri ince tabaka kromatografisi çalış-
maları ile de gösterilmiştir. Burada daha belirgin olarak özellikle bir-den fazla LD,,, değeri verilmiş bulunan bileşikler değişkenlik göster-mekte bazan I Nolu doğruya bazan da II Nolu doğruya yakın yer
almaktadırlar.
REFERENCES
1 - Davis, J. M., G. L. Klerman, J. J. Schildkraut., Drugs Used in the Treatment of De-pression. (Sec. on Psychosomatic Med., Nat. Ins. Mental Health, Bethesda, Md.) U.S.
Public Health Service, 1836, 719 (1967).
2 - Schmid, E., E. Hoppe., Chr. Meythaler und L. Zicha., Arzneim.-Forsch., 13,
969 (1963).
3 - Thomas, J. J. et L. Dryon., J. Pharm. Belgique, 22 163 (1967).
4 - Viala, A., F. Gouezo et C. Gola., J. Chromatog., 45, 94 (1969).
5 - Gawrych., Z., Farmacja Polska 1, 23 (1971).
6 - Röder, E., E. Mutschler, H. Rochelmeyer., 1. Chromatog., 42, 131 (1969).
7 - a Marca, J., H. Mühlemann., Pharm. Acta Hela., 46, 558 (1971).
8 - Noirfalise, A., 3'. Chromatog., 20, 61 (1965).
9 - Lagubeau, J., R. Crockett et P. Mesnard., Bull. Soc. Pharm. Bordeaux, 110, 10 (1971).
10 - Beyer, K. H., und D. Klinge., Arzneim. - Forsch., 19, 1759 (1969).
11 - Ahuja, S., C. Spitzer and F. R. Brofazi., Pharm. Sci., 57, 1979 (1968).
12 - Slunjski, M. et I. Turkovic., Pharm. Belgique., 25, 400 (1970).
13 - Dunn, W. J., S. Wold., j. Med. Chem., 21, 1001 (1978) and ref. therein cited.
14 - Hammett, L. P., Physical Organic Chemistry, ICS McGraw-Hill Book Company Inc. New York - London (1948).
15 - Yamamato, T. and T. Otsu., Chem. Ind., (London) 787 (1967). 16 - Hansch, C., J. Med. Chem., 11, 920 (1968).
17 - Swain, C. G. and E. C. Lupton., Amer. Chem. Soc., 90, 4328 (1968).
18 - Friedrich, H. J., Angew. Chem., 77, 721 (1965).
19 - Hansen, O. R., Acta. Chem. Scan., 16, 1593 (1962).
20 - Hansch, C., A. Vittoria, C. Silipo. and P. Y. C. Jow., J. Med.Chem.,18, 546 (1975). 21 - Eriksoo, E. and O . Rohte., Arzneim.-Forsch., 20, 1561 (1970).
22 - Clarke, E. G. C., Isolation and Identification of Drugs, The Pharmaceutical Press (1969). 23 - Jirkovsky, I., J. G., Humber, K. Voith and M. D. Charest., Arzneim.-Forsch. 27,
1642 (1977).
24 - Sunshine, I., Handbook of Analytical Toxicology, The Chemical Rubber Comp. (1969). 25 - Ribbentrop, A. und W. Schaumann., Arzneim.-Forsch., 15, 863 (1965).
I. Tezler:
1. Ecz. Maksut Coşkun
"Türkiye'de yetişen Dryopteris ve Asplenium türleri üzerinde Farmasötik Botanik
yönünden araştırmalar" Doktora Tezi (1978). 2. Dr. Pharm. Nurşin Gönül
"Sülfametoksazolün değişik kristal şekillerinin (polimorflarının) çözünme
kineti-ğinin incelenmesi" Doçentlik Tezi (1978). 3. Dr. Pharm. Seçkin Özden
"3 H-İmidazo (4,5-b) ve (4,5-c) piridinlerin 2-alkil türevlerinde nicel yönden yapı
etki bağdaştırılması üzerinde araştırmalar" Doçentlik Tezi (1978). 4. Dr. Sci. İnci Ödün
"Rutenyum elekrotla hidrokinonun anodik oksidasyonu ve kinonun katodik
re-düksiyonunun incelenmesi" Doçentlik Tezi (1978).
IL Ders Kitapları:
1. "Farmasötik Botanik II. baskı" Prof. Dr. Kâmil KARAMANOĞLU, A.U. Ecz. Fak. Yayınları No: 44, A.Ü. Basımevi, Ankara 1977.
2. "Farmasötik Kimya" Prof. Dr. Michel BERTUCAT ve Dr. Pharm Rahmiye ERTAN, A.Ü. Ecz. Fak. yayınları, No: 45, A. Ü. Basımevi Ankara 1975. 3. "Mesleki Latince I. baskı" Prof. Dr. Nevin TANKER ve Dr. Heinrich
Dr. Pharm. Bilge ŞENER, 28-29 Kasım 1977 tarihlerinde Istanbul'da yapılan "Sıvı
Kromatografisi" isimli seminere bir bildiri ile katılmıştır.
Dr. Pharm. Kandemir CANEFE, 24 Nisan 1978 tarihinde Ankara'da yapılan "Çağ -daş Eczacının Halk Sağlığındaki Rolü" isimli panele bir bildiri ile katılmıştır.
Dr. Pharm. Nedret KILIÇ, 12-14 Ekim 1977 tarihlerinde Ankara'da yapılan II. Ulusal Biyokimya Kongresine bir bildiri ile katılmıştır.
Iskenderiye Üniversitesi Profesörlerinden Prof. Dr. Youssef RİAD, 20 Mart 1978 tarihinde Fakültemizde, Organik Kimya ile ilgili bir konferans vermiştir.
17-21 Ekim 1977 tarihlerinde Ankara'da yapılan TÜBİTAK VI. Bilim Kongresine, Prof. Dr. Gazanfer BINGÖL, Ecz. Nilgün ALTAN, Ecz Zeliha KOÇER Prof. Dr. Enver İZGÜ, Dr. Pharm. Kandemir CANEFE
Prof. Dr. Enver İZGÜ, Dr. Pharm. Necati DIKMEN Prof. Dr. Enver İZGÜ, Dr. Pharm. Nilüfer TARIMCI Prof. Dr. Mekin TANKER, Dr. Pharm. Bilge ŞENER Prof. Dr. Nevin TANKER, Dr. Pharm. Gülden SEZİK birer bildiri ile katılmışlardır.
25-27 Mayıs 1978 tarihlerinde A. Ü. Eczacılık Fakültesi ve H.Ü. Eczacılık Fakültesi Farmakognozi Kürsülerince hazırlanan ve A. Ü. Eczacıhk Fakültesinde düzenlenen II. Bitkisel Ilâç Hammaddeleri Toplantısına,
Dr. Pharm. E. ATASÜ, Dr. Pharm. İ. KILIÇER (A.Ü.) Prof. Dr. A. BAYTOP (İ.Ü.)
Prof. Dr. T. BAYTOP, Doç. Dr. G. SARIYAR (İ.Ü.) Doç. Dr. A. CEYLAN (E.Ü.)
Doç. Dr. A. CEYLAN, Y. OZANSOY (E.Ü.) Prof. Dr. B. ÇUBUKÇU, Ecz. T. DORTUNÇ (I.Ü.) S. DOĞANCA
Prof. Dr. K. C. GÜVEN (İ.Ü.), Ecz. G. HAKYEMEZ (E.Ü.) Prof. Dr. M. H. IŞIKAN (A.Ü.)
Prof. Dr. K. İLİSULU (A.Ü.) Ecz. A. H. MERİÇLİ (I.Ü.) Doç. Dr. N. NOYANALPAN (A.Ü.)
Doç. Dr. G. SARIYAR (İ.Ü.) J. D. PHILLIPSON (Londra) Doç. Dr. E. SEZİK, Dr. Pharm. İ. ÇALIŞ (H.Ü.)
Prof. Dr. M. TANKER, Dr. Pharm. M. YENEN (A.Ü.)
Prof. Dr. M. TANKER, Prof. Dr. N. TANKER, Dr. Pharm. N. ÖZKAL (A.Ü.) Prof. Dr. M. TANKER, Dr. Pharm. F. TOSUN (A.Ü.)
Prof. Dr. N. TANKER, Dr. Pharm. M. COŞKUN (A.Ü.) Prof. Dr. A. ULUBELEN, N. ATEŞ (İ.Ü.) T. NISHIDA (Stokholm) Y. Kim. Müh. N. VAN (R.S.M. Hıfzıssıhha Ens. — Ankara) birer bildiri ile katılmışlardır.
ve 358 sayılı Kararı ile Fakülte Mecmuasında
yayınlanacak yazılar için tesbit edilen esaslar
1) Dergide, başka bir mecmuada aynı isimle ve aynı tarzda neşredilmemiş orijinal ça-lışmalar yayınlanır.
2) Yazılar Komisyona verildiği tarih sırasıyla yayınlanır.
3) Metin 15 daktilo sayfasını geçmemek üzere Türkçe veya yabancı dilde yazılabilir. Metin başlığı ve özeti Türkçe ve yabancı dilde yazılacaktır.
Yabancı dilde yazılmış başlık, metin ve özetlerin dil kurallarına uygun olmasının temi-ni, yazara aittir.
4) Yazılar, kağıdın bir yüzüne, daktilo ile ve normal aralıkla yazılmalı, italik yazılacak kelimelerin altı çizilmeli, klişesi yapılacak grafik, şema, formül gibi şekiller, çini mürekkep ile, aydinger kağıdına çizilmeli; fotoğraflar parlak kağıda ve kontraslı olarak çekilmelidir.
Şekillerin her biri ayrı kağıtlarda olmalı ve !dgidin üzerinde yazarın adı, kaçıncı şekil olduğu, resim altı yazılması istenen ibare kaydedilmelidir.
5) Yazı planı aşağıdaki şekilde olmalıdır: Konunun takdimi, bulgular, denel kısım, münakaşa, Türkçe özet, yabancı dilde özet, literatür.
Konunun takdimi 2 daktilo sahifesini geçmemeli; materyal, metot ve yapılan ameliye-ler "denel kısım" da yer almalı, "münakaşa" kısmı, gerekli ise konmalıdır.
Literatür, metinde parentez içindeki numaralarla belirtilmesi ve metin sonunda bu numaralara uygun olarak sıralanmalıdır. Sırasıyla yazarın soyadı, adının ilk harfi, mecmua-nın milletlerarası kullanılan kısaltılmış ismi, cilt numarası (italik), sayfa ve parentez içinde tarih yazılmalıdır.
6) Tashihler yazar tarafından yapılacaktır. 7) Yazara 50 ayrı baskı verilir.