M EASURING THE TECHNICAL EFFICIENCY OF INPATIENT CARE SERVICES IN TURKISH PUBLIC HOSPITALS USING STOCHASTIC
FRONTIER ANALYSIS
THE GRADUATE SCHOOL OF SOCIAL SCIENCES OF
TOBB UNIVERSITY OF ECONOMICS AND TECHNOLOGY
ALPER MORTAŞ
THE DEPARTMENT OF ECONOMICS
I certify that this thesis satisfies all the requirements as a thesis for the degree of
Master of Science
Prof. Serdar SAYAN
Director of the Graduate
School of Social Sciences
This is to certify that I have read this thesis and that it in my opinion is flilly adequate,
in scope and quality, as a thesis for the Degree of Master of Science in the field of
Economics of the Graduate School of Social Sciences.
Thesis Advisor
Asst. Prof. Güneş AŞIK
(TOBB ETU, Economics)
Thesis Committee Members
Prof. Nur Asena CANER
(TOBB ETU, Economics)
Assoc. Prof. Zafer ÇALIŞKAN
(Hacettepe University, Economics)
I hereby declare that all information in this document has been obtained and presented in accordance with academic rules and ethical conduct. I also declare that, as required by these rules and conduct, I have fully cited and referenced all material and results that are not original to this work.
ABSTRACT
MEASURING THE TECHNICAL EFFICIENCY OF INPATIENT CARE SERVICES IN TURKISH PUBLIC HOSPITALS USING STOCHASTIC FRONTIER ANALYSIS
MORTAŞ, Alper Master o f Science, Economics Supervisor: Asst. Prof. Güneş AŞIK
In this study, we measure the technical efficiency o f inpatient care services o f Turkish public hospitals using Stochastic Frontier Analysis (SFA). In the analysis, cross-sectional data on 495 general hospitals in 2016 are used. According to the parameters estimated with SFA, a hospital with high role group and in a region with a low development index has higher efficiency than those o f other hospitals. The contribution o f this thesis to the previous studies on hospital efficiency in Turkey is to use case-mix index reflecting the clinical level o f all cases in a hospital. We adjust output o f inpatient service with case mix index and remove the heterogeneity between cases in order to get better estimates by SFA. After using CMI, it has been observed that the inefficiency parameters o f role group of hospital and development index are approach to zero whereas parameter o f health index loose its significance.
Keywords: Stochastic Frontier Analysis, Technical Efficiency, Hospital Efficiency, Case-mix Index, Inpatient Care Services
ÖZ
STOKASTİK SINIR ANALİZİ İLE TÜRKİYE KAMU HASTANELERİNDE YATARAK TEDAVİ HİZMETLERİ TEKNİK ETKİNLİĞİNİN ÖLÇÜLMESİ
MORTAŞ, Alper Yüksek Lisans, İktisat
Tez Danışmanı: Dr. Öğr. Üyesi Güneş AŞIK
Bu tezde, Türk kamu hastanelerinin yatarak tedavi hizmetlerinin, Stokastik Sınır Analizini (SSA) kullanarak teknik etkinliği ölçülmektedir. Analizde, 2016 yılında 495 genel hastaneye ait kesitsel veriler kullanılmıştır. SFA ile hesaplanan parametrelere göre, yüksek rol grubuna sahip ve düşük bir gelişmişlik endeksine sahip bir bölgede bulunan bir hastanenin etkinliği diğer hastanelere göre daha yüksektir. Bu tezin Türkiye’de hastane etkinliği üzerine olan önceki çalışmalara katkısı, bir hastanedeki tüm vakaların klinik düzeyini yansıtan vaka-karma endeksinin kullanılmasıdır. SFA tarafından daha iyi tahminler elde etmek için yatarak tedavi hizmeti çıktısını vaka karma endeksi ile ayarlayarak vakalar arasındaki heterojenlik ortadan kaldırılmaktadır. Vaka-karma endeksi kullanıldıktan sonra hastane rol grubu ve gelişmişlik indeksi parametrelerin sıfıra yaklaştığı, sağlık indeksinin ise anlamlılığını kaybettiği gözlenmiştir.
Anahtar Kelimeler: Stokastik Sınır Analizi, Teknik Etkinlik, Hastane Etkinliği, Vaka- karma İndeksi, Yatarak Tedavi Hizmetleri
ACKNOWLEDGMENTS
I would like to thank my valuable adviser Asst. Prof. Güneş AŞIK for her patience and goodwill, who helped me through her contributions throughout my thesis work.
I would like to thank my dear family, who always accompanied me during my study period and who always supported me.
TABLE OF CONTENTS
PLAGIARISM PA G E ...iii
ABSTRACT... iv
O Z...v
ACKN O W LED GM EN TS... vi
TABLE OF CONTENTS... vii
LIST OF TA B LES... ix
LIST OF F IG U R E S ... x
ABBREVIATION L IS T ... xi
LIST OF M A P S ... xii
CHAPTER I INTRODUCTION... 1
CHAPTER II TURKISH HEALTH SYSTEM ...5
2.1. Health Transformation Program ... 5
2.2. Inpatient Services... 7
2.3. Human Resources... 9
2.4. The Role Groups o f General H ospitals... 11
CHAPTER III THEORETICAL BACKGROUND... 16
3.1. The Production Technology, Input and Output Sets o f Production... 17
3.2. Production F ro n tier... 19
3.3. Output Distance Function...21
3.4. Output-Oriented Technical Efficiency... 22
CHAPTER IV STOCHASTIC FRONTIER A N A LY SIS...24
4.1. Deterministic Production Frontier M o d el... 25
4.1. a. Corrected Ordinary Least Square (C O L S )... 26
4.1. b. Modified Ordinary Least Square...27
4.2. Stochastic Production Frontier M odel... 29
4.2. a. Technical Efficiency...31
4.2. b.ii. The Normal - Truncated Normal M odel...36
4.2. b.iii. The Normal - Exponential M odel...37
4.2. b.iv. Determination o f the Distribution o f Inefficiency T erm ... 38
4.3. Translog Functional F o rm ...40
4.4. Testing H ypotheses... 41
CHAPTER V M EASURING OF TECHNICAL EFFICIEN CY ... 43
5.1. Literature R eview ...43
5.2. The Data and V ariables... 46
5.2. a. The Unit o f A nalysis...47
5.2. b. The Output and Input V ariab les...47
5.2. c. Control V ariables... 50
5.2. d. Inefficiency V ariables...51
5.2. d.i. Hospital specific factors... 51
5.2. d.ii. Environmental facto rs...53
5.2. e. Descriptive S tatistics...55
5.3. Analysis Results and D iscussions...56
5.3. a. Hypothesis T estin g ... 56
5.3. b. Parameter Estim ating... 57
5.3. c. Technical Efficiency...61
CHAPTER VI CONCLUSION...67
BIBLIOGHRAPHY... 70
APPENDIX-A Nomenclature o f Territorial Units for Statistics (N U T S )...744
APPENDIX-B Frequency Plots o f Efficiency S co res... 745
LIST OF TABLES
Table 2. 1. Number o f Inpatients by Years and Sectors... 9
Table 5. 1. The Relationship Between Hospital Roles and Case-Mix In d ex ... 52
Table 5. 2. The Relationship Between Hospital Roles and Hospital Beds...53
Table 5. 3. Descriptive Statistics... 55
Table 5. 4. Hypothesis testing sum m ary... 56
Table 5. 5. Parameter E stim ation... 58
Table 5. 6. Output Elasticity o f Input Variables and Returns to Scale... 60
Table 5. 7. Inefficiency Coefficients Estim ation... 60
LIST OF FIGURES
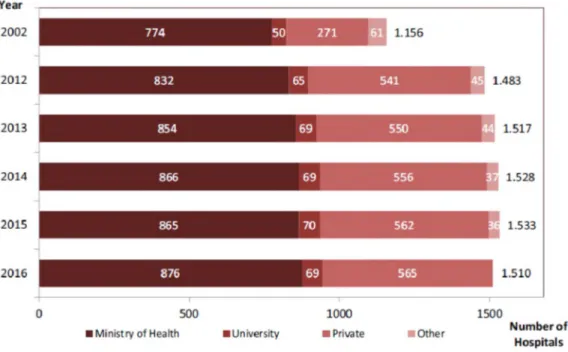
Figure 2. 1. Number o f Hospitals by Years and Sectors... 8
Figure 2. 2. Number o f Hospital Beds by Years and Sectors...8
Figure 2. 3. Number o f Total Physicians per 100.000 Population by NUTS-1, MoH, 2002, 2016...10
Figure 2. 4. Number o f Nurses and Midwives per 100.000 Population by NUTS-1, MoH, 2002, 2 0 1 6 ...11
Figure 3. 1. Production Technology, Input and Output Sets o f Production...17
Figure 3. 2. Production Frontier... 20
Figure 3. 3. Measure o f Technical Efficiency...21
Figure 3. 4. Output-oriented measure o f technical efficiency... 22
Figure 4. 1. OLS-based production frontiers...28
Figure 4. 2. Stochastic Frontier M odel...30
Figure 4. 3. Inefficiency Term D istribution...39
Figure 5. 1. Frequency Plot o f Efficiency Scores o f CMIxDISCHARGE according to Development In d ex ... 65
ABBREVIATION LIST
CMI : Case-mix Index
DEA : Data Envelopment Analysis DMU : Decision M aker Unit DRG : Diagnosis Related Groups HTP : Health Transformation Program LR : Likelihood Ratio
MoH : Ministry o f Health
ML : Maximum Likelihood
NUTS : Nomenclature o f Territorial Units for Statistics
OECD : Organization for Economic Co-operation and Development OLS : Ordinary Least Squares
RTS : Returns to Scale
SFA : Stochastic Frontier Analysis
LIST OF MAPS
CHAPTER I
INTRODUCTION
Nowadays, performance measurement o f health systems is becoming a fundamental issue for developing countries. W ith economic developments in these countries, expenditures on health services are increasing, and policy makers desire to plan their investments responsively and in accordance with the citizens’ preferences. Thus, health expenditures are aimed to be financially sustainable with public resources (Jacobs et al. 2006). Health care services efficiency and productivity measurement is o f great importance for researchers and policy makers, as the health system and the public will benefit from the increased efficiency o f health services that will be provided in this way.
In Turkey, after the Health Transformation Program (HTP) (2003) was put in place, a significant increase in health spending was observed. Especially, increase in health spending in the public sector is thought to be one o f the determinants o f public expenditure increase. When considering the scarcity o f resources in addition to this increase, it is necessary to discuss the problem o f effective resource allocation and the use o f service production units in the health care system (Atılgan, 2012).
A number o f reference points and evaluation criteria have been developed for the use o f resources in hospitals in the approach developed for institutional performance evaluation in hospitals affiliated to Ministry o f Health (MoH) (Turkish Public Hospitals Institution, 2012). Administrative performance criteria including evaluation o f medical, administrative, financial, quality, patient and employee satisfaction o f health facilities,
was created for performance evaluations o f contracted managers by adapting the Balanced Score Card approach developed by Norton & Kaplan (1992). Regarding the Balanced Scorecard criteria for inpatient care services, there is an efficiency score calculated by the stochastic frontier analysis where the output is the day spent in the inpatient service, the inputs are the bed and the staff, and appropriate control and inefficiency variables are used (Turkish Public Hospitals Institution, no date). In addition to inpatient services elements o f MoH Balanced Scorecard, case mix index is used as a component o f efficiency model in this study. Case-mix index, which is a coefficient that allows us to compare the case production o f a hospital with another hospital through diagnosis related groups, has an important place in the literature o f efficiency analysis. For that reason, we use case mix index in order to remove the heterogeneity between cases and get better estimates by Stochastic Frontier Analysis (SFA) in this thesis.
As a measurement method o f technical efficiency, SFA presents a parametric structure and tests the decision maker units against a determined frontier for efficiency measurement. It requires the use o f a theoretically defined production frontier function form. The greatest advantage o f SFA over other methods is that it allows the model to be affected by random errors. The method divides the deviations from the frontiers o f the defined production technology into two parts, measured by error terms. The first part is the randomness (or statistical error) and the second part is the ineffectiveness.
In this study, we measure the technical efficiency o f inpatient care services o f Turkish public hospitals using Stochastic Frontier Analysis (SFA). In the analysis, cross-sectional data on 495 general hospitals in 2016 were used. In addition to o f input-output relations, we evaluate the impact o f hospital-specific and environmental factors on efficiency scores
by using SFA. The contribution o f this thesis to the previous studies on Turkish hospitals is to use case-mix index reflecting the clinical complexity o f all cases in a hospital. The main objective is to monitor the change in parameters and efficiency scores after adjusting the case-mix index with the comparison o f models.
In the second chapter, the Turkish health system is considered. Firstly, the principles and aims o f Health Transformation Program are considered. Then, the developments provided in inpatient services and in regional distribution o f human resource with this transformation framework are explained. It is further explained how the general hospitals, which are not branch hospitals, are grouped by M oH according to the resources used and the services they have.
In the third chapter, the foundation o f "efficiency" is described by production technology, input and output sets, production frontier function, output distance function and output oriented technical efficiency concepts.
In the fourth chapter, firstly the need for SFA has been demonstrated by showing the missing aspects o f the deterministic frontier models. Then, the methodology o f calculating technical efficiency and estimating the parameters, and its translog functional form are presented. At the end, the hypothesis tests are described in order to choose the most appropriate model for measuring the efficiency.
In the fifth chapter, we search the literature and choose the unit o f analysis and variables according to the information available in the literature review and available data. Then, we obtain the parameters after deciding empirical model according to hypothesis tests. In
the last section, we classify the technical efficiencies among role groups, bed capacities and regions o f hospitals, then interpret in accordance with the parameters obtained.
In the conclusion that is the last part o f the study, we interpret the results obtained and make suggestions for future studies.
CHAPTER II
TURKISH HEALTH SYSTEM
2.1. Health Transformation Program
Since the year o f 2003, the structure o f Turkish health system has been changed evidently with the Health Transformation Program (HTP) aiming to organize, finance and provide health services effectively, efficiently and fairly (Ministry o f Health o f Turkey 2003). Effectiveness refers to the aim o f the policies to be implemented to raise the level o f public health. Efficiency is to reduce costs by using resources appropriately and to produce more services with the same source. Equity is to ensure that people reach health care services to the extent they need and that they contribute to the financing o f services in proportion to their financial strength (Ministery o f Health o f Turkey 2012).
The basic principles o f the Health Transformation Program are listed below (Ministry o f Health o f Turkey 2003):
Human centricity: This principle refers to taking into consideration the needs, demands and expectations o f the individual, the individual, who will benefit from the service in the planning o f the system and in the presentation o f the service.
Sustainability: It means that the system to be developed is in harmony with the country's conditions and resources, and it is a principle that it sustains itself by nurturing itself.
Continuous quality improvement: This principle focuses on creating a feedback system that will provide lessons from outcomes and mistakes.
Participation: Taking all the views and suggestions o f all interested parties during the development and implementation o f the system means creating platforms to provide a constructive discussion environment.
Reconciliation: As a requirement o f a democratic administration, it refers to the search for meeting in common points, taking into account the mutual interests between the different sections o f the sector.
Volunteerism: It means that the people who produce and serve the service in the system do not voluntarily take part in the direction o f the incentive measures rather than the forced ones.
Separation o f powers: The principle o f financing healthcare services, planning, supervising, and generating services.
Decentralization: Institutions should get rid o f the cumbersome structure formed by the central government. It is aimed to pass the misconception o f management principle in accordance with changing and developing conditions and contemporary understanding. Autonomous entities from the administrative and financial side will have a quick decision mechanism and will use the resources more efficiently.
Competition in service: Health service provision is the principle o f eliminating monopoly and competing with service providers in accordance with certain standards.
Within the framework o f these principles HTP consists o f 8 components, which have been formed to cover the h ealth sector with all its dimensions (Ministry o f Health of Turkey 2003 :
• The Ministry o f Health as the Planner and Controller
• General Health Insurance Gathering Everybody under a Single Umbrella • Widespread, Easily Accessible and Friendly Health Service System
• Health Manpower Equipped with Knowledge and Competence and Working with High Motivation
• Education and Science Institutions Supporting the System
• Quality and Accreditation for Qualified and Effective Health Services
• Institutional Structure in the M anagement o f Rational Medicine and Equipment • Access to Effective Information at Decision Making Process
2.2. Inpatient Services
Provision o f health services in Turkey mostly publicly funded. Preventive, curative, rehabilitative and developmental health services are actors o f the health system. The main service providers include the MoH, university hospitals and the private sector. MoH operating hospitals, clinics, family health centers, community health centers, dispensaries. Public hospitals were technologically renewed and capacities increased by HTP. University hospitals are able to provide all the health services in practice and the private sector contributes to the production o f health services through hospitals, clinics and outpatient clinics, examination rooms, pharmacies, laboratories, medical devices and
Figure 2. 1. Number of Hospitals by Years and Sectors
Between 2012 and 2016, there is a significant increase in hospitals by 30%. Although MoH hospitals have the largest share in the total number o f hospitals, private hospitals have paved the way for the expansion o f health infrastructure (Keskin 2017, 25).
Between 2012 and 2016 there is a 32% increase in hospital beds. In particular, the increase in intensive care and qualified beds has led to an improvement in the quality of inpatient services as well as a quantitative increase in services provided in hospitals.
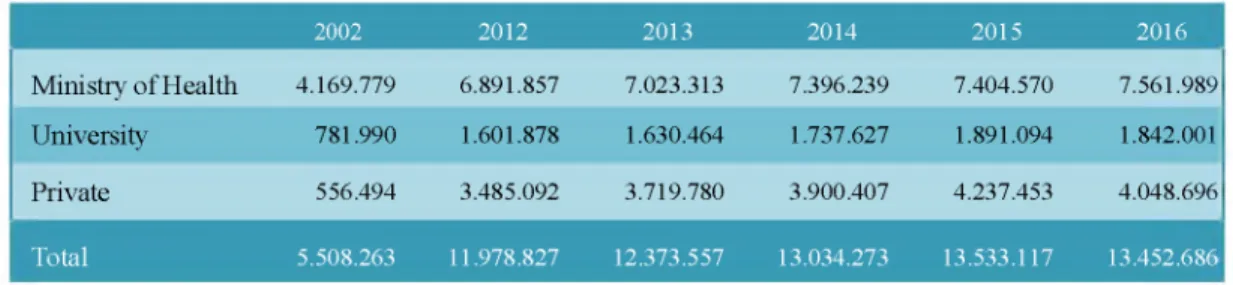
2002 2012 2013 2014 2015 2016 M in is try o f H e a lth 4.169.779 6.891.857 7.023.313 7.396.239 7.404.570 7.561.989 U n iv e rsity 781.990 1.601.878 1.630.464 1.737.627 1.891.094 1.842.001 P riv a te 556.494 3.485.092 3.719.780 3.900.407 4.237.453 4.048.696 T o tal 5.508.263 11.978.827 12.373.557 13.034.273 13.533.117 13.452.686
Table 2. 1. Number of Inpatients by Years and Sectors
The expansion in health care delivery contributed to improved health care utilization and physician productivity (Ministry o f Health o f Turkey 2012). Between 2012 and 2016, there is an increase o f two quarts in the total number o f inpatients. The highest increase was in the private sector with an increase o f about seven times.
2.3. Human Resources
Before HTP, access to health services in rural areas was more difficult and expensive. As a result o f resource constraints o f large public health organizations, poor training of staff, low wages, low level of professional incentives, and lack of skilled personnel in rural areas and geographical misallocation o f personnel, there is a huge difference in efficiency in health services among regions. Also, there was a geographically serious imbalance in the distribution o f staff (OECD and World Bank 2008). For example, MoH statistics (2000) indicated that 12 % o f health centers did not have physicians and two- thirds of rural health posts did not have midwives.
Within the framework o f "Basic Law on Health Services, Law on Compensation and W orking Principles o f Health Personnel" (2005), a balanced distribution o f health personnel throughout the country has been started with the regulation o f State Service Liability. Thus, a new, more acceptable and sustainable regulation was introduced that provided different durations and higher wages in deprivation areas. Assignment and transfer o f personnel began according to the 'service point', which varies according to the nature o f the place where they work and the length o f time they have worked (Ministry of Health o f Turkey 2012).
In the graphs, Regional Distribution o f Human Resources according to Nomenclature o f Territorial Units for Statistics (NUTS) is shown for regional comparisons. The NUTS with level 1 presented in Appendix-A was formed by the grouping o f neighboring countries, which are similar in economic, social and geographical direction, by Turkish Statistics Institution.
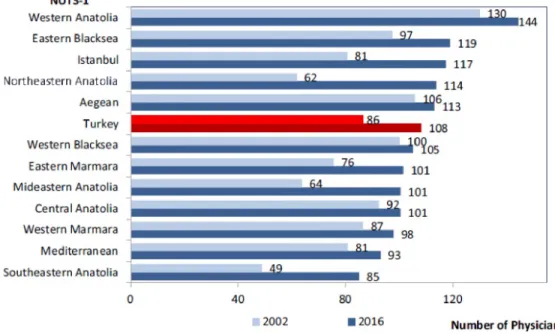
Figure 2. 3. Number of Total Physicians per 100.000 Population by NUTS-1, MoH, 2002, 2016
Between 2012 and 2016, significant improvements have been made in physician distribution in addition to increase in the number o f physicians per capita. In particular, the need for physicians has been met in Anatolian regions where the number o f doctors are low.
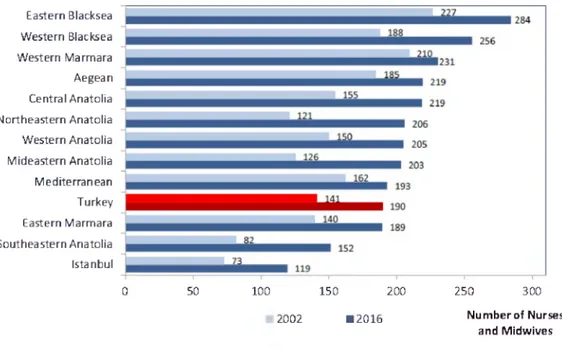
Figure 2.4. Number of Nurses and Midwives per 100.000 Population by NUTS-1, MoH, 2002, 2016
NUTS-l Eastern Blacksea Western Blacksea Western Marmara Aegean Central Anatolia Northeastern Anatolia Western Anatolia Mideastern Anatolia Mediterranean Turkey Eastern Marmara Southeastern Anatolia Istanbul 0 50 100 150 200 250 300 2002 12016 Number of Nurses and Midwives
When we look at the total number o f physicians, nurses and midwives per capita, it is observed that the increase in the number o f nurses and midwives in particular is more than the increase in the number o f physicians.
2.4. The Role Groups of General Hospitals
Hospitals are planned according to building, physical conditions, equipment and medical technological needs, health human power criteria (Circular Letter o f Health Region Planning Practices 2010):
Group A1
A-I Group hospitals are called treatment institutions in which at least five branches have been given education authority and education staff have been completed, tertiary care and rehabilitation services are provided, educational research activities are carried out and at the same time specialist and subsidiary specialist subjects have been trained. The following criteria are searched:
1- Education authority is granted according to the related legislation o f the Ministry,
2- Completion o f the education cadres in the branches o f expertise given by the Ministry,
3- Establishment o f Training Planning and Coordination Council in its context,
4- The advanced examination and treatment services required by the status o f the hospital and the availability o f imaging services within the institution or through service procurement,
5- With a minimum o f four branches, it is possible to have a specialist doctor and to arrange an independent emergency branch in the branches o f internal medicine, general surgery, women's health, child health and diseases (these branches are exempted if there is a branch hospital in women's-birth and child branches), neurosurgery, orthopedics and traumatology, cardiology, anesthesiology and reanimation,
Group A2
Definition: General hospitals operating The district operates in the provinces in the region health center status or in the provinces connected to these centers and without education-research status and meeting the following criteria are called A-II Group Hospitals. Criteria:
1- In the provinces with the center o f the health zone or with the sub-region center connected to these provinces; second stage, in-patient health facility status,
2- In the presence o f at least four branches, including internal medicine, general surgery, gynecological diseases and childhood, pediatric diseases, have six or more specialist doctors and to arrange an independent emergency branch,
3- To provide follow-up and treatment o f patients with severe and high risk admission, acceptance and treatment o f complicated patients,
4- In the presence o f 3rd Level Emergency Service, 5- In the presence o f 3rd Level step-intensive care unit,
6- The inspection and treatment services required by the status o f the hospital and imaging services can be met within the institution or through external service.
Group B
Definition: General hospitals operating outside the A-I and A-II Group hospitals, operating in provincial centers and reinforced districts and meeting the following criteria are called B-Group hospitals. Criteria:
1. To operate in the province center or in the districts which are in the position of strengthened district center.
2. Internal branch emergency pool watch and surgical branch emergency pool watch can be held based on 24-hour basis.
3. There should be at least 2nd level Emergency Service and 2nd stage Intensive Care Unit.
Group C
Definition: Group C hospitals are general hospitals grouped according to the following criteria. Criteria:
1- To operate in the strengthened districts or in the districts connected with the district centers strengthened in the health district planning in terms o f health service provision.
2- In the presence o f service o f a specialist doctor in four main branches and additionally at least two specialist doctors from other branches.
3- In the presence o f at least the first stage intensive care unit and the first level emergency services are available.
Group D
Definition: General hospitals with at least 25 patient beds that are enforced in accordance with the following criteria and are active in the districts connected to the districts strengthened by health zone planning. Criteria:
1- In four main branches; the planning o f at least 1 specialist medicine for each branch and the presence o f more than one specialist physician including the family physician,
2- Providing specialist policlinic examination services in existing specialist branches and providing follow-up and treatment at the expert level o f the hospitalized patients,
3- Emergency health services can be presented in the first level emergency service structure,
4- In the presence o f operating room, post-operative care room, dental policlinic, delivery room, observation room with monitors,
5- The dialysis unit can be configured according to need.
Group E
Definition: General hospitals are the integrated district hospitals whose beds are under 25 beds. It is the health facilities that are presented in the same structure in the health services provided in the first step together with diagnosis and treatment services.
CHAPTER III
THEORETICAL BACKGROUND
Although the concepts o f productivity and efficiency do not mean the same thing, unfortunately they are used interchangeably in the literature. Productivity is the measure o f the effective use o f resources and refers to the proportion o f the amount o f output and the corresponding inputs used to produce that output. The efficiency is the comparison of the most appropriate output quantity with the observed output quantity or the comparison o f the observed input quantity with the most suitable input quantity in the production made in a specific quality.
The notion o f “Technical efficiency” is first defined by Koopmans (1951):
A producer is technical efficient if, and only if, it is impossible to produce more o f any output without producing less o f other output or using more o f some input.
The starting point o f stochastic frontier modeling and efficiency measurement is the approach put forward by Farrell (1957). He proposes two elements to measure the efficiency o f a decision maker unit (DMU). The first one is technical efficiency, the second is allocation efficiency. Technical efficiency is a measure that determines the maximum output level that a DMU can obtain from the current set o f inputs in its hands. Allocation efficiency shows the ability o f the DM U to use these inputs at appropriate rates while the prices o f the inputs are available.
In this thesis, we aim to apply a study based on measurement o f technical efficiency. Before discussing the measurement method o f technical efficiency, it is needed to present
some background information about production technology and production function. In this chapter, analytic foundations o f production theory for the measurement method of technical efficiency with stochastic frontier analysis will be discussed.
3.1. The Production Technology, Input and Output Sets of Production
It is assumed that producers use a non-negative vector o f inputs
x = (xv
... ,x
N), to produce a nonnegative vector o f outputs y = (y x, ...,Vm).
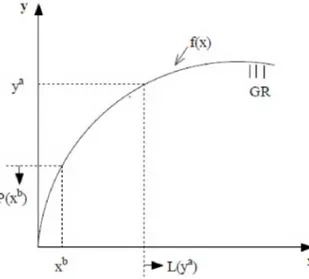
In the figure 3.1, the production technology in a single input-output case is represented. The graph of production technology,GR
is the set o f input-output combinationsand bounded above by the curve emanating from the origin.
L( yA)
P(xB)
is the set o f outputs.Figure 3. 1. Production Technology, Input and Output Sets of Production
GR = {(y,x)
:x can produce y}
denotes the set o f feasible input-output vectors.GR
is assumed to satisfy the following properties (Kumbhakar & Lovell 2000, 18; Coelli et bounded below x-axis is the set o f inputs andG1 : (0, x)
G GR
and (y, 0)G GR ^
y = 0G2:
GR
is a closed set.G3:
GR
is bounded for each xG R+.
G4:
(y,
x)G GR ^ (y, Âx) G GR
for X > 1.G5:
(y,
x)G GR ^ (Ây,
x)G GR
for 0 > X > 1.Property G1 indicates that any nonnegative input can produce at least zero output. G2 is the guarantee o f existence o f efficiency, since input and upper vectors lies on the upper boundary o f
GR.
G3 assures that finite input cannot produce infinite output. G4 and G5 are weak monotonicity properties that guarantee the input expansion and output contraction.L(y) = {x ■
(y,x) G GR
} describes the sets o f feasible input vectors for each output vectory G R+.
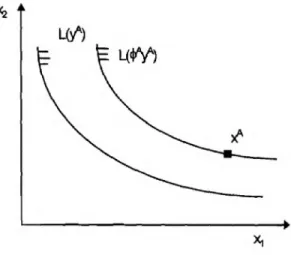
In Figure 3.1,L(yA)
is the set o f inputs on the interval[xA, +m). L(y)
is assumed to satisfy the following properties (Kumbhakar & Lovell 2000, 21; Coelli et al. 2005, 43):L1: 0
£ L(y)
for y> 0 andL(0) = R+.
L2: The sets
L(y)
are closed.L3: x is finite ^ x
£ L(y)
ify
is infinite.L4: x
G L(y) ^ Âx G L(y)
for X > 1.L5:
L(Ay)
£L(y)
for X > 1.Property L1 indicates that any input cannot produce zero output. Property L2 guarantees the existence o f technical efficiency input given a level o f output. Property L3
states that finite input cannot produce an infinite output. L4 and L5 are related to the output contraction and input expansion.
P(x) = {y : (y,x) e GR
} describes the sets o f output vectors that are feasible for each output vectors that are feasible for each output vectory e R+.
In Figure 3.1,P(xB)
is the set o f outputs on the interval[0,yB). P(x)
is assumed to satisfy the following properties (Kumbhakar & Lovell 2000, 22; Coelli et al. 2005, 42):P1:
P(0) =
{0}P2:
P(x)
is a closed.P3:
P(x)
is bounded for xe R+.
P4:
P(Ax) 2 P(x)
forA
> 1.P5:
y e P(x) ^ Ay e P(x)
for Ae
[0, 1].Property P1 indicates that zero input produce zero output. Property P2 guarantees the existence o f technical efficiency given a level o f input. Property P3 states that finite input cannot produce an infinite output. P4 and P5 are related to the output contraction and input expansion.
3.2. Production Frontier
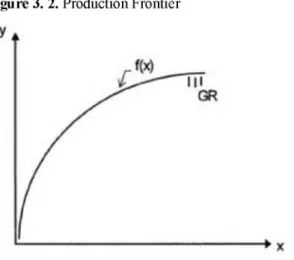
The production frontier function expresses the maximum output that can be generated by the given input vector. A production frontier is a function:
Figure 3. 2. Production Frontier
In figure 3.2, the production frontier function f (x) is located at the upper limit of production possibilities. Other input-output combinations are under this curve. / ( x ) is assumed to satisfy the following properties (Kumbhakar & Lovell 2000, 26; Coelli et al. 2005, 12):
f1: / ( 0 ) = 0
f2: / is upper semi continuous on Æ+.
f3: / ( 0 ) > 0 ^ /(A x) ^ + œ a s A ^ + œ
f4: /(A x) > /(A x), A > 1 for l E f i f
The production frontier / ( x ) defines the maximum feasible output produced with any given input. It gives the upper boundary o f production possibilities, thus each producer can be located on production frontier with an input-output combination (Kumbhakar & Lovell 2000, 27).
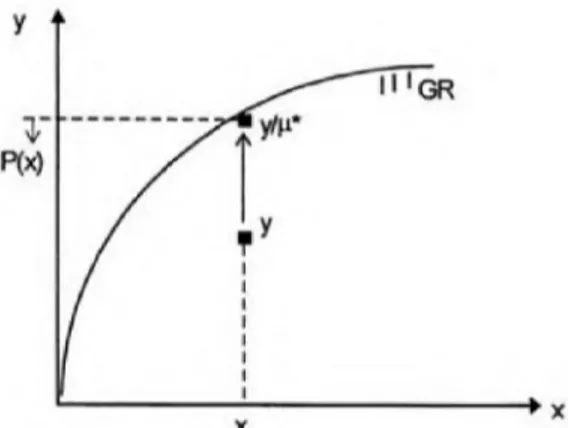
3.3. Output Distance Function
An output distance function:
D (x ,y ) = m m { u :y /u G P (x )} (3.2)
is first introduced by Shephard (1953). An output distance function gives the minimum amount o f the parameter
ft
which deflates the output with a given input vector. It depicts a distance from a producer to the frontier production.Figure 3. 3. Measure of Technical Efficiency
In Figure 3.3, with input x, output y can be produced, but larger output (y /u * ) can also be reached, so
3.4. Output-Oriented Technical Efficiency
An output-oriented measure of technical efficiency:
T E (x ,y ) = [m ax{0: 0 y e P (x )} ]-1 (3.4)
is first proposed by Debreu (1951) and Farrell (1957). An output-oriented measure of technical efficiency gives the inverse o f the maximum amount o f the parameter 0 which cuts down the output vector with a given input vector. It refers to the ability to obtain maximum output from a given input vector.
Figure 3. 4. Output-Oriented Measure of Technical Efficiency
Since the distance function provides radial measures o f the distance from an input bundle to the frontier production, it coincides with the distance function P (x , y).
T E (x ,y ) = [ ß (x ,y )] 1 (3.5)
By using equation 3.3 and equation 3.5, we derive technical efficiency equation
P £ = ! = ^ = ^
that is the ratio o f the observed level o f output
(y
) to the maximum feasible level o f output ( y/M*). < 1 means that the producer is inefficient and = 1 means that the producer is efficient.CHAPTER IV
STOCHASTIC FRONTIER ANALYSIS
The stochastic frontier analysis was introduced for the first time by Aigner, Lovell, Schmidt (1977) and Meusen, Van den Broeck (1977). The stochastic frontier analysis is based on the idea that the deviations from the production frontier do not arise entirely from the production unit. The SFA assumes that there is a parametric function between production inputs and outputs. The greatest advantage o f SFA over the deterministic approach where all deviations from the frontier are expressed as inefficiency is to take into account random situations that may develop outside of the manufacturer's control and affect output. The method divides the deviations from the frontiers o f the defined production technology into two parts, measured by error terms. The first part is the randomness (or statistical error) and the second part is the ineffectiveness.
In this chapter, technical efficiency is evaluated in the context of production frontier models using cross-sectional data. Firstly, deterministic production model and its analysis methods are introduced, so the need of stochastic frontier model comes forward. In the second section, the calculations o f SFA’s individual efficiency estimation are introduced under the different assumptions o f inefficiency term. Then, the translog form and the properties its specific parameters are explained. Finally, the hypothesis test method for SFA appropriateness, translog form, truncated normal distribution, and inefficiency variables are introduced.
4.1. Deterministic Production Frontier Model
A deterministic production frontier model can be written as:
yi = /(X j,^ ).T F j (4.1)
where y £ is the scalar output o f producer (hospital) i, i = 1 ,...., /, x £ is a vector o f N inputs used by producer i, / ( x £, ^ ) is the production frontier and ^ is the vector o f parameters to be estimated. Now, we write output oriented technical efficiency in terms o f production function:
y t
(4.2)
which is the shortfall o f observed output y £ from maximum feasible output / ( x £,^ ) . y £ takes the maximum value o f / ( x £, ^ ) if , and only if, = 1. Otherwise T F j < 1 measures the shortfall which is less than 1.
Since we require that TFj < 1, define that TF£ = e x p (u £) where u £ >0. So, we rewrite the equation 4.1 as:
yi = / (x £, # ) . e x p ( - u £) (4.3)
In order to estimate the parameter vector ^ and ( —u £) in equation 4.3, Aigner & Chu (1968) proposed that / ( x £, ^ ) takes log-linear Cobb-Douglas form. Then, the deterministic model is written as:
ln (y £) = £o + Zy=i f t ^ * /i - «i (4.4)
luck or unexpected disturbances in a related market cannot play role in determining maximum feasible output o f deterministic models. This is in contrast to the specification of the frontier in which the maximum output that a producer can obtain is assumed to be determined both by the production function and by random external factors.
In order to get the technical efficiency, the estimates o f the parameters ^ and the error term u £ are needed. To obtain the estimation o f the parameters, the methods based on Ordinary Least Squares (OLS) were developed. OLS makes the parameters estimated consistently since it is robust to non-normality (Greene 2008) .The OLS methods are corrected ordinary least squares (COLS) introduced by W insten (1957) and modified ordinary least squares (MOLS) introduced by Afriat (1972) and Richmond (1974).
4.1.a. Corrected Ordinary Least Square (COLS)
Winstein (1957) suggested a two stage method to estimate parameters o f deterministic production frontier model. First stage is to obtain estimates o f the slope coefficients and the intercept parameter o f the model. Then, the OLS intercept is shifted up to the extent that frontier bounds all the observations below.
An OLS regression o f ln y £ on Znxy£ is employed:
lnyj = & + Zy=i £y fox,-! - êj (4.5)
where e£ are the OLS residuals. Since £ ( e £) ^ 0, the /?0 is a biased estimate o f ^ 0. However, ^y is a consistent estimate o f ^y. W e write OLS regression residual as:
The OLS intercept is adjusted up (“corrected”) by the m ax { ej,so that frontier bounds all the observations below;
ej - m a x je j = ln y f - {[& + m a x je j] + Zy=i^y in x y j < 0 (4.7)
Then
Atols = A) + m a x je j (4.8)
and
= - ( § i - max{§j}) > 0 (4.9)
where ^ Cols is corrected OLS intercept and u t is the estimated inefficiency. It provides
consistent estimates o f technical efficiency for each producer as = e x p ( - u t). Kumbhakar et al. (2015) points out, as the disadvantage o f this method, that the inefficiencies are highly sensitive to outliers. An unduly large value o f y £ can cause overestimating the technical inefficiencies than they would be.
4.1.b. Modified Ordinary Least Square
MOLS is proposed as a variation on COLS by Afriat (1972) and Richmond (1974). They suggested that the model could be estimated by OLS, under the assumption that the disturbances follow an explicit one-sided distribution about the inefficiency term u £, such as exponential or half-normal. The motivation for such distributional assumptions is that increasing technical inefficiency becomes increasingly unlikely (Kumbhakar & Lovell 2000, 71). A central moment o f the residuals may be utilized to yield a consistent estimator
o f the mean o f the inefficiency E[Ui] (Hokkanen 2014, 25). After estimation by OLS, the estimated intercept is shifted up (“modified”) by E [ u ] . Then
Pmols = P
o +E[U]
(4 1 0 )and
U L i= -(d i - E [ u i] ) > 0
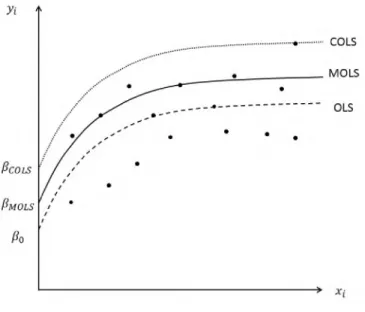
(4.11)The figure 4.1 shows OLS-based production frontiers. Since the estimation o f technical efficiency o f COLS and MOLS are based on OLS, the frontier line is parallel to the OLS regression line, which causes both frontier lines to have the same structure.
Figure 4. 1. OLS-based production frontiers
The COLS and MOLS methods do not take into account the random error, but in reality there are stochastic effects and neglecting them points out a major problem. The addition of a stochastic element at the estimated frontier is seen as the most important innovation to be introduced in the next chapter in the stochastic frontier model.
4.2. Stochastic Production Frontier Model
The stochastic production frontier model was first proposed by Aigner, Lovell and Schmidt (1977) and Meeusen and van den Broeck (1977) for Cobb-Douglas case as following:
lnyi = Po+
Pj Inxji - U i + V i
(4.12)yp
Dependent variableXjim
.
Vector o f the independent variables,Ui
: Inefficiency component,vp.
Random error term, N ~(0,a2)
The
Ui
inefficiency terms indicates the amount that is less than the production level that was expected, while thev i
terms captures random variations across DMUs. Thev i
terms could arise from measurement error or omitted factors (Coelli et al. 2005). The main idea given with stochastic frontier model is that the production ‘frontier’ could be under the influence o f non-deterministic factors. Many unsuccessful random factors, even weather conditions, are able to appear as inefficiency (Greene 2008).If we use a single input
x
and outputy
in the model, the Cobb-Douglas stochastic frontier model consists of:lnyi = Po+ Pilnxi - Ui + Vi
orj i = exp(fo + Pilnxi) exp(v ^ exp(-U{)
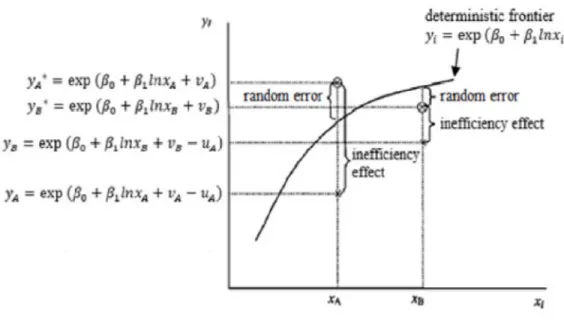
(4.13)In the figure 4.2, the input values are shown horizontally, and the output values are shown in the vertical axis. The DMU A uses the input
xA
to produce the outputy
A, while the DMU B uses the inputxB
to generate the outputy
B. If the DM U ’s are 100% efficient(uA = 0,uB =
0) then the boundary outputs are as follows:V
a* =exp(p0 + p xlnxA + vA)
y B* = exp(p0 + p 1lnxB + v
B) (4.14)Figure 4. 2. Stochastic Frontier Model Source: Coelli et al., (2005, p. 244)
Actually, the determination of the technical efficiency at the stochastic production frontier is represented in the Figure 4.2. For DM U A, the deviation o f the frontier output
(yA*)
from the deterministic production frontier gives the random error and the deviation o f the observed output(yA)
from the frontier output(yA*)
gives the inefficiency. The same applies to DMU B.4.2.a. Technical Efficiency
The output oriented technical efficiency, the ratio of observed output to the corresponding frontier output, is calculated by using equation 4.2:
TE; =
---—---e x p [ ß 0 + £ j ß j Inx ji+Vi] (4.15)
The denominator o f the equation 4.15,
exp[fi0 + ^ lj=i Pj lnxji + v i]
indicates the maximum potential o f production where the inefficiency score o f the firm is zero ( u =0) that is called frontier production. As for the nominator part we use equation 4.13;TE; =
e x p [ ß 0 + 1E j ß j l n x j i - U i + V j ]
e x p [ ß 0 +'Ej ß j l n x j i + V i ]
exp(- u t)
(4.16)TEi
measures the observed output relative to the maximum potential o f output by using the amount of input. The formula of technical efficiency of stochastic frontier model is similar with deterministic, but onwards, the error terms assumptions will provide efficiency scores with new parameters containing individual-specific information.4.2.b. Estimating The Parameters
In the SFA,
v t
is assumed to be normally distributed, while distribution o fu t
has been assumed to be Half-Normal, Truncated Normal, Exponential or Gamma. Sinceu t
is expected to be positive(ut >
0) due to its distribution character, the composed error term£i = Vi — u t
is asymmetric and negatively skewed. W e assume thatv t
andu t
are distributed independently o fx
t, then we get againlike in COLS method. This means that OLS could provide consistent estimates o f , but not o f
fy0.
M oreover it does not provide individual-specific technical efficiency. However, OLS could provide parameters about skewness for the presence technical inefficiency such that negatively skewed residuals suggest the presence o f technical inefficiency. In order to test skewness, Schmidt & Lin (1984) proposed a test statistic(b1) 1/2 =
m 3/ ( m 2) 1/2
formed by the second and third sample moments o f the OLS residuals. On the other hand, Coelli (1995) proposedm 3/( 6 m 23) 1/2
which is a variant o f this test. Although useful as screening devices, these tests do not use the information from the distribution functions o f the random error (Kumbhakar et al. 2015, 65). The other method which will be introduced in Chapter 4.5 is Likelihood Ratio (LR) test conducted after the Maximum Likelihood (ML) estimation of the model are undertaken.Mainly, the Maximum Likelihood (ML) method is used to estimate the parameters of the SFA model. In this approach, distributional assumptions are important in the estimation process. The random error term is normally distributed providing such features as OLS estimation. On the other hand, distribution o f inefficiency error term is an important issue because
u t
is assumed to be a one-sided error term with nonzero averages and the appropriate distribution assumption should be made. In this chapter, the parameters will be estimated according to error term components distributional assumptions by using ML method.4.2.b.i. The N o rm a l - H a lf N o rm a l M o d e l
This model developed by Aigner, Lovell and Smith (1977) uses the following distributional assumptions to obtain ML estimates o f the stochastic production limit:
(i)
Vi
~ iidN(Q,o%)
(ii)
Ui
~ iidN+(0,aZ)
(iii)
v i
andu i
are distributed independently o f each other and, o f the regression coefficientsAssumption (ii) means that
u i
has nonnegative half normal distribution. The independence of regression coefficients andUi
given in the assumption (iii) means that if producers have information about their technical efficiency, their choice of inputs may change (Kumbhakar & Lovell 2000, 75).The density function of
U
is’u i ^ 0
<4 1 8 )The density function o f
v
isf (v) =
1
(
v 2
iGXP { 2av2\
, —œ< V i< r n
(4.19)Under the independence assumption, we product their density functions in order to get the joint density function o f
u
andv,
f ( u , v) =
22ÏÏO'
i iO'
j_{
U2 V2 1
r/. ^ 2
{
u 2
(£+u)21f M = ^ r ^ e x p { - — - —
j
2 77" G n (7 p
(4.21) By integrating
u
we finally obtain:ZOO
= Ç f ( u ,e ) d u
V2no
-—EA
a
1 — 0 1) exp
{2
2a2
=
2H
;) H
— 7 )
(4.22)2
where
O = (o£ + 0^^~)1/2, A =
- , 0 ( . ) and 0 ( .)
denotes the standard normal densityGv
and cumulative distribution functions are discussed by Aigner, Lovell and Schmidt (1977).
The marginal density function
f ( e )
is asymmetrically distributed with mean and varianceE(e) = —E(u) = —auV2n
(4.23)V(e) = V(u) + V(v) = ?—2 oU + o2
(4.24)The log-likelihood function for the marginal density function o f the compound error term taking place in equation 4.22 for a sample o f N producers is:
lnL(ylfi,A,a2) = constant — Nina + %i l n Q ( —E^ ) —^ ^ i Ei2
(4 2 5 )Thus, we can obtain maximum likelihood estimates o f the parameters
A
andO
by maximizing with respect to them. These estimates are consistent asl ^
+ œ . Although with this way we can obtain information o fEi
containing information o fu i
, it is notenough for individual specific information. After the estimation o f the parameters, the inefficiency term
u t
needs to be distinguished from the compound error term £ j. In the context, Jondrow, Lovell, Materov, and Schmidt (1982) have proposed the JLMS technique to obtain individual specific inefficiencies. The JLMS technique displays the conditional distribution of the inefficiency error term according to the given compound error term as follows:/ ( w k ) =
f(u ,e )
/ (£) (4.26)
To calculate we use equation 4.14 and 4.15;
« ui£)= v i k “ p{-iï- H / [ i - ®(- :3]
(4.27)where
^*
=—
eov2/o2
and a*2 =a ^ a ^ /o 2.
Sincef( u le )
is distributed asN+(^*,
o*2), the mean o f the distribution can be used to get point estimator foru
t;E (uilei)
= ^ +a*
* ( - £ ) 1 - ® ( - t i )V
o*J
= O*
' 0(gt^/fr).1
-<b(£iX/o')
(S
iÀ/o)']
(4.28)By obtaining the point estimation o f
u
t, we can make estimation o f technical efficiency o f each producer by using equation 4.17,TEt =
exp(iTj) =E (Ui
(4.29)On the other hand, Battesse and Coelli (1988) proposed the alternative point estimator for
TEt
:TEi = E (exp{-Ui}
|£j)l - ^ g i . - ^ / g,)
1-$(^, i/g.) exp
\-E*i
+ 1<T*2} (4.30)Since the variation associated with the distribution o f
(ut
|£j) is independent o f i, all of the estimates o f individual efficiency are inconsistent. Nonetheless, there is no alternative consistent estimator o f individual efficiency when using cross-section data (Cornwell & Schmidt, 2008).4.2.b.ii. The Normal - Truncated Normal Model
The normal-half normal model can be generalized by allowing
u
to follow a truncated normal distribution. The normal-truncated normal formulation introduced by Stevenson (1980) uses the following distributional assumptions to obtain ML estimates o f the stochastic production limit:(i)
vi
~ iidN(0,a£)
(ii)
u t
~ iidN+(y.,o^)
(iii)
Vi
andu t
are distributed independently o f each other and, o f the regression coefficientsIn addition to half normal distribution, the mode o f distribution
p
is estimated as a new parameter. It provides a somewhat more flexible design o f efficiency in the data (Kumbhakar & Lovell 2000, 83).The density function o f u is
f ( u ) =
2^ 2 n a uO ( - ^ / a u)
e x p
(u-y.)2}
2°U2 J
Ui >
0 (4.31)where O ( .) denotes the standard normal cumulative distribution function. As seen,
f ( u )
is also considered as the density o f a normally distributed variable with nonzero meanp
and truncated below zero. Ifp = 0
the density function in equation 4.31 turns into the half normal density function.Similarly, the joint density function o f
u
andv t
is the product o f their composite density function due to the independence assumption. The log likelihood function for a sample ofN
producers is calculated as:lnL(y\p,A,a,p) = constant — Nina + Nln<$
+ 'Ll In
O ( ^ —1
2L t ( c i r )
2
(4.32)
where
au = A a /^ 1 + A2.
By maximization o f this function with respect to the unknown parameters, parameter estimates o f the model are obtained. Here, as in the normal-half normal state, the point estimates o f the efficiencies are obtained in the form o f mode or average o f the conditional distribution o fu
when £ is known.4.2.b.iii. The Normal
-Exponential Model
Since the assumption o f half-normality is a very restrictive assumption, a number of alternative distribution assumptions have been proposed instead o f this assumption.
(i)
Vi
~ iidN(Q,o%)
(ii)Ui
~ iid exponential(iii)
Vi
andu t
are distributed independently o f each other and, o f the regression coefficientsMeeusen and van den Broeck (1977) and Aigner et al. (1977) have proposed the log- likelihood function assuming that the inefficiency error term is exponentially distributed.
f ( u ) = 6 e x p (-d u )
(4.33)where
6 > 0
andu >
0. In the exponential model, the variance o f the term inefficiency is obtained asau = 1/6.
Similarly, the joint density function o fu
andv t
is the product of their composite density function due to the independence assumption. The log likelihood function for a sample o fN
producers is calculated as:InLÇylfi, OuOv) = constant — N ln a u + N
+ N 1 ( ^ ) + 'Z iln ® (
t e + ^ M A + ^ g t .2 \
ou)
1
\
av)
^ L
au(4.34)
By maximization of this function with respect to the unknown parameters, parameter estimates of the model are obtained. Technical efficiency point estimates are also obtained in a similar way.
4.2.b.iv. Determination o f the Distribution o f Inefficiency Term
Regarding the distribution of inefficiency terms, half-normal, truncated normal and exponential distributions are available in the software STATA 14.2. Diagrams o f the distributions are shown below. As can be seen, half-normal and exponential distribution
have the mode at zero whereas truncated-normal distribution has a non-zero mode. In this regard, many researchers feel that the half-normal and exponential distributions are inappropriate because the density o f efficiencies experience near 100% (Kimsey 2009). In addition, Atılgan (2016c) has found that the technical efficiency scores o f Turkish hospitals according to alternative models are highly correlated in terms of size and order.
Figure 4. 3. Inefficiency Term Distribution
Since the half-normal represents a special case of the truncated-normal, a likelihood ratio test (LR) for the appropriateness of the additional parameter of truncated-normal distribution is possible. In case of obtaining a significant difference as a result of LR test which is presented in Chapter 4.4, the truncated-normal assumption allows for further investigation o f factors influencing efficiency. On the other side, there is no statistical method to compare the convenience o f exponential distribution with others. Rosko (2001) reported a high correlation between the inefficiency scores o f models created using different distributions. For this reason, it has been suggested that making a different distribution assumption has had a small impact on efficiency estimates.
4.3. Translog Functional Form
The most widespread use o f the production function, along with many functional forms, is the form o f Translog after Cobb-Douglas. Translog production function (Christensen, Jorgenson & Lau 1971) is a generalization o f the Cobb-Douglas function and a flexible functional form providing a second order approximation:
Inyi = Po +
lnxji + 1 'Z1
j=i'Zk=iPjh lnxjilnxki + (vt - u t)
(4.35)where
Ui — 5m zr
lnxjilnx
hi: The interaction o f the corresponding level o f input j and input kz
mi: inefficiency variableSm:
inefficiency parameter to be estimatedIn addition to the Cobb-Douglas form, the cross-product and quadratic terms take place in the model. To test the new parameters of translog form LR test is used presented in Chapter 4.4.
The translog production model is preferred by the researchers in order to get flexibility in the specification o f input-output relations. The cross-product and quadratic terms obtained from the translog model help to gain more degrees of freedom (Rosko & Mutter 2008). Moreover, Chirikos & Sear (2000) indicates that cross products included in the translog function increase the average efficiency scores due to increased elasticity of the function.
The first-order coefficients o f the translog production function are not very informative to reflect the effect o f the change in inputs on the outputs. However, they are necessary
for the determination o f output elasticities. The output elasticity o f
Xj
o f the translog production function:e
dlnyi
J
dlnxi
Pj +
Pjk^n x k
(4.36)indicating the estimation o f responsiveness o f outputs to a change in inputs.
Returns to Scale is estimated as the sum o f output elasticities for all inputs
RTS = Zj ej = 'ZjÇfij + l k Pjklnxk)
(4.37)indicating the estimation o f responsiveness o f outputs to a change in all inputs.
4.4. Testing Hypotheses
The technical efficiency o f a stochastic frontier model needs primarily one-sided error specification. The OLS-residual-based skewness tests satisfies the specification but it is not usable due to lack o f the information from distribution functions o f the random error (Parmeter & Kumbhakar 2017). To test the existence o f no one-sided error
u
t, Battese & Corra (1977) introduced a gamma parametrization:Y =
<72
a l + a 2 (4.38)
which has a value between 0 and 1. The parametrization has an advantage in the numerical maximization process because searches of maximizing values are restricted the parameter space (Kumbhakar et al. 2015, 66). It signifies the deterministic inefficiency portion of total error which involves computation.
The likelihood ratio (LR) test for the null hypotheses is defined:
A = - 2 [ L ( H o ) - L ( H i ) ] (4.39) where
L(H0)
is log likelihood value o f the restricted model andL(H1)
is log-likelihood value o f unrestricted model. LR has a mixed chi-square distribution, which is why the Kodde and the Palm (1986) table are used.As it is mentioned earlier in this chapter, the likelihood ratio test can be also performed for |i parameter o f truncated-normal distribution, translog production function coefficients o f square and cross products, and inefficiency variable coefficients. All null hypotheses will be discussed and their inferences are presented below:
1)
H0:
7 = 0, there is no one-sided error, SFA is not usable2)
H0: ft =
0, the parameter o f truncated-normal model are not significant3)
H0: ftjh =
0, coefficient terms o f translog model are not significantCHAPTER V
MEASURING OF TECHNICAL EFFICIENCY
In this section, firstly efficiency measurement practices o f health facilities in Turkey and in the world are summarized according to the purpose o f using SFA. Then, the empirical model was established by determining the DMUs and the variables belonging to these DMUs based on the knowledge in the literature and working in the direction of the existing data. Finally, hypothesis tests, parameter estimates, maximum likelihood estimates and technical efficiency calculations for each inpatient care services were implemented.
5.1. Literature Review
When we look at the literature about efficiency measurement research on health care, the SFA method obviously constitutes a small part. W orthington (2004) and Hollingsworth & Peacock (2008) point to the deep theoretical background o f the SFA, the computational difficulties of this method, the flexibility in handling multiple outputs, and the uncertainties in the distributional assumptions associated with the inefficiency terms are among the reasons for this. Rosko & M utter (2011) remarks that using multi-output models in searching technical efficiency with SFA causes substantial information loss. To avoid the obstacles o f SFA, the researches prefers non-parametric approaches such as Data Envelopment Analysis (DEA). However, non-parametric methods do not provide us usable parameter for developing policy about health-care resource planning. There has
been researches about healthcare efficiency in the literature using these parametric and non-parametric methods. Chirikos & Sear (2000), supporting the estimation of comparable DEA and SFA models, has found that the efficiency scores diverge as reaching to maximum and minimum points. Katharakis et al. (2014) reached the same results in their research aiming to facilitate a common understanding about the adequacy o f these methods by analyzing Greek hospitals. They concluded that divergent efficiency estimates arise from environmental variables, which is the component o f SFA, such as being hospital status and geographical position. In case o f Czech hospitals, Prochazkova (2011) has found that SFA and DEA give similar results due to significant rank correlation between them. Nevertheless, after adding inefficiency variables which are teaching status, hospital size, ownership type, population, unemployment rate and salary, the significance o f rank correlation between SFA and DEA results does not exist anymore.
According to the current literature, investigating the effects o f health policy on the efficiency o f hospitals by using panel data, SFA has an important place. Particularly in Turkey, SFA studies have been conducted on measuring the success o f the structural changes, that occur under the HTP, over hospital efficiency. Atılgan (2012) used Turkish MoH panel data o f 2007-2009 years in his study where the cost effectiveness o f General Hospitals was examined. According to the results o f the study, the performance based additional payment system does not increase the cost effectiveness in hospitals. While ineffectiveness effects increase the bed occupancy rates efficiency scores according to model estimation results, hospital efficiency scores decrease in regions where population and development level are high. In addition to this research, Keskin (2017) analyzed Turkish health reforms between 2009-2014 years by using similar methods. It has founded