he number of women starting pregnancy with high body mass index (BMI) (calculated as weight in kg/square of height in m2) increases over
years due to maternal age and improper diets.1,2The prevalence of
obe-sity in pregnant women varies widely depending upon the population. In the USA, the prevalence of pre-pregnancy obesity and overweight is both 26%.3
High pre-pregnancy BMI and excessive weight gain during pregnancy confers increased risk of gestational diabetes mellitus (GDM), preeclamp-sia, dystocia and cesarean delivery (CD).4,5Although the mode of delivery
is still determined by obstetric indications, it is reported that the frequency of CD increases in obese women.5
In this study, we aimed to evaluate the effect of pre-pregnancy BMI and weight gain during pregnancy on the mode of delivery, durations of ac-tive stage of delivery and second stage of delivery.
MATERIAL AND METHODS
The present prospective case-control study was carried out at Bursa Train-ing and Research Hospital durTrain-ing 1-year period. Data were abstracted from
The Effects of Gestational Weight Gain and
Maternal Body Mass Index Discrepancy on
All Stages of Labor
AABBSS TTRRAACCTT OObbjjeeccttiivvee:: To investigate the effects of maternal body mass index (BMI) and total weight gain during the pregnancy (WGDP) on all stages of labor. MMaatteerriiaall aanndd MMeetthhooddss: This is a prospective case-control study carried out at a tertiary referral hospital during 1-year period of time. We divided study population into 4 groups according to BMI and classified women accord-ing to WGDP; inadequate, optimum, excessive. Then we assessed the maternal characteristics, ce-sarean rate, all variables of labor stages, delivery complications, operative delivery rates, and interventions such as; induction rate and episiotomy. RReessuullttss:: A total of 523 women were included in the study [n=55 (10.5%) cesarean section and n=468 (89.5%) vaginal delivery]. There were 435 pregnant Turkish women and 88 Syrian Refugees in the study population. Younger maternal age and need for episiotomy was more common in low-weight group than others. All stages of labor ex-cept transition stages (duration between 7 and 10 cm of cervical dilatation) was longer in obese group (222.9±35.6 min, 195.8±29.6 min, 200.6±30.4 min, 255.8±38.2 min in group 1,2,3 and 4, re-spectively) (p<0.05). We found no statistically significant effect of weight gain on the duration of labor. CCoonncclluussiioonn:: Either low and high pre-gestational BMI are found to lead to increased risk of adverse labor results in compatible with literature. Therefore, professionals should support weight loss or gain to achieve optimal BMI in women planning pregnancy.
KKeeyywwoorrddss:: Body mass index; delivery; labor; weight gain Bora ÇOŞKUNa, Çağrı GÜLÜMSERb, Emine AYDINc, Buğra ÇOŞKUNa, Gülçin SERPİMd, Tuğberk GÜÇLÜe, Mehmet Özgür AKKURTf
aDepartment of Obstetrics and Gynecology,
Yüksek İhtisas University Faculty of Medicine Liv Hospital Ankara,
bDepartment of Obstetrics and Gynecology,
University of Health Science Faculty of Medicine, Ankara, TURKEY
cDepartment of Obstetrics and Gynecology,
İstanbul Medipol University Faculty of Medicine, İstanbul, TURKEY
dClinic of Obstetrics and Gynecology,
Bursa Yüksek İhtisas Training and Research Hospital,
Bursa, TURKEY
eClinic of Obstetrics and Gynecology,
Kars Harakani State Hospital, Kars, TURKEY
fClinic of Obstetrics and Gynecology,
Esentepe Hospital, Bursa, TURKEY Re ce i ved: 18 Oct 2019
Received in revised form: 26 Nov 2019 Ac cep ted: 27 Nov 2019
Available online: 02 Dec 2019 Cor res pon den ce:
Bora ÇOŞKUN Yüksek İhtisas University
Faculty of Medicine Liv Hospital Ankara, Department of Obstetrics and Gynecology Ankara, TURKEY
Cop yright © 2019 by Tür ki ye Kli nik le ri
DOI: 10.5336/jcog.2019-71902 ORIGINAL RESEARCH
women who were admitted for labor. The study has been reviewed and approved by the Institu-tional Review Board of Bursa Yuksek Ihtisas Train-ing and Research Hospital (Decision dated 25/07/2018 and numbered 2011-KAEK-25 2018/07-44). The study was conducted in accordance with the Helsinki Declaration. Written consents were re-ceived from all patients before the study.
Inclusion criteria were full-term singleton pregnancy, cephalic presentation, completed pre-natal data with a follow-up at our center. Patients were excluded if they had chronic diseases (heart, brain, lungs, liver or renal disease), gestational di-abetes mellitus, preeclampsia, placenta previa, se-vere fetal anomalies and stillbirth. All subjects were divided into groups according to BMI which is de-fined by World Health Organization (WHO) as low, normal, overweight or obesity.
Based on the WHO classification, “low” and “normal” body weights are reflected by a BMI be-tween <18.5 kg/m2 -18.5 kg/m2, and BMI <24.9
kg/m2, respectively, whereas “overweight” and
“obe-sity” are reflected by values between 25.0 kg/m2
- <29.9 kg/m2, and BMI ≥30.0 kg/m2, respectively.
After this classification, same patients were sorted according to Institute of Medicine (IOM) recom-mendations related to patients’ weight gain during the pregnancy (WGDP); as inadequate, adequate and excessive.6
Data including parity, nationality, maternal age, maternal height, weight before pregnancy, BMI, end of pregnancy weight, total weight, mode of de-livery (cesarean dede-livery, vaginal dede-livery, operative delivery), presence of spontaneous labor, augmen-tation and induction need, active stage duration, sec-ond stage of delivery, placental separation time, the presence of episiotomy, the presence of laceration, gestational week at delivery, sonographic measure-ments of fetus (biparietal diameter (BPD), head cir-cumference (HC), abdominal circir-cumference (AC), femur length (FL), estimated fetal weight (EFW)), birth weight, fetal gender, Apgar scores at 1st and 5th
minute, and CD indications were obtained from maternal and neonatal files.
Active phase of the first stage of labor started from the moment the cervical opening reached 3 cm,
as described before. The active phase period was di-vided into 3 phases; between 4-6 cm, 6-8 cm, 8-10 cm of cervical dilatation. The decision and timing of induction, amniotomy and episiotomy in all patients was decided by the senior author (MÖA).
STATISTICAL ANALYSES
Statistical analysis for the data was performed by SPSS version 22.0 (IBM SPSS Statistics for Win-dows, Version 22.0. Armonk, NY: IBM Corp.). Cat-egorical variables were calculated as percentage or frequency and continuous variables were given as mean ± standard deviation. One-way Anova test or Kruskal Wallis test was used for comparison of con-tinuous variables. The categorical variables were compared with Pearson’s chi-square test. The analysis of pairwise comparisons between groups was performed with LSD or Conover-Inman test. P value <0.05 was accepted as statistically signifi-cant in all analyzes.
RESULTS
A total of 523 women constituted the study popu-lation; 55 had cesarean section and 468 had normal vaginal delivery. Of the 468 women giving birth by vaginal route; 20, 257, 137 and 53 were in under-weight, normal under-weight, overweight and obese group respectively. Vacuum was needed for a pa-tient in the normal weight group.
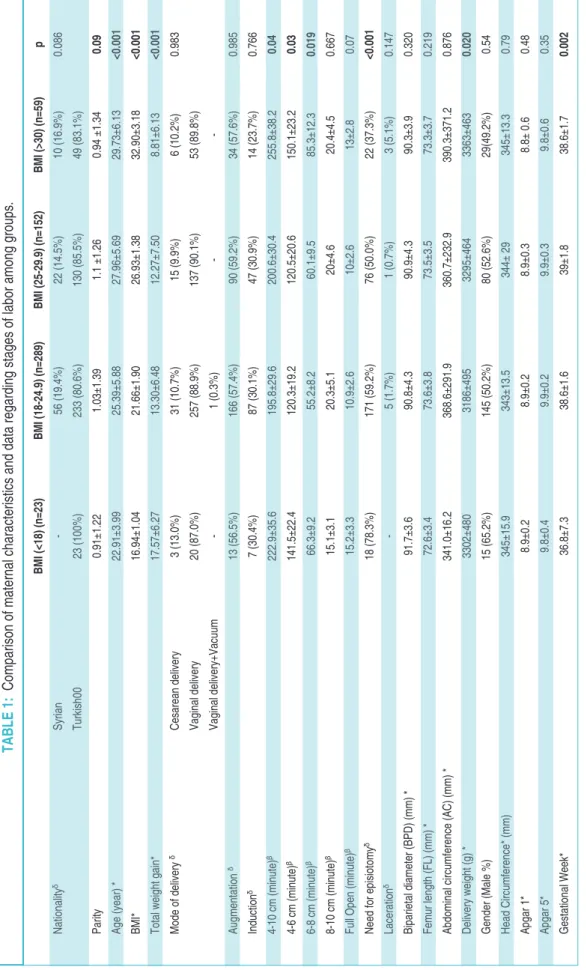
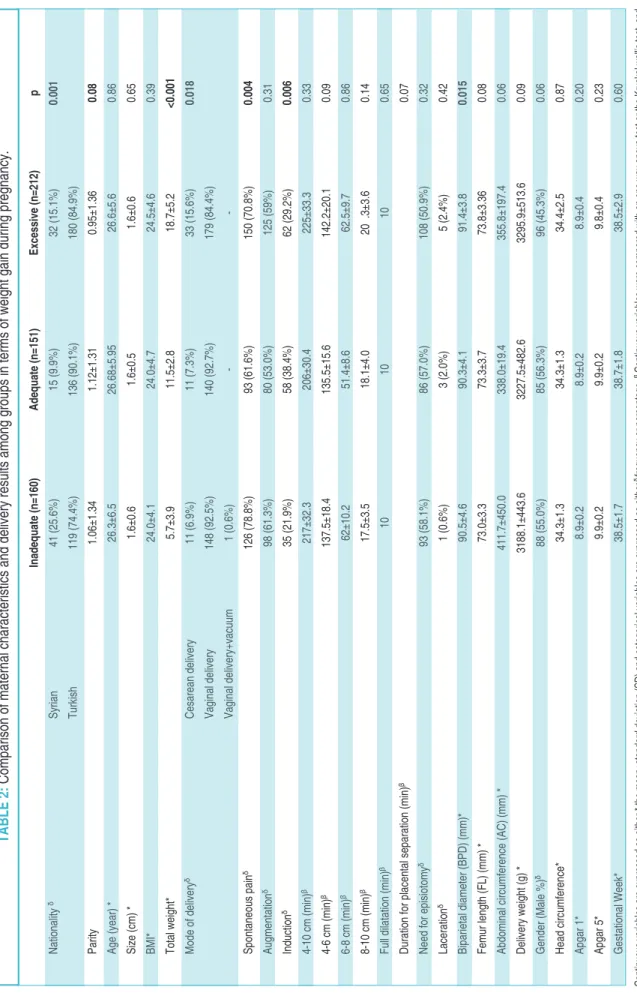
Maternal characteristics and information re-lated to the stages of labor are shown in Table 1and
Table 2, when groups were classified according to BMI and WGDP. According to this analysis, the duration between 4-6 cm and 6-8 cm of cervical di-latation was longer in overweight group compared with the other groups. The need for episiotomy was more frequent in low weight group (Table 1). The need of oxytocin augmentation or induction was not different among groups (Table 1). Although, excessive weight gain was found to increase the risk of CD, weight gain during pregnancy had no effect on stages of labor as shown in Table 2.
Fetal biometric measurements, gestational week at delivery, birth weights, gender and Apgar scores in terms of pre-pregnancy BMI and WGDP are presented in Table 3. Gestational weeks at
de-BM I ( <1 8) (n =2 3) BM I ( 18 -2 4.9 ) ( n= 28 9) BM I ( 25 -2 9.9 ) ( n= 15 2) BM I ( >3 0) (n =5 9) p Na tio na lity δ Sy ria n -56 (1 9.4 % ) 22 (1 4.5 % ) 10 (1 6.9 % ) 0.0 86 Tu rki sh 00 23 (1 00 % ) 23 3 ( 80 .6% ) 13 0 ( 85 .5% ) 49 (8 3.1 % ) Pa rity 0.9 1± 1.2 2 1.0 3± 1.3 9 1.1 ±1 .26 0.9 4 ± 1.3 4 0.0 9 Ag e ( ye ar ) * 22 .91 ±3 .99 25 .39 ±5 .88 27 .96 ±5 .69 29 .73 ±6 .13 <0 .00 1 BM I* 16 .94 ±1 .04 21 .66 ±1 .90 26 .93 ±1 .38 32 .90 ±3 .18 <0 .00 1 To tal w eig ht ga in* 17 .57 ±6 .27 13 .30 ±6 .48 12 .27 ±7 .50 8.8 1± 6.1 3 <0 .00 1 Mo de of de liv er y δ Ce sa re an de liv er y 3 ( 13 .0% ) 31 (1 0.7 % ) 15 (9 .9% ) 6 ( 10 .2% ) 0.9 83 Va gin al de liv er y 20 (8 7.0 % ) 25 7 ( 88 .9% ) 13 7 ( 90 .1% ) 53 (8 9.8 % ) Va gin al de liv er y+ Va cu um -1 ( 0.3 % ) -Au gm en tat ion δ 13 (5 6.5 % ) 16 6 ( 57 .4% ) 90 (5 9.2 % ) 34 (5 7.6 % ) 0.9 85 Ind uc tio n δ 7 ( 30 .4% ) 87 (3 0.1 % ) 47 (3 0.9 % ) 14 (2 3.7 % ) 0.7 66 4-10 cm (m inu te) β 22 2.9 ±3 5.6 19 5.8 ±2 9.6 20 0.6 ±3 0.4 25 5.8 ±3 8.2 0.0 4 4-6 c m (m inu te) β 14 1.5 ±2 2.4 12 0.3 ±1 9.2 12 0.5 ±2 0.6 15 0.1 ±2 3.2 0.0 3 6-8 c m (m inu te) β 66 .3± 9.2 55 .2± 8.2 60 .1± 9.5 85 .3± 12 .3 0.0 19 8-10 cm (m inu te) β 15 .1± 3.1 20 .3± 5.1 20 ±4 .6 20 .4± 4.5 0.6 67 Fu ll O pe n ( mi nu te) β 15 .2± 3.3 10 .9± 2.6 10 ±2 .6 13 ±2 .8 0.0 7 Ne ed fo r e pis iot om y δ 18 (7 8.3 % ) 17 1 ( 59 .2% ) 76 (5 0.0 % ) 22 (3 7.3 % ) <0 .00 1 La ce ra tio n δ -5 ( 1.7 % ) 1 ( 0.7 % ) 3 ( 5.1 % ) 0.1 47 Bi pa rie tal di am ete r ( BP D) (m m) * 91 .7± 3.6 90 .8± 4.3 90 .9± 4.3 90 .3± 3.9 0.3 20 Fe mu r le ng th (F L) (m m) * 72 .6± 3.4 73 .6± 3.8 73 .5± 3.5 73 .3± 3.7 0.2 19 Ab do mi na l c irc um fer en ce (A C) (m m) * 34 1.0 ±1 6.2 36 8.6 ±2 91 .9 36 0.7 ±2 32 .9 39 0.3 ±3 71 .2 0.8 76 De liv er y w eig ht (g ) * 33 02 ±4 80 31 86 ±4 95 32 95 ±4 64 33 63 ±4 63 0.0 20 Ge nd er (M ale % ) 15 (6 5.2 % ) 14 5 ( 50 .2% ) 80 (5 2.6 % ) 29 (4 9.2 % ) 0.5 4 He ad C irc um fer en ce * ( mm ) 34 5± 15 .9 34 3± 13 .5 34 4± 29 34 5± 13 .3 0.7 9 Ap ga r 1 * 8.9 ±0 .2 8.9 ±0 .2 8.9 ±0 .3 8.8 ± 0 .6 0.4 8 Ap ga r 5 * 9.8 ±0 .4 9.9 ±0 .2 9.9 ±0 .3 9.8 ±0 .6 0.3 5 Ge sta tio na l W ee k* 36 .8± 7.3 38 .6± 1.6 39 ±1 .8 38 .6± 1.7 0.0 02 TA BL E 1: Co mp ar iso n o f m ate rn al ch ar ac ter ist ics an d d ata re ga rd ing st ag es of la bo r a mo ng gr ou ps . Co nti nu ou s v ar iab les ar e e xp re ss ed as ei the r * th e m ea n± sta nd ar d d ev iat ion (S D) an d c ate go ric al va ria ble s a re ex pr es se d a s e ith er δfre qu en cy or pe rce nta ge . β Co nti nu ou s v ar iab les w er e c om pa re d w ith an on e w ay an ov a t es t o r t he K ru sk al wa llis te st, an d ca teg or ica l v ar iab les w er e c om pa re d u sin g P ea rso n’s ch i-s qu ar e t es t. L SD or C on ov er -In ma n t es t w er e p er for me d f or th e b ina ry co mp ar iso ns am on g t he gr ou ps an d t he p va lue w as se t a t 0 .05 .
In ad eq ua te (n =1 60 ) Ad eq ua te (n =1 51 ) Ex ce ss ive (n =2 12 ) p Na tio na lity δ Sy ria n 41 (2 5.6 % ) 15 (9 .9% ) 32 (1 5.1 % ) 0.0 01 Tu rki sh 11 9 ( 74 .4% ) 13 6 ( 90 .1% ) 18 0 ( 84 .9% ) Pa rity 1.0 6± 1.3 4 1.1 2± 1.3 1 0.9 5± 1.3 6 0.0 8 Ag e ( ye ar ) * 26 .3± 6.5 26 .68 ±5 .95 26 .6± 5.6 0.8 6 Si ze (c m) * 1.6 ±0 .6 1.6 ±0 .5 1.6 ±0 .6 0.6 5 BM I* 24 .0± 4.1 24 .0± 4.7 24 .5± 4.6 0.3 9 To tal w eig ht* 5.7 ±3 .9 11 .5± 2.8 18 .7± 5.2 <0 .00 1 Mo de of de liv er y δ Ce sa re an de liv er y 11 (6 .9% ) 11 (7 .3% ) 33 (1 5.6 % ) 0.0 18 Va gin al de liv er y 14 8 ( 92 .5% ) 14 0 ( 92 .7% ) 17 9 ( 84 .4% ) Va gin al de liv er y+ va cu um 1 ( 0.6 % ) -Sp on tan eo us pa in δ 12 6 ( 78 .8% ) 93 (6 1.6 % ) 15 0 ( 70 .8% ) 0.0 04 Au gm en tat ion δ 98 (6 1.3 % ) 80 (5 3.0 % ) 12 5 ( 59 % ) 0.3 1 Ind uc tio n δ 35 (2 1.9 % ) 58 (3 8.4 % ) 62 (2 9.2 % ) 0.0 06 4-10 cm (m in) β 21 7± 32 .3 20 6± 30 .4 22 5± 33 .3 0.3 3 4-6 c m (m in) β 13 7.5 ±1 8.4 13 5.5 ±1 5.6 14 2.2 ±2 0.1 0.0 9 6-8 c m (m in) β 62 ±1 0.2 51 .4± 8.6 62 .5± 9.7 0.8 6 8-10 cm (m in) β 17 .5± 3.5 18 .1± 4.0 20 .3 ±3 .6 0.1 4 Fu ll d ila tat ion (m in) β 10 10 10 0.6 5 Du ra tio n f or pl ac en tal se pa ra tio n ( mi n) β 0.0 7 Ne ed fo r e pis iot om y δ 93 (5 8.1 % ) 86 (5 7.0 % ) 10 8 ( 50 .9% ) 0.3 2 La ce ra tio n δ 1 ( 0.6 % ) 3 ( 2.0 % ) 5 ( 2.4 % ) 0.4 2 Bi pa rie tal di am ete r ( BP D) (m m) * 90 .5± 4.6 90 .3± 4.1 91 .4± 3.8 0.0 15 Fe mu r le ng th (F L) (m m) * 73 .0± 3.3 73 .3± 3.7 73 .8± 3.3 6 0.0 8 Ab do mi na l c irc um fer en ce (A C) (m m) * 41 1.7 ±4 50 .0 33 8.0 ±1 9.4 35 5.8 ±1 97 .4 0.0 6 De liv er y w eig ht (g ) * 31 88 .1± 44 3.6 32 27 .5± 48 2.6 32 95 .9± 51 3.6 0.0 9 Ge nd er (M ale % ) δ 88 (5 5.0 % ) 85 (5 6.3 % ) 96 (4 5.3 % ) 0.0 6 He ad ci rcu mf er en ce * 34 .3± 1.3 34 .3± 1.3 34 .4± 2.5 0.8 7 Ap ga r 1 * 8.9 ±0 .2 8.9 ±0 .2 8.9 ±0 .4 0.2 0 Ap ga r 5 * 9.9 ±0 .2 9.9 ±0 .2 9.8 ±0 .4 0.2 3 Ge sta tio na l W ee k* 38 .5± 1.7 38 .7± 1.8 38 .5± 2.9 0.6 0 TA BL E 2: Co mp ar iso n o f m ate rn al ch ar ac ter ist ics an d d eli ve ry re su lts am on g g ro up s i n t er ms of w eig ht ga in du rin g p re gn an cy . Co nti nu ou s v ar iab les ar e e xp re ss ed as ei the r * th e m ea n± sta nd ar d d ev iat ion (S D) an d c ate go ric al va ria ble s a re ex pr es se d a s e ith er δfre qu en cy or pe rce nta ge . β Co nti nu ou s v ar iab les w er e c om pa re d w ith an on e w ay an ov a t es t o r t he K ru sk al wa llis te st, an d ca teg or ica l v ar iab les w er e c om pa re d u sin g P ea rso n’s ch i-s qu ar e t es t. L SD or C on ov er -In ma n t es t w er e p er for me d f or th e b ina ry co mp ar iso ns am on g t he gr ou ps an d t he p va lue w as se t a t 0 .05 .
livery differed between underweight, normal weight, overweight and obese patients (p= 0.002) (Table 1).
A statistically significant difference was found between birth weights in normal weight, over-weight and obese groups (p= 0.02) but there was no statistically significant difference between these groups according to WGDP (Table 2).
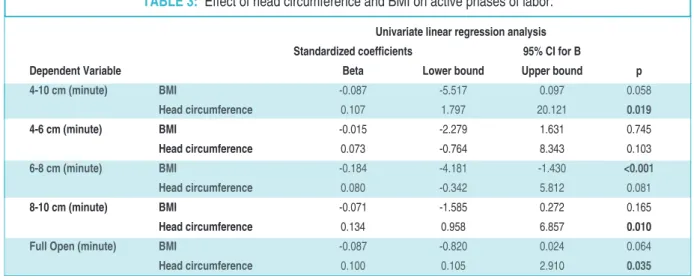
There were no effects of only BMI or only HC on the delivery mode (cesarean delivery or vaginal delivery) (p= 0.453 and p= 0.586, respectively). But as regards the details, HC effects durations of ac-tive stage and second stage of labor. Duration of cervical dilatation between 8-10 cm, total active stage duration (4-10 cm) and the duration of sec-ond stage were influenced by HC (Table 3).
DISCUSSION
The adverse effects of high BMI before pregnancy and excessive WGDP and delivery process have been investigated repeatedly.4-7Low or high BMI
has adverse effects on pregnancy outcomes and in-fant’s health. The risk of large-for-gestational-age births (LGA), cesarean delivery and childhood obe-sity are increased in overweight women (BMI 25.0-29.9 kg/m2) and maternal obesity (BMI ≥30.0
kg/m2). However small-for-gestational-age (SGA)
births are frequently seen in the pre-pregnancy
un-derweight (BMI <18) women.8In previous studies,
the authors reported that high BMI is associated with elevated CD rates associated with relative ob-struction of birth canal due to expanding pelvic
tis-sue.5,8-10In another study, researchers claimed that
women who are overweight or obese may experi-ence increased risk of cesarean delivery as a conse-quence of excess pelvic soft tissue, which can lead to a relative obstruction of the birth canal.11In
ad-dition, decreased cervical dilatation rates leading to increased inductions among obese women also increases cesarean delivery risk.12Our cesarean
de-livery ratio was 10.5%, and pre-pregnancy BMI was not effective on mode of delivery, but we ob-served an increase in cesarean delivery patients with excessive WGDP (p=0.018). Similarly, the presence of spontaneous pain and the need for in-duction were more frequent in patients with ex-cessive weight gain. Induction rates and induction failure show an increase despite the spontaneous pain in women with excessive WGDP.
Most previous studies reported that BMI has independent effect on duration of active labor.12-17
According to these studies, duration of first-stage of labor expands although furthers sup-port overall duration of labor expands.12-17
Similarly, a previous study claimed a statically sig-nificant increase in total labor duration in obese nulliparous.13 However, this study differed from
Univariate linear regression analysis Standardized coefficients 95% CI for B
Dependent Variable Beta Lower bound Upper bound p
4-10 cm (minute) BMI -0.087 -5.517 0.097 0.058 Head circumference 0.107 1.797 20.121 0.019 4-6 cm (minute) BMI -0.015 -2.279 1.631 0.745 Head circumference 0.073 -0.764 8.343 0.103 6-8 cm (minute) BMI -0.184 -4.181 -1.430 <0.001 Head circumference 0.080 -0.342 5.812 0.081 8-10 cm (minute) BMI -0.071 -1.585 0.272 0.165 Head circumference 0.134 0.958 6.857 0.010
Full Open (minute) BMI -0.087 -0.820 0.024 0.064
Head circumference 0.100 0.105 2.910 0.035
TABLE 3: Effect of head circumference and BMI on active phases of labor.
the others by the inclusion of patients from 1 cm cervical opening, which is evaluated as latent stage. Another study which involves 63,829 nulliparous women showed slower progression of labor in women who had high BMI than normal BMI.12In
our study, we evaluated labor progression, active stage and second stage of labor according to both pre-pregnancy BMI and WGDP. The duration of cervical opening from 6 cm to 8 cm in the active phase and the duration of the second stage of labor (cervix fully open) were significantly different be-tween pre-pregnancy underweight (BMI<18 kg/m2) and overweight (BMI: 25-29,9 kg/m2)
groups. No significant changes were observed in the total period of active stage (cervical opening 4-10 cm) and labor durations according to WGDP during pregnancy.
In the second stage of labor, the patient’s push-ing force is also effective, so it is arguable how accu-rate it is to reconcile with WGDP during pregnancy. However, this situation is considered to be contro-versial in other studies too.5In our study this time
was significantly different between the two groups in terms of BMI<18 and BMI between 25 -30 kg/m2.
Moreover, we did not use epidural analgesia which can affect the labor time in any patient.
Furthermore, the risk of congenital anomalies such as cardiac anomalies, facial defects and ex-tremity abnormalities are increased in obese women.18 Maternal obesity and excessive WGDP
also increase antepartum and postpartum complica-tion risk including fetal death, stillbirth, birth as-phyxia, prematurity, LGA and shoulder dys-tocia.19-21In this respect, we found statistically
sig-nificant differences in birthweight and gestational week at delivery between BMI 18-24,9 kg/m2 vs
BMI 25-29,9 kg/m2and BMI 18-24,9 kg/m2vs BMI
>30 kg/m2groups. Beside these findings, we have no
other significant outcome about neonates.
Prolonged second stage of labor was detected when head circumference was above the 75th
per-centile. It might be associated with neonatal as-phyxia due to increased obstetric interventions.22
However, in our study, we did not find any effect
of HC on duration between 8 and 10 cm of cervi-cal dilatation, second stage of labor and total time of active stage.
The limitation of our study is the small num-ber of patients in the study group. Moreover, study population is unequally distributed among groups. Therefore, results may preclude precise conclu-sions. Precise results can be achieved with larger study groups.
CONCLUSION
In conclusion, both low and high pre-pregnancy BMI are associated with increased risk of operative delivery and prolonged active stages of labor. Therefore, we think that pre-pregnancy weight control is very important.
I
Innffoorrmmiinngg
Due to the presence of the name of the journal editor’s among the authors, the assessment process of the study was conducted by the guest editor.
S
Soouurrccee ooff FFiinnaannccee
During this study, no financial or spiritual support was received neither from any pharmaceutical company that has a direct connection with the research subject, nor from a company that provides or produces medical instruments and materials which may negatively affect the evaluation process of this study.
C
Coonnfflliicctt ooff IInntteerreesstt
No conflicts of interest between the authors and / or family members of the scientific and medical committee members or members of the potential conflicts of interest, counseling, ex-pertise, working conditions, share holding and similar situa-tions in any firm.
A
Auutthhoorrsshhiipp CCoonnttrriibbuuttiioonnss
I
Iddeeaa//CCoonncceepptt:: Bora Çoşkun, Mehmet Özgür Akkurt, Çağrı Gülümser; DDeessiiggnn:: Bora Çoşkun, Mehmet Özgür Akkurt, Buğra Çoşkun; CCoonnttrrooll//SSuuppeerrvviissiioonn:: Çağrı Gülümser, Mehmet Özgür Akkurt; DDaattaa CCoolllleeccttiioonn aanndd//oorr PPrroocceessssiinngg:: Tuğberk Güçlü, Gülçin Serpim, Buğra Çoşkun; AAnnaallyyssiiss aanndd//oorr IInntteerrpprreettaattiioonn:: Bora Çoşkun, Emine Aydin, Çağrı Gülümser; LLiitteerraattuurree RRee--v
viieeww:: Bora Çoşkun, Emine Aydin; WWrriittiinngg tthhee AArrttiiccllee:: Bora Çoşkun, Çağrı Gülümser, Emine Aydin; CCrriittiiccaall RReevviieeww:: Buğra Çoşkun, Çağrı Gülümser; RReeffeerreenncceess aanndd FFuunnddiinnggss:: Bora Çoşkun, Mehmet Özgür Akkurt; MMaatteerriiaallss:: Tuğberk Güçlü, Gülçin Serpim..
1. Fisher SC, Kim SY, Sharma AJ, Rochat R, Morrow B. Is obesity still increasing among pregnant women? Prepregnancy obesity trends in 20 states, 2003-2009. Prev Med. 2013;56(6):372-8. [Crossref] [PubMed] [PMC]
2. World Health Organization (WHO). Global Health Observatory Data Repository. Ac-cessed 6 Nov 2014. [Crossref]
3. Deputy NP, Dub B, Sharma AJ. Prevalence and trends in prepregnancy normal weight-48 States, New York City, and District of Colum-bia, 2011-2015. MMWR Morb Mortal Wkly Rep. 2018;66(5152):1402-7. [Crossref] [PubMed] [PMC]
4. Cedergren MI. Maternal morbid obesity and the risk of adverse pregnancy outcome. Ob-stet Gynecol. 2004;103(2):219-24. [Crossref] [PubMed]
5. Ellekjaer KL, Bergholt T, Løkkegaard E. Ma-ternal obesity and its effect on labour duration in nulliparous women: a retrospective obser-vational cohort study. BMC Pregnancy Child-birth. 2017;17(1):222. [Crossref] [PubMed] [PMC]
6. Institute of Medicine, Committee on Nutritional Status During Pregnancy and Lactation. Nutri-tion During Pregnancy: Part I, Weight Gain: Part II, Nutrient Supplements. 1sted. Washington,
D.C: National Academy Press; 1990. p.480. 7. Maged AM, Belal DS, Marie HM, Rashwan H,
Abdelaziz S, Gabr AA, et al. Prospective study of the effect of maternal body mass index on labor progress in nulliparous women in Egypt. Int J Gynecol Obstet. 2017;139(3):329-35.
[Crossref] [PubMed]
8. Liu P, Xu L, Wang Y, Zhang Y, Du Y, Sun Y, et al. Association between perinatal outcomes
and maternal pre-pregnancy body mass index. Obes Rev. 2016;17(11):1091-102.
[Crossref] [PubMed]
9. Davies GAL, Maxwell C, McLeod L. Obesity in pregnancy. J Obstet Gynaecol Can. 2010;32(2):165-73. [PubMed]
10. Bergholt T, Lim LK, Jørgensen JS, Robson MS. Maternal body mass index in the first trimester and risk of caesarean delivery in nul-liparous women in spontaneous labour. Am J Obstet Gynecol. 2007;196(2):163.e1-5.
[Crossref] [PubMed]
11. Usha Kiran TS, Hemmadi S, Bethel J, Evans J. Outcome of pregnancy in a woman with an increased body mass index. BJOG. 2005;112(6):768-72. [Crossref] [PubMed]
12. Carlhäll S, Källén K, Blomberg M. Maternal body mass index and duration of labor. Eur J Obstet Gynecol Reprod Biol.
2013;171(1):49-53. [Crossref] [PubMed]
13. Norman SM, Tuuli MG, Odibo AO, Caughey AB, Roehl KA, Cahill AG. The effects of obe-sity on the first stage of labour. Obstet Gy-necol. 2012;120(1):130-5. [Crossref] [PubMed] [PMC]
14. Kominiarek MA, Zhang J, Vanveldhuisen P, Troendle J, Beaver J, Hibbard JU. Contem-porary labor patterns: the impact of maternal body mass index. Am J Obstet Gynecol. 2011;205(3):244.e1-8. [Crossref] [PubMed] [PMC]
15. Vahratian A, Zhang J, Troendle JF, Savitz DA, Siega-Riz AM. Maternal prepregnancy over-weight and obesity and the pattern of labor progression in term nulliparous women. Ob-stet Gynecol. 2004;104(5 Pt 1):943-51.
[Crossref] [PubMed]
16. Hilliard AM, Chauhan SP, Zhao Y, Rankins NC. Effect of obesity on length of labor in nul-liparous women. Am J Perinatol. 2012;29(02):127-32. [Crossref] [PubMed]
17. Pevzner L, Powers BL, Rayburn WF, Rumney P, Wing DA. Effects of maternal obesity on du-ration and outcomes of prostaglandin cervical ripening and labor induction. Obstet Gynecol. 2009;114(6):1315-21. [Crossref] [PubMed]
18. Stothard KJ, Tennant PW, Bell R, Rankin J. Maternal overweight and obesity and the risk of congenital anomalies: a systematic review and meta-analysis. JAMA.
2009;301(6):636-50. [Crossref] [PubMed]
19. Persson M, Johansson S, Villamor E, Cnat-tingius S. Maternal overweight and obesity and risks of severe birth-asphyxia-related complications in term infants: a population-based cohort study in Sweden. PLoS Med. 2014;11(5):e1001648. [Crossref] [PubMed] [PMC]
20. Aune D, Saugstad OD, Henriksen T, Tonstad S. Maternal body mass index and the risk of fetal death, stillbirth, and infant death: a sys-tematic review and meta-analysis. JAMA. 2014;311(15):1536-46. [Crossref] [PubMed]
21. Lu GC, Rouse DJ, DuBard M, Cliver S, Kim-berlin D, Hauth JC. The effect of the increas-ing prevalence of maternal obesity on perinatal morbidity. Am J Obstet Gynecol. 2001;185(4):845-9. [Crossref] [PubMed]
22. Aviram A, Yogev Y, Bardin R, Hiersch L, Wiz-nitzer A, Hadar E. Association between sono-graphic measurement of fetal head circumference and labor outcome. Int J Gy-necol Obstet. 2016;132(1):72-6. [Crossref] [PubMed]