Coupled Plasmonic Cavities on Moire Surfaces
Sinan Balci&Mustafa Karabiyik&Askin Kocabas&Coskun Kocabas&Atilla Aydinli
Received: 5 May 2010 / Accepted: 11 August 2010 / Published online: 25 August 2010 # Springer Science+Business Media, LLC 2010
Abstract Surface plasmon polariton (SPP) waveguides formed by coupled plasmonic cavities on metallic Moire surfaces have been investigated both experimentally and numerically. The Moire surface, fabricated by interference lithography, contains periodic arrays of one-dimensional cavities. The coupling strength between the cavities has been controlled by changing the periodicities of the Moire surface. The ability to control the coupling strength allows us to tune the dispersion and the group velocity of the plasmonic coupled cavity mode. Reflection measurements and numerical simulation of the array of SPP cavities have shown a coupled resonator type plasmonic waveguide band formation within the band gap. Coupling coefficients of cavities and group velocities of SPPs are calculated for a range of cavity sizes from weakly coupled regime to strongly coupled regime.
Keywords Surface plasmon polariton (SPP) . Plasmonic cavity . Plasmon . Grating . Coupled cavity
Introduction
Surface plasmon polaritons (SPPs) are electromagnetic surface waves propagating along metal-dielectric interface with an
exponentially decaying electric field intensity into both media [1]. SPPs are well known to play a key role in a wide spectrum of science ranging from physics, materials science, and chemistry to biology due to their ability to concentrate, guide, and enhance electromagnetic energy at the nanoscale and at the subwavelength regime [1–13]. In order to excite SPPs on metallic surfaces, the momentum mismatch between the light and the SPP has to be compensated by either a grating or a prism [1]. On periodically textured surfaces, SPP dispersion curve may show a plasmonic band gap where propagation of SPPs is forbidden. Low density of states within the band gap region as well as high density of SPP states at the band edges can lead to many applications. For example, Kitson et al. have shown that the emission properties of the excited dye molecules on metallic gratings can be modified [3, 4]. Enhancement of the efficiency of the light emitting diodes using metal coatings with periodic subwavelength two-dimensional hole arrays [12] is another example of these applications. Recently, a plasmonic nanolaser containing a nanoparticle of a gold core surrounded by a glasslike shell with a dye has been demonstrated [13]. The plasmons are generated on the gold core and they amplify the emission of the dye [13].
SPP cavities are currently the focus of the research area called plasmonics, because of their ability to confine SPPs in a small volume. Plasmonic cavities generate localized SPP states in the band gap region [5–11]. This is similar to the cavity formation in photonic crystals where perfect periodicity of the dielectric system is broken by a local defect leading to local electromagnetic modes within the forbidden band gap [14]. Recently, several groups have demonstrated SPP cavities using various schemes such as metallic distributed Bragg reflectors [11], metallic Moire surfaces [8], biharmonic metallic gratings [9], and a thin metal film spacing sandwiched between two Bragg mirrors
S. Balci (*)
:
M. Karabiyik:
A. Kocabas:
C. Kocabas:
A. AydinliAdvanced Research Laboratory, Turk Telekom Laboratory, Department of Physics, Bilkent University,
Ankara 06800, Turkey e-mail: [email protected] A. Kocabas
FAS Center for Systems Biology, Harvard University, Cambridge, MA 02138, USA
[6,7]. Weeber et al. have shown that SPP propagation on coplanar coupled cavities relies on a hopping mechanism which indicates the localization of electromagnetic fields within the plasmonic cavities [6,7]. Atwater and coworkers have shown that electromagnetic energy can be guided in a coherent fashion via arrays of closely spaced metal nano-particles (acting as virtual SPP cavities) due to the near-field coupling between the metal nanoparticles [15]. Coupling of SPP cavities results in a new type of plasmonic waveguiding mode. The plasmonic coupled cavity wave-guides can be considered to be an analog of coupled resonator optical waveguides (CROW) formulated by Yariv et al. [16]. These types of dielectric-based photonic CROW structures have been studied extensively. The dispersion profile of CROW structures have been studied using tight binding formalism. Ability to control the local defects in photonic crystals provides means to fabricate these types of photonic coupled cavity structures.
The aim of this study is to investigate the characteristics of coupled SPP cavities fabricated on a Moire surface and the formation of CROW type plasmonic waveguide structures. Although the coupling of photonic (dielectric) cavities have been studied extensively, CROW type plasmonic waveguide structures in particular has not been studied in detail, owing to the high metallic losses and technical challenges associated with the fabrication and characterization of plasmonic cavities. Moire surfaces allow us to study the coupled SPP cavities in a controllable fashion.
Experiment
The SPP cavities have been fabricated on Moire surfaces using the interference lithography (IL) technique. The Moire surfaces were fabricated on a 170-μm thick transparent glass substrate which was coated with a photosensitive polymer AZ 1505. A collimated He–Cd laser beam of 325 nm wavelength was used to form interference fringes onto the photoresist layer spun on a glass substrate. Sequential exposures at slightly different illumination angles generate a Moire surface on the photoresist layer. Super periodicity representing the size of the SPP cavities on Moire surfaces can be altered by changing the periodicities of the superimposed uniform gratings. After chemically developing the photosensitive polymeric surface in a solution of AZ 400 K (developer), the surface was coated with a 50-nm thick Ag film by using thermal evaporation system. The reflectivity measurements performed as a function of the incidence angle and wavelength were obtained using a rotating analyzer spectroscopic ellipsometer-WVASE32 (J. A. Woolam Co., Inc., USA) in the visible spectrum in the TM mode. Measurements in TE mode did not yield SPP coupling [8].
To compensate for the momentum mismatch between the incoming light and excited plasmon on silver–air interface, well-known Kretschmann configuration has been used [1]. Kretschmann configuration was established by attaching the glass sample containing the Moire surface onto a prism (Thorlabs, right angle, IBK7) using index matching fluid (Nye, OCF-463) to virtually eliminate the reflection losses associated with the prism–glass interface. The band structure of Moire surfaces has been constructed from the two-dimensional reflectivity maps. Moire surfaces fabricat-ed on glass substrates were illuminatfabricat-ed with a collimatfabricat-ed beam with a radius of around 1 mm from the prism side. The wavelength-dependent reflectivity measurements were performed with different incidence angles from which two-dimensional reflectivity maps or dispersion curves of Moire surfaces were generated. Dispersion curves of SPP cavities have been generated using the reflectivity data obtained on a spectroscopic ellipsometer configured as a reflectometer. Finite set of measurements were interpolated using linear interpolation algorithm with MATLAB software.
Experimentally, the cavity-to-cavity distance of SPP cavities are varied from 2.5 to 9.0 μm by tuning the periodicity of superimposed gratings. Since the spot size of the incident collimated beam of the ellipsometer is around 1 mm, we measure the dispersion curve of a large numbers of coupled SPP cavities at the same time. We use two-dimensional finite difference time domain (FDTD) techni-ques to simulate the fabricated Moire surfaces. FDTD approach solves the wave equation under Drude approxi-mation for the dielectric constant of the metal. The technique easily demonstrates the formation of a cavity mode as well as coupling of adjacent cavity modes. We performed a systematic study of the cavity-to-cavity coupling as a function of various geometrical parameters. First, we analyzed SPP cavity-to-cavity coupling for different cavity sizes. Starting from a single SPP cavity and then increasing the number of adjacent SPP cavities, the dispersion of finite number of coupled SPP cavities have been calculated. Furthermore, in the limit of an infinite series of coupled SPP cavities (simulated using a periodic boundary condition) the dispersion curves have been calculated. The calculated group velocities and coupling coefficients have been analyzed using a tight binding model. Numerical simulations and experimental dispersion curves of coupled SPP cavities are in agreement and shine significant light on understanding the nature of SPP cavity-to-cavity coupling.
Results and Discussion
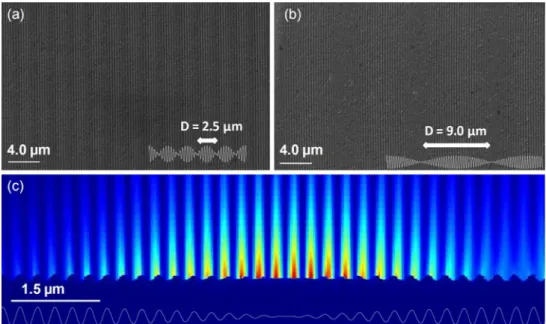
Scanning electron microscopy (SEM) images of Moire surfaces with 2.5-μm and 9.0-μm long SPP cavities are
shown in Fig. 1a and b, respectively. The Moire surfaces are generated by superimposing two uniform periodic structures with slightly different periodicities (Λ1=295 nm
andΛ2=305 nm) [17]. Superimposing two uniform grating
with slightly different periodicities on a single surface adds to produce nodes and antimodes at the beat frequency of interfering periods. The distance between the nodes defines the cavity–cavity separation, as well as the size of SPP cavities. IL allows us to change the size of the cavities on the Moire surfaces on a large scale which is nearly unattainable with other lithographic techniques. The ampli-tude of the Moire surface gradually approaches to zero in the vicinity of the nodes where the cavity is located. Theπ phase shifts at the nodes of the Moire surface leads to the localization of SPPs, Fig.1c. The Moire surface profile can be expressed using the following formula:
SðxÞ ¼ cosðGxÞsinðgxÞ ð1Þ
Where g = 2π/d = 2π(Λ1+Λ2)/(2Λ1Λ2), G = 2π/2D =
2π(Λ1−Λ2)/(2Λ1Λ2), d, D are the uniform periodicity and
the periodicity of the superstructure (periodicity of the envelope function) or the size of the cavity, respectively.Λ1
and Λ2 are the periods of the superimposed uniform
gratings. It should be noted that the surface profile function of the Moire surface is an odd function and thus the structure is not symmetric at its nodes. Propagating SPPs experience aπ phase shift at the nodes of the Moire surface leading to a standing wave, hence SPPs can be localized around the nodes of the Moire surface, Fig.1c. Previously, we have experimentally shown that Moire surfaces act as cavities and localize SPPs. The group velocity of the localized plasmons is almost zero at the band edges of the
plasmonic band gap therefore these surfaces are good candidates for slowing down surface plasmons [8].
Figure 2a shows the dispersion curve of SPPs on corrugated silver surface (a uniform silver grating). When the flat metal surface is corrugated with a uniform grating at the length scale of about half the wavelength of the incident light, a plasmonic band gap is introduced into the dispersion curve of the SPP. The band gap is clearly seen in Fig.2awhere there is a range of wavelengths for which propagation of SPP is prohibited [3, 4]. When the SPP wave vector equals to half of the Bragg vector of the grating, the Bragg reflection of the SPP mode may occur. The Bragg reflection results in the transformation of propagating SPP modes into standing waves. Just as for electron waves in crystalline solids, there are two standing wave solutions due to the geometric structure of the uniform grating [3, 4]. One solution has field extrema at the grating troughs and the other solution has field extrema at the grating peaks. These standing waves have the same wave vector but because of their different field and surface charge distributions, they have different wavelengths. This leads to the opening up of a band gap for the SPP modes between these two wavelengths. As it is crystal clear in Fig. 2a, for the entire range of incident angles, the density of the SPP modes is low in the band gap region [3, 4]. However, at the band edges the density of the SPP states is very large.
Figure2b–dshow the experimental dispersion curves of Moire surfaces with cavity sizes of 9.0, 4.5, and 2.5 μm, respectively. On Moire surfaces, the cavity sizes can be controlled by changing the superperiodicity of the surface [8]. Cavity size can be calculated by using the following formula: D=(Λ2Λ1)/(Λ1−Λ2). The distance between the
cavities (D) depends on the difference between the
Fig. 1 Scanning electron microscopy images of coupled SPP cavities on Moire surfaces. SEM images of adjacent SPP cavities on metallic Moire surface separated by 2.5μm (a) and 9.0μm (b). In both of the images, the amplitudes of the Moire surfaces approach to zero in the vicinity of the nodes. c FDTD-calculated 2D electric field distribution in a 9.0-μm long SPP cavity at the cavity wavelength indicating the localization of the cavity mode
periodicities (Λ1 and Λ2) of the superimposed uniform
gratings. In Fig.2b, periodicities (295 and 305 nm) of the superimposed uniform gratings are closer to each other than the one (280 and 320 nm) shown in Fig.2d. In Fig.2b, the SPP cavity is around 9.0 μm long. A very narrow SPP cavity mode indicates that SPP is well localized inside the band gap region. In the reflection measurements, the spot size of the incident collimated beam is around 1 mm covering large number of cavities. Therefore, the SPP dispersion curve in Fig. 2b can be assumed to belong to large number of coupled SPP cavities. As the size of the SPP cavity decreases, the width of the new plasmonic waveguide band increases owing to the formation of CROW type plasmonic waveguide band within the band gap region [6,7,16].
Having observed the plasmonic cavity formation and cavity-to-cavity coupling on the metallic Moire surfaces, now we would like to discuss the results of numerical simulations of the fabricated surfaces. To obtain the characteristics of SPP cavity-to-cavity coupling, we employ two-dimensional FDTD techniques using com-mercial software (Lumerical). Mesh, 5.0 nm size, is used for uniform meshing area and l/10 mesh size is used for nonuniform meshing area. A mode source is employed between metal (silver) and dielectric (air) interface. The refractive index of the background is taken 1.0 (air) and the value of dielectric function for silver is taken from
Palik [18], Fig. 3a. In order to understand SPP cavity– cavity coupling, we firstly simulated the response of a single SPP cavity. It should be noted that coherent nature of the IL process produces large number of cavities on the sample dictates that cavity size and cavity-to-cavity separation is inherently linked. By changing the periodic-ity of the Moire surface, we also change the size of the SPP cavities on Moire surfaces [8]. When a single SPP cavity on the Moire surface is simulated, the reflection spectrum shows a single SPP cavity mode within the band gap region, Fig. 3b (see blue line therein). We repeat the same simulation for the entire cavity sizes investigated. As expected, a single SPP cavity (without an adjacent cavity) exhibits only a single cavity mode within the band gap region.
When we introduce a second identical cavity in the simulation area, splitting of the cavity mode into two modes is observed, see Fig. 3b (green line). When we continue increasing the number of adjacent SPP cavities, further splitting of the cavity mode is observed. The coupling between the adjacent cavities leads to a spectral splitting according to the number of coupled modes, which eventually forms a plasmonic miniband as is already visible for seven coupled SPP cavities.
On the other hand, when we use 9.0-μm long cavity, the energy splitting of the cavity mode has not been observed even when the number of adjacent identical
Fig. 2 Experimental dispersion curves of SPPs on a uniform grating and Moire surfaces obtained by the prism coupling technique. a When the surface of the metal is textured with a uniform grating at a length scale of about half the wavelength of incoming light, a band gap is introduced into the dispersion curve of the associated SPP mode. The band gap is clearly seen where there is a spectral region in which no SPP modes are available (forbidden band gap region). Blue-colored regions show the SPP coupled modes in the picture. Color map shows the normalized reflectiv-ity of the samples. Experimental dispersion curves of SPP coupled cavities for different D values (cavity size) of 9.0, 4.5, and 2.5μm on Moire surfaces b, c, and d, respectively. Increased coupling between the cavities leads to the appearance of a CROW type plasmonic wave-guide band in the band gap region
cavities has been increased. Instead of formation of a plasmonic miniband in the band gap region as in the case of 2.5-μm long cavity, 9.0-μm long cavities form a single cavity peak and do not show spectral splitting due to very weak coupling between the neighboring identical cavities. Figure 3c shows the results for 2.5 and 9.0-μm long SPP cavities on Moire surfaces. The green triangle shows the central peak position of the latter cavity mode whereas the red circle indicates central peak position of former SPP cavity modes when the number of adjacent cavities are increased from a single cavity to seven adjacent cavities. As can be easily understood from Fig.3c, the spectral splitting of SPP cavity modes depends on the cavity separation, see Fig.3d. Spectral splitting of cavity modes for two identical SPP cavities decreases when the cavity size increases.
In order to characterize plasmonic waveguide band formation we have extended the two-dimensional FDTD simulations to obtain the complete dispersion diagram of infinite series of coupled SPP cavities on the Moire surfaces. In these simulations, Bloch boundary condition and monochromatic incident light were used, see Fig. 4c for details. Figure4a and bshow the simulated dispersion curves of SPPs on Moire surfaces with a superperiodicity of 2.5 and 11.3 μm, respectively. These dispersion diagrams given in Fig. 4a and b illustrate the strongly coupled and weakly coupled regimes. The numerical simulation in Fig. 4a clearly shows generation of a wide plasmonic waveguide band. These results show CROW type behavior and agree well with the experimental results given in Fig. 2d [16]. The origin of this plasmonic waveguide band formation is shown in Fig. 3b, which
Fig. 3 FDTD simulation of plasmonic coupled cavities on Moire surfaces with varying the size of the cavity. a Schematic representation of FDTD numerical simulation of a SPP cavity. A mode source is used between the silver surface and air. A reflection monitor records the reflected SPP from the cavity structure. b Calculated reflection spectra of one, two, three, and seven SPP cavities with a cavity size of 2.5 μm. This is similar to the CROW type dispersion of coupled photonic cavities. The coupling between several SPP cavities leads to a splitting of cavity modes and eventually the formation of a plasmonic miniband. The numbers indicate the number of coupled SPP cavities. c Plot of central wavelength of coupled SPP cavity modes versus the number of coupled SPP cavities for cavity sizes of
2.5 and 9.0μm. Green and red dots show the position of the central wavelength of cavity modes for cavity sizes of 9.0 and 2.5 μm, respectively. For 2.5-μm long cavity, as the number of adjacent cavities increases splitting of the cavity mode can be seen due to coupling of adjacent cavities. After five or more adjacent cavities, coupling of 2.5-μm long cavities leads to the formation of a plasmonic miniband instead of a single cavity peak. In contrast, 9.0-μm long cavities do not show splitting of the cavity mode since they are weakly coupled with the neighboring cavities. d Plot of central wavelength of two coupled cavities versus the cavity size. Spectral splitting of two adjacent cavities decreases as the size of the cavities increases. The drawn lines in (c) and (d) are only to guide the eye on the figures
compares reflection spectra for finite number of coupled cavities. In the limit of an infinite series of coupled SPP cavities, the discrete plasmonic modes shown in Fig. 3b (blue line for seven coupled SPP cavities) becomes a continuum. The width of the plasmonic CROW band is round 50 nm which is comparable to the experimental one shown in Fig.2d. Figure 4dshows the wavelength of the cavity mode as a function of the incidence angle.
The FDTD simulation was further performed for SPP cavities with very large cavity sizes of around 19.0 μm. As the size of the SPP cavity increases the width of the plasmonic waveguide band decreases. When the cavity size is increased beyond around 11 μm the plasmonic band width reaches nearly a constant value. Using tight binding formalism, we can estimate the coupling coeffi-cient κ=Δω/2Ω, where Δω, and Ω are the plasmonic
Fig. 4 FDTD-simulated dispersion curves of SPPs on Moire surfaces with varying cavity sizes. a FDTD-simulated dispersion curves of infinite series of coupled SPP cavities for cavity sizes of 2.5μm, b 11.3μm on Moire surfaces. Increasing the size of SPP cavities leads to the decrease of CROW type plasmonic waveguide band width. The blue-colored regions correspond to the incident light coupled to SPP and red-colored regions correspond to the incident light highly reflected from the sample. c Schematic representation of FDTD numerical simulation of large number of SPP cavities. Theoretical dispersion curves have been generated in this configuration. A monochromatic source and periodic boundary condition have been
used. A reflection monitor records the reflected SPP from the cavity structure. d Dispersion curve of plasmonic waveguide mode on Moire surfaces with different cavity sizes indicating CROW type dispersion. The waveguide band position for cavity sizes between 2.5 and 19μm is tracked and plotted here. The inset in the figure shows the coupling coefficients calculated from the width of the plasmonic CROW bands by using tight binding approach. e The group velocities are calculated from the dispersion of plasmonic CROW bands in (d) for different cavity lengths. The inset in the figure shows the calculated group velocities as a function of wave vector. f Plot of the quality factors of cavity modes as a function of the cavity size
CROW band width, and the resonance frequency of individual cavity, respectively. In our previous work we have calculated the coupling coefficient of a similar structure with a cavity size of 9.0μm [8]. Using the same approach, we have studied the coupling coefficient of the SPP cavities as a function of cavity size. Figure4 shows the calculated coupling coefficient. The calculated cou-pling coefficient monotonically decreases as the SPP cavity size increases. When the cavity size exceeds around 11 μm in the inset, the coupling coefficient reaches a constant value. The group velocity of plasmonic wave-guide band can also be calculated as vg= dw/dk by using
tight binding approach. Figure4e indicates the calculated group velocities of SPP for each SPP cavity lengths. The group velocity vanishes at the edges of the plasmonic waveguide band. As the cavity size or the separation between the cavities increases, the group velocity decreases and approaches to a relatively constant value of around 0.12c. Recently, Kocabas et al. have experi-mentally shown group velocities of 0.44c on Moire surfaces with cavity sizes of 9.0μm which is comparable to our calculations with group velocity of 0.40c within the cavity for 9.0-μm long SPP cavity [8]. Reducing the coupling coefficient between the SPP cavities increases the time it takes for the SPP to go from one cavity to adjacent one. Increasing the size of the SPP cavity increases the optical path for SPP on Moire surface. Doing the both of the two operations at the same time prolongs the SPPs spending time in each SPP cavity which results in a slower propagation velocity of SPPs. Therefore, it is clear from numerical simulations and the tight binding calculations that for SPP cavity separation larger than around 11μm, SPP cavity-to-cavity coupling becomes constant and quite weak. Slowing down electro-magnetic radiation is very important for applications such as enhancing nonlinear processes and improving optical conversion efficiencies. For example, in stimulated emis-sion applications, the effective gain can be increased by slowing down the electromagnetic wave since the effec-tive gain is inversely proportional to the group velocity (1/vg) [19]. Previously, by using a graded grating
struc-ture, different wavelengths were trapped at different positions on the graded grating structure [20]. Therefore, multiwavelengths can be simultaneously slowed down in a single structure over a broad range of wavelengths called the“trapped rainbow” storage of light [20]. Since the size and grating depth of the plasmonic cavities on Moire surface are constant as a function of position only the single wavelength corresponding to the cavity mode can be slowed down. Multiwavelengths can only be slowed down on Moire surface if the size and grating depth of the cavities on Moire surface are linearly tuned as a function of position. As the propagation length on flat metals can
be as high as 100 μm [21], over ten cavities may couple for cavity lengths of 11μm.
The quality factor Q of a cavity defines the rate of energy loss relative to the stored energy inside the cavity. For coupled cavities we define an equivalent Q factor which is calculated from the center frequency divided by the full width at half maximum of the peak. It is important to see how Q factor of the plasmonic cavities scales with various cavity parameters. We studied the Q factor as a function of cavity length and find that the Q factor of the SPP cavities on Moire surfaces increases as the SPP cavity size increases. For cavity sizes of 2.5 and 9.0 μm, the Q factors of approximately 30 and 100 were found, respec-tively, Fig. 4f. The numerical simulations agree quite well with the experimental findings as also indicated in Fig.4f. Currently, we are not clear on why the experimentally deduced Q factors are larger than the theoretically calcu-lated ones but it might be due to the difference between assumed effective dielectric function of the metal in the calculations and that is actual in the experiment. As the SPP cavity size decreases, the coupling of SPP cavities increases and hence CROW type waveguiding band width increases resulting in very low Q factors. On the contrary, when the SPP cavity size is increased the coupling of SPP cavities decreases and hence the width of the CROW band decreases leading to higher Q factors. The value of the quality factor is relatively high for large SPP cavities due to the suppression of radiative losses and weak cavity-to-cavity coupling on the smoothly varying profile of the metallic Moire surfaces [8]. Efforts are underway to further increase the Q factor on Morie surfaces by replacing the dielectric (air) on the Moire surface with materials of higher dielectric constants. Increasing the Q factors of the plasmonic cavities will allow us to decrease the lasing threshold of a plasmonic laser [13].
Conclusion
Large area metallic Moire surfaces fabricated by the interference lithography technique, provides a flexible platform to study the physics of plasmonic cavities. In this work, we have analyzed SPP cavity-to-cavity coupling on the metallic Moire surfaces. For large number of adjacent SPP cavities, the reflection measurements and the numer-ical simulations have shown a CROW type plasmonic waveguide band formation within the band gap. When the SPP cavity size is sufficiently small, the numerical simulations indicate splitting of strongly coupled plasmonic cavity modes. This splitting of SPP cavity modes can be explained with a tight binding approximation used both in solid state physics and in photonic coupled cavities. When the SPP cavity size is sufficiently large, we have shown that
SPP cavity modes are localized and do not show splitting of cavity modes. Theoretically calculated dispersion curves of infinite series of coupled SPP cavities for different cavity sizes reproduced the corresponding experimental dispersion curves for each cavity sizes. The width of the plasmonic waveguiding band inside the band gap increased as the size of the SPP cavity decreased. Coupling strength or coupling coefficients of the cavities which have been calculated by using tight binding method increase as the size of the cavities decreases. By using the same approach, the group velocities of SPP have been calculated and group velocity of around 0.12c has been calculated for very large SPP cavities. Furthermore, the quality factor of the SPP cavities on Moire surfaces increases when the SPP cavity size increases. The ability to control the dispersion diagram and together with ease fabrication of the cavities could have a significant impact for nonlinear plasmonic applications, surface enhanced Raman spectroscopy and fluorescence spectroscopy applications, as well as in the demonstration of plasmonic lasers.
Acknowledgment S. Balci would like to acknowledge financial support of TUBITAK through a BİDEB grant. We thank Seckin Senlik for technical help. This work has been supported in part by a grant from TUBITAK (grant no. 104M421) and by EU 7th framework project, Unam-Regpot (grant no. 203953).
References
1. Raether H (1986) Surface plasmons. Springer, Berlin
2. Ebbesen TW, Lezec HJ, Ghaemi HF, Thio T, Wolff PA (1998) Extraordinary optical transmission through sub-wavelength hole arrays. Nature 391:667–669
3. Kitson SC, Barnes WL, Sambles JR (1999) Full photonic band gap for surface modes in the visible. Phys Rev Lett 77:2670–2673 4. Kitson SC, Barnes WL, Sambles JR (1995) Surface-plasmon energy
gaps and photoluminescence. Phys Rev B 52:11441–11445 5. Perney NMB, Abajo FLG, Baumberg JJ, Tang A, Netti MC,
Charlton MDB, Zoorob ME (2007) Tuning plasmon cavities for
optimized surface-enhanced Raman scattering. Phys Rev B 76:035426-1-5
6. Weeber JC, Bouhelier A, Francs GC, Massenot S, Grandidier J, Markey L, Dereux A (2008) Surface-plasmon hopping along coupled coplanar cavities. Phys Rev B 76:113405-1-4
7. Weeber JC, Bouhelier A, Francs GC, Markey L, Dereux A (2007) Submicrometer in-plane integrated surface plasmon cavities. Nano Lett 7:1352–1359
8. Kocabas A, Senlik SS, Aydinli A (2009) Slowing down surface plasmons on a Moire surface. Phys Rev Lett 102:063901–063904 9. Kocabas A, Senlik SS, Aydinli A (2009) Plasmonic band gap
cavities on biharmonic gratings. Phys Rev B 77:195130-1-7 10. Senlik SS, Kocabas A, Aydinli A (2009) Grating based plasmonic
band gap cavities. Opt Express 17:15541–15549
11. Gong Y, Vuckovic J (2007) Design of plasmon cavities for solid-state cavity electrodynamics applications. App Phys Lett 90:033113-1-3
12. Liu C, Kamaev V, Vardeny ZV (2005) Efficiency enhance-ment of an organic light-emitting diode with a cathode forming two-dimensional periodic hole array. App Phys Lett 86:143501-1-3
13. Noginov MA, Zhu G, Belgrave AM, Bakker R, Shalaev VM, Narimanov EE, Stout S, Herz E, Suteewong T, Wiesner U (2009) Demonstration of a spaser-based nanolaser. Nature 460:1110– 1112
14. Yablonovitch E, Gmitter TJ, Meade RD, Rappe AM, Brommer KD, Joannopoulos JD (1991) Donor and acceptor modes in photonic band structure. Phys Rev Lett 67:3380–3383
15. Maier SA, Brongersma ML, Kik PG, Meltzer S, Requicha AAG, Atwater HA (2001) Plasmonics—a route to nanoscale optical devices. Adv Mater 13:1501–1505
16. Yariv A, Xu Y, Lee RK, Scherer A (1999) Coupled-resonator optical waveguide: a proposal and analysis. Opt Lett 24:711–713 17. Khurgin JB (2000) Light slowing down in Moire fiber gratings and its implications for nonlinear optics. Phys Rev A 62:013821– 013824
18. Palik ED (1985) Handbook of optical constants of solids. Acedemic, Orlando
19. Sakoda K (1999) Enhanced light amplification due to group-velocity anomaly peculiar to two- and three-dimensional photonic crystals. Opt Express 4:167–176
20. Gan Q, Yujie JD, Bartoli FJ (2009) “Rainbow” trapping and releasing at telecommunication wavelengths. Phys Rev Lett 102:056801–056804
21. Barnes WL (2006) Surface plasmon-polariton length scales: a route to sub-wavelength optics. J Opt A: Pure Appl Opt 8:S87– S93