for either MVK
V377I/1or MVK
H20N/1). We have previously shown
that protein prenylation is defective in PBMCs from this patient
but not in either parent.
2Stimulation with LPS and the NLRP3
activator nigericin elicited much greater IL-1b release in cells
from the patient with MKD than from either parent, and this
response was abolished by MCC950 (
Fig 1
, J).
Our observations clearly demonstrate that lack of prenylation
in monocytic cells (using statin treatment, a pharmacologic model
of MKD, or using authentic MKD cells from a patient)
leads to enhanced formation of an NLRP3-dependent and
pyrin-independent
inflammasome
upon
LPS
stimulation.
Although loss of prenylation has been suggested to activate the
pyrin
inflammasome
in
mouse
bone
marrow–derived
macrophages,
4,5it is possible that defective prenylation promotes
activity of distinct inflammasomes in different cell types. In
monocytes, loss of protein prenylation caused by SIM treatment
was alone insufficient for inducing NLRP3 inflammasome
formation or caspase-1 activation (
Fig 1
, B and C) but
substantially boosted LPS-induced inflammasome activity (speck
formation, caspase-1 activation, IL-1b and IL-18 release, and
pyroptosis) on stimulation with LPS (
Fig 1
, B-D, and see
Fig E1
, C). The underlying mechanism remains to be clarified
but did not involve an enhancement of LPS-induced changes in
mRNA levels (see
Fig E2
, A, in this article’s Online Repository
at
www.jacionline.org
) or changes in protein levels (see
Fig E2
,
B) of pro–IL-1b, pro–IL-18, NLRP3, ASC, or pro–caspase-1.
Enhanced inflammasome formation in prenylation-deficient
THP-1 cells also occurred after stimulation with the TLR2 agonist
Pam3CSK4 (
Fig 1
, K), which is consistent with the enhanced
sensitivity of PBMCs from patients with MKD to both TLR2
and TLR4 agonists.
1These findings are of clinical relevance because they
demonstrate that targeting the pyrin inflammasome in isolation
might not be sufficient to resolve all the pathology associated with
MKD. Rather, approaches to overcome the metabolic defect in
the mevalonate pathway and restore normal protein prenylation
could be more effective at preventing broader inflammasome
activation.
We thank Professor Kirill Alexandrov and Dr Zakir Tnimov (University of Queensland) for providing reagents for the Rab prenylation assay and Dr Ryan Chai (Garvan Institute) and Dr Rebecca Coll (University of Queensland) for technical advice.
Oliver P. Skinner, BSca Julie Jurczyluk, BSca Paul J. Baker, PhDb Seth L. Masters, PhDb Alicia G. Rios Wilks, BSca Misaki S. Clearwater, BSca Avril A. B. Robertson, PhD, MChem, GCHEdc Kate Schroder, PhDd Sam Mehr, MBBS, BMedSci, FRCPA, FRACPe Marcia A. Munoz, PhDa* Michael J. Rogers, PhDa* FromaBone Biology, Garvan Institute of Medical Research and St Vincent’s Clinical
School, UNSW Sydney, Sydney, Australia;bthe Inflammation Division, Walter and Eliza Hall Institute of Medical Research, Melbourne, Australia;cthe School of
Chem-istry and Molecular Biosciences anddthe Institute for Molecular Bioscience,
Univer-sity of Queensland, Brisbane, Australia; and ethe Department of Allergy/
Immunology, Royal Children’s Hospital, Melbourne, Australia. E-mail:m.rogers@ garvan.org.au.
*These authors contributed equally to this work as senior authors.
Supported in part by NHMRC project grant APP1139644 (to M.J.R.), a grant from the Allergy and Immunology Foundation of Australasia (to M.A.M. and M.J.R.), Mrs
Janice Gibson and the Ernest Heine Family Foundation, and the Marian & E.H. Flack Trust.
Disclosure of potential conflict of interest: A. A. B. Robertson and K. Schroder are co-inventors on patent applications for NLRP3 inhibitors, which have been licensed to Inflazome, a company headquartered in Dublin, Ireland. Inflazome is developing drugs that target the NLRP3 inflammasome to address unmet clinical needs in inflam-matory disease. K. Schroder served on the Scientific Advisory Board of Inflazome in 2016-2017. The rest of the authors declare that they have no relevant conflicts of interest.
REFERENCES
1.Stoffels M, Jongekrijg J, Remijn T, Kok N, van der Meer JW, Simon A. TLR2/ TLR4-dependent exaggerated cytokine production in hyperimmunoglobulinaemia D and periodic fever syndrome. Rheumatology (Oxford) 2015;54:363-8. 2.Munoz MA, Jurczyluk J, Mehr S, Chai RC, Arts RJW, Sheu A, et al. Defective
protein prenylation is a diagnostic biomarker of mevalonate kinase deficiency. J Allergy Clin Immunol 2017;140:873-5.
3.Mandey SH, Kuijk LM, Frenkel J, Waterham HR. A role for geranylgeranylation in interleukin-1beta secretion. Arthritis Rheum 2006;54:3690-5.
4.Akula MK, Shi M, Jiang Z, Foster CE, Miao D, Li AS, et al. Control of the innate immune response by the mevalonate pathway. Nat Immunol 2016;17:922-9. 5.Park YH, Wood G, Kastner DL, Chae JJ. Pyrin inflammasome activation and RhoA
signaling in the autoinflammatory diseases FMF and HIDS. Nat Immunol 2016;17:914-21. 6.Guo C, Chi Z, Jiang D, Xu T, Yu W, Wang Z, et al. Cholesterol homeostatic regulator SCAP-SREBP2 integrates NLRP3 inflammasome activation and cholesterol biosynthetic signaling in macrophages. Immunity 2018;49:842-56.e7. 7.Jurczyluk J, Munoz MA, Skinner OP, Chai RC, Ali N, Palendira U, et al.
Mevalonate kinase deficiency leads to decreased prenylation of Rab GTPases. Immunol Cell Biol 2016;94:994-9.
8.Baker PJ, Boucher D, Bierschenk D, Tebartz C, Whitney PG, D’Silva DB, et al. NLRP3 inflammasome activation downstream of cytoplasmic LPS recognition by both caspase-4 and caspase-5. Eur J Immunol 2015;45:2918-26.
9.Coll RC, Robertson AA, Chae JJ, Higgins SC, Munoz-Planillo R, Inserra MC, et al. A small-molecule inhibitor of the NLRP3 inflammasome for the treatment of inflammatory diseases. Nat Med 2015;21:248-55.
Available online February 21, 2019. http://dx.doi.org/10.1016/j.jaci.2019.02.013
F-BAR domain only protein 1 (FCHO1)
deficiency is a novel cause of
com-bined immune deficiency in human
subjects
To the Editor:
Clathrin-mediated endocytosis (CME) is the major endocytic
pathway by which eukaryotic cells internalize cell-surface cargo
proteins and extracellular molecules, thereby enabling a broad
range of biological processes, including cell signaling, nutrient
and growth factor uptake, and cell fate and differentiation.
1F-BAR domain only proteins 1 and 2 (FCHO1/FCHO2) are
involved in the maturation of clathrin-coated pit formation.
2Through
the
N-terminal
F-BAR
domain,
they
bind
to
phosphatidylinositol 4,5-biphosphate on the inner side of the
cell membrane, inducing and stabilizing membrane curvature.
3In addition, the FCHO1/FCHO2 C-terminal
m-homology domain
mediates interaction with the epidermal growth factor receptor
substrate 15 and cargo molecules.
3Moreover, the linker region
of FCHO1 acts as an allosteric activator of the adaptor protein 2
complex, enabling recruitment of clathrin to the assembling
coat.
4,5Here we report 5 patients (P1-P5) from unrelated families of
Italian (P1), Turkish (P2, P3, and P5) and Algerian (P4) origin
(
Fig 1
, A) with biallelic FCHO1 mutations and combined
immunodeficiency, manifesting as recurrent and severe infections
J ALLERGY CLIN IMMUNOLVOLUME 143, NUMBER 6
J ALLERGY CLIN IMMUNOL JUNE 2019 2318 LETTERS TO THE EDITOR
of bacterial, mycobacterial, viral, and fungal origin and profound
T-cell lymphopenia (
Table I
and see
Fig E1
and the
Methods
section in this article’s Online Repository at
www.jacionline.
org
). P3 had EBV-negative diffuse large B-cell lymphoma. Three
patients (P3-P5) died in childhood, whereas P1 and P2 are alive
with full donor chimerism after allogeneic hematopoietic stem
cell transplantation (HSCT) and have cleared pretransplantation
infections. Whole-exome sequencing (P1, P2, P4, and P5) and
targeted sequencing of a large panel of primary immune
deficiency–related genes (P3) identified biallelic private FCHO1
mutations, which were subsequently confirmed by means of
Sanger sequencing (
Fig 1
, B, and see
Fig E2
,
Table E1
, and the
Methods
section
in
this
article’s
Online
Repository
at
www.jacionline.org
).
Patients P2, P3, and P4 carried homozygous frameshift
mutations predicted to cause premature termination. Western
blotting
analysis
of
HA-
or
FLAG-tagged
FCHO1
constructs
showed
expression
of
truncated
products
corresponding to P2 and P3, whereas no protein was detected
for P4 (
Fig 1
, C).
P1 was homozygous for a splice-site mutation (c.120-1G
>C) at
the acceptor splice site of intron 5, which was predicted to result
in exon 6 skipping. Because no pre-HSCT specimens were
available, we performed RT-PCR analysis in PBMCs from
her parents, who are both heterozygous for the mutation.
Amplification with primers in exons 4 and 9 identified 2 bands
in P1’s parents; cloning and sequencing confirmed that the lower
band corresponds to a product lacking exon 6 (
Fig 1
, D). This
FIG 1. A, Pedigrees of patients (P1-P5) with FCHO1 mutations. B, Schematic representation of FCHO1 protein and predicted effects of mutations on protein structure. Gray boxes represent spurious amino acid sequences downstream of frameshift mutations. Dashed lines in P5 indicate undefined effects of the splice-site mutation downstream of Trp9. AP-2, Adaptor protein 2;mHD, m-homology domain. C, Western blot of protein lysates from 293T cell lines transfected with plasmids encoding HA-tagged (P2 and P3) or FLAG-tagged (P4) WT or mutant FCHO1 cDNA. b-Actin served as a protein-loading control. D, Top, RT-PCR amplification of partial (exons 4-9) FCHO1 transcript in PBMCs from a healthy control subject and from P1’s father and mother. Bottom, Schematic representation of effects at the transcript level, as predicted on cloning and sequencing of the 614-bp (top) and 539-bp (bottom) products, respectively. E, Left, Fluorescence-activated cell sorting (FACS)–based cell-cycle analysis on T-cell activation through CD3 and CD28 for 72 hours in P2 and 2 healthy control subjects. Staining with propidium iodide (PI) marks hy-podiploid (hypod.) cells, as well as cells in the G0/G1, S, and G2/M phases of the cell cycle. Right, Proportion of PBMCs that were hypodiploid or in various phases of the cell cycle. F, Left, FACS analysis of the kinetics (t5 0 and 30 minutes) of transferrin internalization in T cells from 2 healthy control subjects and P2 on stim-ulation with anti-CD3 plus Protein A for 48 hours (top) and 72 hours (bottom). Right, Graphic representation of biotinylated transferrin present on the cell surface at time point t5 30 minutes relative to t 5 0 minutes.
=
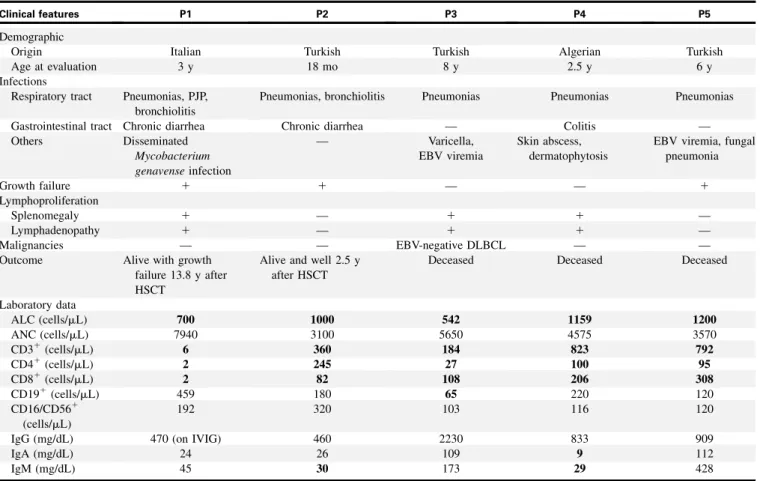
TABLE I. Clinical and laboratory features of FCHO1-mutated patients
Clinical features P1 P2 P3 P4 P5
Demographic
Origin Italian Turkish Turkish Algerian Turkish
Age at evaluation 3 y 18 mo 8 y 2.5 y 6 y
Infections
Respiratory tract Pneumonias, PJP, bronchiolitis
Pneumonias, bronchiolitis Pneumonias Pneumonias Pneumonias
Gastrointestinal tract Chronic diarrhea Chronic diarrhea — Colitis —
Others Disseminated Mycobacterium genavense infection — Varicella, EBV viremia Skin abscess, dermatophytosis
EBV viremia, fungal pneumonia Growth failure 1 1 — — 1 Lymphoproliferation Splenomegaly 1 — 1 1 — Lymphadenopathy 1 — 1 1 — Malignancies — — EBV-negative DLBCL — —
Outcome Alive with growth
failure 13.8 y after HSCT
Alive and well 2.5 y after HSCT
Deceased Deceased Deceased
Laboratory data ALC (cells/mL) 700 1000 542 1159 1200 ANC (cells/mL) 7940 3100 5650 4575 3570 CD31(cells/mL) 6 360 184 823 792 CD41(cells/mL) 2 245 27 100 95 CD81(cells/mL) 2 82 108 206 308 CD191(cells/mL) 459 180 65 220 120 CD16/CD561 (cells/mL) 192 320 103 116 120
IgG (mg/dL) 470 (on IVIG) 460 2230 833 909
IgA (mg/dL) 24 26 109 9 112
IgM (mg/dL) 45 30 173 29 428
ALC, Absolute lymphocyte count; ANC, absolute neutrophil count; DLBCL, diffuse large B-cell lymphoma; GI, gastrointestinal; IVIG, intravenous immunoglobulins; PJP, Pneumocystis jirovecii pneumonia. Abnormal values are shown in boldface.
J ALLERGY CLIN IMMUNOL VOLUME 143, NUMBER 6
abnormal splicing is predicted to cause an in-frame, internally
truncated FCHO1 protein lacking amino acids 41 to 65 within
the F-BAR domain (
Fig 1
, B).
P5 was homozygous for the c.2711G>A mutation, which was
predicted to disrupt the intron 2 donor splice site and the correct
FCHO1 amino acid sequence after Trp9 (
Fig 1
, B). No samples
were available to test the consequences of this mutation at the
cDNA level.
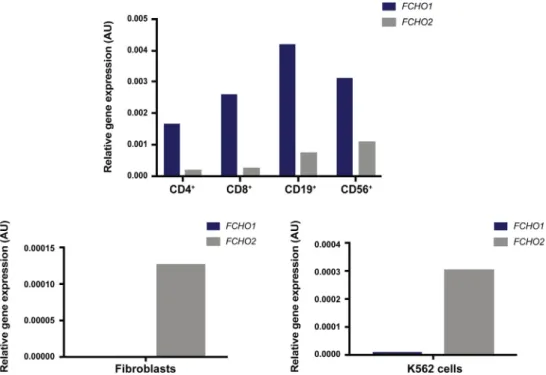
We performed quantitative PCR analysis of FCHO1 and
FCHO2 expression in control CD4
1and CD8
1T cells, CD19
1B cells, CD56
1natural killer cells, fibroblasts, and the K562
erythroleukemic cell line and observed differential expression.
FCHO1 was predominantly expressed in lymphoid cells, whereas
FCHO2 was more abundantly expressed in fibroblasts and
K562 cells (see
Fig E3
in this article’s Online Repository at
www.jacionline.org
).
To clarify the mechanisms underlying the T-cell lymphopenia
observed in the patients, we first analyzed T-cell activation and
proliferation in PBMCs from healthy control subjects and P2, the
only patient from whom pre-HSCT PBMCs were available.
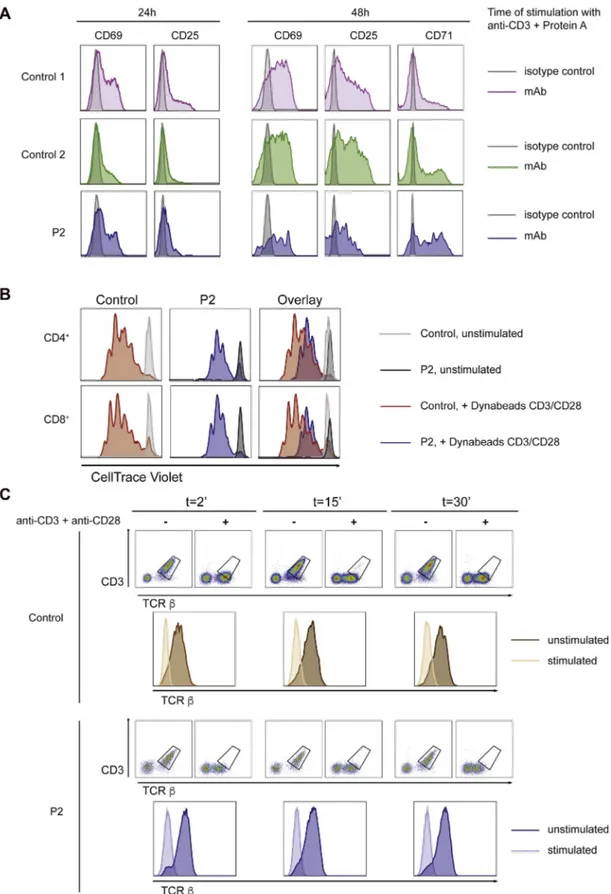
T cells from P2 displayed normal expression of early and late
T-cell activation markers (CD69, CD25, and CD71) but reduced
proliferation on activation through CD3/CD28 (see
Fig E4
, A and
B, in this article’s Online Repository at
www.jacionline.org
). In
particular, T cells from P2 entered only 2 to 4 rounds of cell
division, whereas T cells from control subjects entered 5 to 7
rounds of proliferation. Because each round of division that fails
to occur in the patient results in an exponential loss in T-cell
numbers,
6the reduced number of cell divisions observed in P2
represents a significant proliferation defect. Prior studies have
demonstrated that clathrin-mediated endocytosis is important
for mitosis.
7We found that after activation through CD3/CD28,
PBMCs from P2 showed a high percentage of hypodiploid cells,
a marker of apoptosis, and reduced percentages of cells in the
S and G2/M phases of the cell cycle (
Fig 1
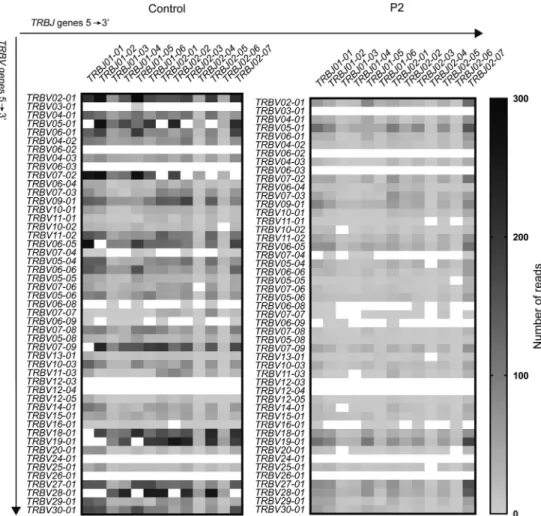
, E). Notably,
no abnormalities of T-cell repertoire diversity, composition, and
clonal abundance were observed in circulating T cells from
P2 (see
Fig E5
in this article’s Online Repository at
www.jacionline.org
). Overall, these results strongly suggest that
defective T-cell proliferation and increased activation-induced
cell death, rather than impaired thymic output, are major
contributors to the T-cell lymphopenia observed in patients with
FCHO1 deficiency.
Finally, to investigate whether FCHO1 mutations affect CME,
we analyzed transferrin internalization, which relies mainly on
clathrin-dependent endocytosis. We previously demonstrated
that a missense mutation in TFRC, which encodes the transferrin
receptor
(TfR),
impairs
transferrin
internalization
and
intracellular iron delivery, causing a combined immunodeficiency
with defective T-cell proliferation.
8TfR expression on the
surfaces of resting PBMCs is minimal but increases at 48 and
72 hours after T-cell receptor (TCR) activation.
8Therefore we
stimulated PBMCs from P2 and control subjects with anti-CD3
and Protein A for 48 and 72 hours. A chase experiment was
then performed by adding biotinylated transferrin, followed by
streptavidin–phycoerythrin (PE), to measure the amount of
biotinylated transferrin remaining on the cell surface after
30 minutes. Although transferrin internalization was readily
observed in control T cells, it was minimally detectable in P2’s
T cells (
Fig 1
, F), which is consistent with previous observations
that disruption of the FCHO1 and FCHO2 genes significantly
affects the rate of TfR internalization but does not completely
abrogate it.
5Along with the different degree of impairment of
T-cell proliferation, these findings distinguish FCHO1 deficiency
from TFRC deficiency. In contrast, TCR/CD3 internalization,
which is clathrin independent,
9was preserved in activated T cells
from P2 (see
Fig E4
, C).
In summary, we have demonstrated that FCHO1 deficiency is a
novel form of combined immunodeficiency with impaired T-cell
proliferation, increased activation-induced T-cell death, and
defective CME.
We thank the Regeneron Genetics Center for DNA sequencing and bioinformatics support leading to the identification of the mutation in Family 2.
Enrica Calzoni, MDa,b* Craig D. Platt, MD, PhDc* Sevgi Keles, MDd Hye Sun Kuehn, PhDe Sarah Beaussant-Cohen, MDc Yu Zhang, PhDa Julia Pazmandi, MScf Gaetana Lanzi, PhDb Francesca Pala, PhDa Azzeddine Tahiat, PhDg,h Hasibe Artac, MDi Raul Jimenez Heredia, MScf Jasmin Dmytrus, MScf Ismail Reisli, MDd Vedat Uygun, MDj Dilara Uygun, MDk Aysen Bingol, MDk Erdem Basaran, MDl Kamel Djenouhat, MD, PhDg,h Nafissa Benhalla, MD, PhDm Chafa Bendahmane, MDn Melike Emiroglu, MDo Tomas Kirchhausen, PhDp Mithun Pasham, MSp Jennifer Jones, BAc Jacqueline G. Wallace, BSPHc Lixin Zheng, MDq Bertrand Boisson, PhDr,s,t Fulvio Porta, MDu Sergio D. Rosenzweig, MD, PhDe Helen Su, MD, PhDa Silvia Giliani, PhDb Michael Lenardo, MDq Raif S. Geha, MDc Kaan Boztug, MDf,v,w,x Janet Chou, MDcà Luigi D. Notarangelo, MDaà Fromathe Laboratory of Clinical Immunology and Microbiology andqthe Laboratory of
Immunology, National Institute of Allergy and Infectious Diseases, National Institutes of Health, Bethesda, Md;b‘‘A. Nocivelli Institute for Molecular Medicine’’,
Department of Molecular and Translational Medicine, University of Brescia, Brescia, Italy;cthe Division of Immunology, Boston Children’s Hospital, Harvard Medical School, Boston, Mass;dthe Division of Pediatric Immunology and Allergy, Meram
Medical Faculty, Necmettin Erbakan University, Konya, Turkey;ethe Immunology Service, Department of Laboratory Medicine, Clinical Center, National Institutes of Health, Bethesda, Md;fthe Ludwig Boltzmann Institute for Rare and Undiagnosed Diseases, Vienna, Austria;gthe Laboratory of Medical Biology, Rouiba Hospital,
Algiers, Algeria;hthe Algiers Faculty of Medicine, University of Algiers 1, Algiers,
Algeria;iPediatric Immunology and Allergy andoPediatric Infectious Diseases,
Selcuk University Medical Faculty, Konya, Turkey;jMedical Park, Antalya Hospital,
Pediatric Bone Marrow Transplantation Unit, Antalya, Turkey;kthe Department of
Immunology-Allergy and lthe Department of Pediatric Pulmonology, Akdeniz
University School of Medicine, Antalya, Turkey;mthe Department of Pediatrics,
J ALLERGY CLIN IMMUNOL JUNE 2019 2320 LETTERS TO THE EDITOR
Beni Messous University Hospital, Algiers, Algeria;nthe Department of Pediatrics, Meftah Hospital, Blida, Algeria;pthe Department of Cell Biology, Harvard Medical
School, and Program in Cellular and Molecular Medicine, Boston Children’s Hospital, Boston, Mass; rSt Giles Laboratory of Human Genetics of Infectious
Diseases, Rockefeller Branch, Rockefeller University, New York, NY;sthe
Labora-tory of Human Genetics of Infectious Diseases, Necker Branch, INSERM U1163, Necker Hospital for Sick Children, Paris, France;tImagine Institute, Paris Descartes
University, Paris, France;uPediatric Onco-Haematology and BMT Unit, Children’s Hospital, ASST Spedali Civili of Brescia, Brescia, Italy;vCeMM Research Centre
for Molecular Medicine of the Austrian Academy of Sciences, Vienna, Austria; andwthe Department of Pediatrics and Adolescent Medicine andxSt Anna Children’s
Hospital and Children’s Cancer Research Institute, Department of Pediatrics, Medical University of Vienna, Vienna, Austria. E-mail:[email protected]. Or:[email protected].
*These authors contributed equally to this work. àThese authors contributed equally to this work.
Supported by the Division of Intramural Research,National Institute of Allergy and In-fectious Diseases, National Institutes of Health, Bethesda, Maryland, and by the ‘‘An-gelo Nocivelli’’ Foundation.
Disclosure of potential conflict of interest: The authors declare that they have no relevant conflicts of interest.
REFERENCES
1.Kaksonen M, Roux A. Mechanisms of clathrin-mediated endocytosis. Nat Rev Mol Cell Biol 2018;19:313-26.
2.Cocucci E, Aguet F, Boulant S, Kirchhausen T. The first five seconds in the life of a clathrin-coated pit. Cell 2012;150:495-507.
3.Henne WM, Boucrot E, Meinecke M, Evergren E, Vallis Y, Mittal R, et al. FCHo proteins are nucleators of clathrin-mediated endocytosis. Science 2010; 328:1281-4.
4.Hollopeter G, Lange JJ, Zhang Y, Vu TN, Gu M, Ailion M, et al. The membrane-associated proteins FCHo and SGIP are allosteric activators of the AP2 clathrin adaptor complex. Elife 2014;3.
5.Umasankar PK, Ma L, Thieman JR, Jha A, Doray B, Watkins SC, et al. A clathrin coat assembly role for the muniscin protein central linker revealed by TALEN-mediated gene editing. Elife 2014;3.
6.Marchingo JM, Kan A, Sutherland RM, Duffy KR, Wellard CJ, Belz GT, et al. Antigen affinity, costimulation, and cytokine inputs sum linearly to amplify T cell expansion. Science 2014;346:1123-7.
7.Boucrot E, Kirchhausen T. Endosomal recycling controls plasma membrane area during mitosis. Proc Natl Acad Sci USA 2007;104:7939-44.
8.Jabara HH, Boyden SE, Chou J, Ramesh N, Massaad MJ, Benson H, et al. A missense mutation in TFRC, encoding transferrin receptor 1, causes combined immunodeficiency. Nat Genet 2016;48:74-8.
9.Compeer EB, Kraus F, Ecker M, Redpath G, Amiezer M, Rother N, et al. A mobile endocytic network connects clathrin-independent receptor endocytosis to recycling and promotes T cell activation. Nat Commun 2018;9:1597.
Available online February 26, 2019. http://dx.doi.org/10.1016/j.jaci.2019.02.014
Gene expression signatures of
circulating human type 1, 2, and
3 innate lymphoid cells
To the Editor:
Innate lymphoid cells (ILCs) are a functionally and
phenotyp-ically heterologous group of small lymphocytes that lack
conventional linage markers but can become potent effector cells
upon appropriate stimulations thereby producing large amounts
of cytokines. Some examples of ILCs include natural killer (NK)
cells, lymphoid tissue-inducer cells, and helper-like ILCs. This
study focuses on the helper-like ILCs.
Helper-like ILCs are currently divided into 3 different subsets
according to their distinct patterns of cytokine production and
master transcription factors, which resemble helper T-cell subsets.
In general, type 1 innate lymphoid cells (ILC1s) resemble T
H1 cells
and have been implicated in immunity against intracellular
pathogens, type 2 innate lymphoid cells (ILC2s) resemble T
H2
cells and have been implicated in immunity against helminths,
and type 3 innate lymphoid cells (ILC3s) resemble T
H17 and
T
H22 cells and have been implicated in immunity against
extracel-lular bacteria. Interestingly, unlike T-helper subsets, recent studies
revealed that ILCs are highly plastic cells that enable them to
respond promptly to environmental changes.
1In addition to being
functionally diverse and interconvertible, the developmental
pathways of ILCs are not well understood. Although gene
expression profiles of ILCs have been studied in tissues, such as
human tonsils,
2only limited information is available on human
circulating ILCs.
3Tissue-resident ILCs could be quite different
from the ILCs in blood. To understand the distinct functions of
the type 1, 2 and 3 ILC subsets, it is necessary to delineate both
the overlapping and unique functional signatures of these cells.
We present here one of the first whole-genome gene expression
studies of the 3 ILC subsets from peripheral blood of healthy
donors. The study was approved by the Cantonal Ethics
Committee of Zurich. This study aims to establish the human
ILC transcriptome reference data set in healthy subjects for
comparison in disease settings, with enhanced utility because in
most clinical situations blood samples but not tissue biopsy
specimens are readily available.
A robust ‘‘2-round sorting’’ procedure was used to obtain
highly pure ILC subsets. In brief, ILC subsets were isolated by
using flow cytometry according to a published protocol by the
Mj€osberg group
2with
minor
modifications:
ILC1s
as
CD45
1Lin
2CD127
1CD161
1CRTH2
2c-Kit
2, ILC2s as CD45
1Lin
2CD127
1CD161
1CRTH2
1c-Kit
2, and ILC3s as CD45
1Lin
2CD127
1CD161
1CRTH2
2c-Kit
1. The purity of ILCs during this
first-round sort was approximately 90% for ILC1s, 94% for
ILC2s, and 58% for ILC3s. The ILCs were then resorted, collecting
1000 cells per subset by using more stringent gating directly into
lysis buffer. Additional sorting experiments confirmed that the final
ILC purity was high (86% to 96%), and more importantly, there
was no detectable contamination of lineage-positive cells after
second sorting (see
Fig E1
in this article’s Online Repository at
www.jacionline.org
). The samples (3 ILC subsets per donor and
6 different male healthy donors aged 25–40 years; ie, 18 samples
in total) were analyzed by using RNA sequencing (RNAseq; raw
data are available at the Gene Expression Omnibus as
GSE112591, token yhmbgicchdkbncv).
A total of 13,297 genes were detected as being expressed.
Principal component analysis revealed 3 clearly distinct clusters
of each ILC subset (
Fig 1
, A), demonstrating significantly distinct
gene expression profiles of ILCs.
The key ILC gene signatures were expressed as expected, such
as high IL7R and KLRB1 expression (encoding CD127 and
CD161, respectively) in all ILC subsets, high PTGDR2 (encoding
CRTH2) and GATA3 (encoding GATA-binding factor 3)
expression in ILC2s, high KIT (encoding c-Kit) and AHR
(encoding Aryl hydrocarbon receptor) expression in ILC3s, and
high EOMES (encoding eomesodermin homolog) expression in
ILC1s (
Fig 1
, B). This provides validation of the cellular identity
for each ILC subset and demonstrates the effectiveness of our
sorting strategy. NCR2 (encoding NKp44) is detected at low
levels across all samples, which is not surprising given that we
sorted for NKp44
2ILC3s.
First, we examined the top 200 most abundantly expressed
genes in each ILC subset.
Fig 1
, C, provides a Venn diagram of
these genes, which are 246 in total, with 194 differentially
J ALLERGY CLIN IMMUNOLVOLUME 143, NUMBER 6
METHODS
Patients
All study participants were recruited after obtaining informed consent, and the study was approved by the institutional review board of the referring institutions (National Institutes of Health protocols 06-I-0015 and 16-I-N139). P1, of Italian origin, was born to first-cousin parents (Fig 1, A) and mani-fested recurrent respiratory and gastrointestinal tract infections since the first months of life. At the age of 3 years, she was admitted for Pneumocystis jir-ovecii pneumonia, diarrhea, and growth failure (weight, 12.9 kg, less than the third percentile; length, 97 cm, less than the third percentile). Laboratory examinations revealed profound lymphopenia (Table I). An abdominal computed tomographic (CT) scan showed diffuse mesenteric lymphadenopa-thy, and a lymph node biopsy specimen grew Mycobacterium genavense. At the age of 3 years and 7 months, the patient received a matched unrelated donor hematopoietic cell transplantation with myeloablative conditioning. The clinical course after transplantation was complicated by chronic graft-versus-host disease, autoimmune hemolytic anemia, and portal hypertension. She is currently alive at 17 years of age, with multilineage full donor chime-rism. Her mycobacterial disease has resolved, but because of intestinal chronic graft-versus-host disease, she remains with low weight (35.9 kg) and height (128 cm).
P2, a boy born to consanguineous parents of Turkish origin (Fig 1, A), had recurrent respiratory tract infections and growth failure (weight, 7.8 kg, les than the third percentile) since 6 months of age. Laboratory investigations vealed T-cell lymphopenia, decreased serum IgM levels, and poor antibody re-sponses (Table I). No thymic shadow was visible at chest radiography, and a chest CT scan demonstrated diffuse bronchiectasis (Fig E1, A). He was initially treated with intravenous immunoglobulin and antimicrobial prophy-laxis and received a matched unrelated donor hematopoietic cell transplanta-tion with myeloablative conditransplanta-tioning at the age of 2.5 years. The posttransplantation course was complicated by engraftment syndrome, which was successfully treated with steroids, and grade II acute graft-versus-host dis-ease. He is currently alive and well, with full donor chimerism at 4 years of age.
His older brother was admitted at 1 year of age with a history recurrent pneumonias, diarrhea, candidiasis, and growth failure (weight, 5 kg, less than the third percentile) since the age of 7 months. Laboratory tests revealed T- and B-cell lymphopenia, hypogammaglobulinemia, and impaired antibody re-sponses, for which he was treated with intravenous immunoglobulin. At the age of 6 years, he had severe pneumonia, Candida species–related sepsis, and vesicular lesions on his back. Despite extensive antibacterial and antifungal therapy, he developed multiorgan failure and died.
P3, a male child born to apparently nonconsanguineous parents from the same small village in Turkey, was admitted at the age of 8 years because of fever and dyspnea. Ultrasound studies revealed diffuse lymphadenopathy, and high levels of EBV viremia (178,000 copies/mL) were demonstrated. During follow-up, both lymphopenia and neutropenia were observed (Table I); a bone marrow biopsy specimen was consistent with hemophagocytic lymphohistio-cytosis. Because of persistent lymphadenopathy, a lymph node biopsy was performed and revealed a diffuse EBV-negative large B-cell lymphoma. His clinical course was complicated by respiratory failure, leading to death.
P4, a female child born to consanguineous parents of Algerian origin, had an older sister with a history of disseminated BCG, chronic diarrhea, and recurrent pneumonias who died from a severe pneumonia resulting in acute respiratory failure. P4 had recurrent pneumonias, chronic diarrhea, skin abscesses, and refractory dermatophytosis at 4 months of age. By 2.5 years of life, she experienced neuromotor regression, with an inability to stand or sit, ataxia, hypermetria, and tremors. Immunologic evaluation at 2.5 years of life was notable for CD41and CD81lymphopenia, reduced IgM and IgA levels, reduced B-cell numbers, and nearly absent memory B cells. She continued to have recurrent pneumonias and died at 4 years of age of respiratory failure.
P5, a female child born to first-cousin parents of Turkish origin, was admitted at 6 years of age with fever, dyspnea, oral thrush, new-onset ataxia and seizures. She had no history of prior recurrent infections. Chest and abdominal CT revealed bilateral areas of consolidation and nodular opacities, as well as hepatic lesions that were identified as granulomas on histologic
analysis. Cultures of bronchoalveolar lavage fluid were positive for Klebsiella pneumoniae. Brain magnetic resonance imaging revealed multiple 1.5-cm nodules in the right cerebellar hemisphere. Laboratory testing at that time was notable for CD41T-cell lymphopenia, increased IgM levels, and EBV viremia (38,000 copies/mL). During this hospitalization, she had worsening respiratory failure accompanied by increasing size of cerebellar lesions despite treatment with meropenem, vancomycin, metronidazole, acyclovir, and amphotericin B. Histologic analysis of the brain lesions revealed angio-centric and angiodestructive lymphoid infiltrate admixed with histiocytes, with atypical CD201lymphoid cells positive for EBV and CD30, which is consistent with a diagnosis of lymphomatoid granulomatosis. She was treated with rituximab and prednisone but died of respiratory failure.
Whole-exome sequencing, targeted sequencing,
and Sanger DNA sequencing
For P1 and P2, genomic DNA samples were isolated from PBMCs by using the DNeasy Blood & Tissue Kit (69506; Qiagen, Hilden, Germany). After quality control, whole-exome sequencing (WES) for family 1 was performed with the VCRome 2.1 capture kit from NimbleGen and sequenced as paired-end 75-bp reads with the Illumina HiSeq 2500 Platform (Illumina, San Diego, Calif). For family 2, WES was performed with the Agilent Human V5 (51MB) Kit (Agilent Technologies, Wagh€ausel-Wiesental, Germany) coupled with paired-end 125-bp reads by using HiSeq 2500. All DNA samples were sequenced so that more than 85% of the bases were covered at 203 or greater. All sequenced DNA reads were mapped to the hg19 human genome reference by using the Burrows-Wheeler Aligner with default parameters. Single nucleotide variant and indel calling were performed by using the Genome Analysis Toolkit (version 3.4; the Broad Institute,
http://www.broadinstitute.org/gatk/).
Variants were then annotated by using VEP and filtered by using GEMINIE1based on autosomal recessive mode of inheritance, a minor allele frequency of less than 0.01 in the ExAC browser, and the nonsynonymous na-ture of variants falling in coding regions or in splice sites. BlacklistedE2nonpathogenic common variants were also filtered out. Variant conservation and functional prediction, gene expression pattern, and available known biological knowledge were used to prioritize the candidate variants to identify the disease causal variant from rare family private variants.
For P3, genomic DNA was enriched with the HaloPlex Target Enrichment System (Agilent Technologies), and targeted sequencing of 500 primary immune deficiency genes and data analysis were performed, as previously described.E3
For patients P4 and P5, genomic DNA was isolated from whole blood by using the Gentera Puregene Cell Kit (Qiagen). Exome capture was performed by using the Agilent SureSelect V5, 51MB (Agilent Technologies). The Illumina HiSeq-2500 (Illumina) was used to perform paired-end sequencing, generating 100 base reads. The average coverage of the exome for P4 and P5 was 973 and 863, respectively. Sequence processing and mapping to the human reference genome assembly GRCh37 was performed with the Burrows-Wheeler Aligner, SAMtools, and Picard Tools. Variants were called by using the Genome Analysis Toolkit.
For all filtered variants, CADD PHRED scores, CADD_MSC, and pLi algorithms were used to assess the in silico predicted pathogenicity. FCHO1 mutations were verified by means of Sanger sequencing in family members, and primer pairs are shown inTable E2.
Quantitative real-time PCR analysis
Normal donor PBMCs were stained and underwent fluorescence-activated cell sorting for surface expression of CD3 (eFluor450 mouse anti-human CD3, catalog #48003742, clone OKT3; Fisher Scientific, Waltham, Mass), CD4 (allophycocyanin [APC]–Cy7 mouse anti-human CD4 antibody, catalog #341095, clone SK3; BD Biosciences, San Jose, Calif), CD8 (PE mouse anti-human CD8 antibody, catalog #301008, clone RPA-T8; BioLegend, San Diego, Calif), CD19 (peridinin-chlorophyll-protein complex/Cy5.5 mouse anti-human CD19 antibody, catalog #302230, clone HIBI19; BioLegend), and J ALLERGY CLIN IMMUNOL
VOLUME 143, NUMBER 6
CD56 (fluorescein isothiocyanate [FITC] mouse anti-human CD56 antibody, catalog #340723, clone NCAM16.2; BD Biosciences), respectively, by using FACSAria. Total RNA was extracted from cells by using the RNeasy Micro Kit (Qiagen), according to the manufacturer’s instructions. For each sample, cDNA was generated from RNA in a total volume of 20 mL by using the qScript cDNA Synthesis Kit (Quantabio, Beverly, Mass). Real-time PCR was performed with TaqMan Fast Advanced Master Mix (Applied Biosystems, Foster City, Calif) and TaqMan probes for human ACTB (Hs99999903_m1), FCHO1 (Hs00322606_m1), and FCHO2 (Hs01564786_m1; all from Thermo Fisher Scientific). Experiments were run on a 7500 Real Time PCR System (Applied Biosystems) with 7500 Real Time PCR software (version 2.3; Life Technologies, Grand Island, NY). Data were analyzed by using the 22DCt method after normalization to the ACTB gene as an endogenous control by us-ing water as a negative control.
In vitro mutagenesis, transfection, and Western
blotting
Targeted mutagenesis for mutations in P2 (c.2023dupG, p.V675Gfs*33) and P3 (c.1304_1305del, p.F436Wfs*7) was performed by using the Phusion Site-Directed Mutagenesis Kit (Thermo Fisher), according to the manufacturer’s instructions. Wild-type (WT) cDNA of the human FCHO1 gene from a pDONR-223 vector (Arizona State University) was introduced in an N-terminal tagged pCMV-HA-N vector (Addgene, Watertown, Mass), and the mutagenic primers FCHO1.P2 and FCHO1.P3 (see sequence below), which were designed by using the Phusion Site-Directed Mutagenesis Kit (Thermo Fisher) instructions, were used. Successful mutagenesis was confirmed my means of plasmid DNA sequencing at Macrogen (Seoul, Korea). One day before transfection, 293T cells were seeded (at 500,000 cells per well in a 6-well plate) in complete Dulbecco modified Eagle medium (DMEM/High Glucose from HyClone [San Angelo, Tex], 10% FBS from Gemini Bio-Products [West Sacramento, Calif], 1% MEM Non-Essential Amino Acid from Corning [Corning NY], and 1% L-glutamine from HyClone). Transfections were carried out with the Lipofectamine 3000 Transfection Kit (Invitrogen, Carlsbad, Calif), according to the manufacturer’s protocol. Cells were transfected with 600 ng of FCHO1 WT, FCHO1.P2, or FCHO1.P3 plasmid DNA. After 24 hours, cells were harvested and used in immunoblotting. 293T transfected cells (106) were lysed with RIPA-NTG buffer (30 mmol/L Tris-Cl, 150 mmol/L NaCl, 1% NP-40, 1% Triton X-100, 10% glycerol, and 13 protease inhibitor) with protease inhibitor cocktail (Halt Protease Inhibitor Single-Use Cocktail 1003; Thermo Scientific) for 30 minutes on ice. Lysates were denaturated by using Bolt LDS Sample Buffer 43 and Bolt Reducing Agent 103 (Life Technologies) at 708C for 15 minutes, loaded on 4-12% Bis-Tris Gel, and separated by using SDS-PAGE. Proteins were transferred to nitrocellulose membrane by using the iBlot 2 System (Invitrogen). Blots were probed overnight with 1:2000 dilutions of rat Anti-HA High Affinity mAb (11867423001; Roche, Mannheim, Germany), and 1:2000 dilution of rabbit anti–b-actin mAb (4967S; Cell Signaling, Danvers, Mass) as a loading control. Bands were revealed by using SuperSignal West Femto kit (Fisher Scientific).
For the mutation c.189dupC (P4), HEK293T cells were transfected with N-terminal FLAG-tagged FCHO1 WT (Genecopoeia, Rockville, Md) or FCHO1.P4 plasmid DNA. The latter was generated by using the QuikChange II XL Site-Directed Mutagenesis Kit (Agilent Technologies) with FCHO1.P4 primers (see sequence below). One day after transfection by using the TransIT-LT1 Transfection Reagent (Mirus Bio, Madison, Wis), cells were lysed in RIPA buffer (Millipore, Burlington, Mass), 50 mmol/L EDTA (Thermo Scientific), and protease inhibitors (Thermo Scientific). Electrophoresis of lysates was performed on 4-12% precast polyacrylamide gels (Invitrogen), followed by immunoblotting with the following antibodies as indicated in figure legends: anti-FLAG (F3165, Sigma-Aldrich, St Louis, Mo) and anti–b-actin (Sigma-Aldrich).
Primers for
in vitro mutagenesis
FCHO1.P2 primer forward, CCACCACCACCTGGTCCTCAGCTTCCG;
FCHO1.P2 primer reverse, GGTCCCGCTGAACACACGCACGATG;
FCHO1.P3 primer forward, GTTCTTGGACACCTGCTCCTCTGACTGC; FCHO1.P3 primer reverse, CTTTGGGCCGCCCCTGGAGTCAGCCTTTG; FCHO1.P4 primer forward, CAGCAACGGGACCCCCCATGGGGAC; and FCHO1.P4 primer reverse GTCCCCATGGGGGGTCCCGTTGCTG.
Analysis of RNA splicing
RNA extracted from PBMCs derived from a healthy donor and from the father and mother of P1 was retrotranscribed with random primers and the ImProm-II Reverse Transcription System (Promega), according to the manufacturer’s instructions. RT-PCR for FCHO1 transcript was performed by using primers (forward, 59TCTCCACAGAGACCATCAGG39; reverse, 59GATGCTGGACTCAGCCCTG39) with an annealing temperature of 648C.
In vitro T-cell activation and proliferation
For analysis of T-cell activation, PBMCs from P2 and 2 healthy control subjects were cultured in 200mL of serum-supplemented RPMI (SH30027.01; GE Healthcare Life Sciences, Fairfield, Conn) in round-bottom 96-well plates with 1 mg/mL anti-CD3 (OKT3, catalog #14-0037-82; eBioscience, San Diego, Calif) and 1mg/mL Protein A (catalog #P6031; Sigma-Aldrich) for 24 and 48 hours. Cells were collected at 24 and 48 hours, washed with serum-supplemented PBS, and stained with Live/Dead (L34959; Invitrogen) staining and fluorochrome-conjugated CD3-PE/Cy7 (317334; BioLegend), TCRab-FITC (555547; BD PharMingen), CD71-APC (17-0719-42; Invitrogen), CD69-BV510 (310936; BioLegend), and CD25-eFluor780 (47-0259-42; Invitrogen) for 15 minutes at 48C (dark). On washing with serum-supplemented PBS, expression of CD69, CD25, and CD71 by CD31cells was analyzed by using flow cytometry (LSRFortessa; BD) and FlowJo soft-ware (version 10.5.2; TreeStar, Ashland, Ore).
For analysis of T-cell proliferation, PBMCs were incubated with the CellTrace violet Cell Proliferation Kit (1 mmol/L; Invitrogen). After 20 minutes, 10 volumes of RPMI/10% FBS were added, and the cells were washed twice with RPMI/10% FBS. A total of 1 X 10⁵cells were seeded into 96-well plates and stimulated with Dynabeads CD3/CD28 (bead/cell ratio of 1:1; Invitrogen) for 4 days. Cells were then stained with fluorochrome-conjugated CD4 and CD8 antibodies (BD Biosciences) for 30 minutes at 48C (dark) and washed twice with PBS twice, and CellTrace Violet expression was analyzed by using flow cytometry (Becton Dickinson FACSCanto II) and FlowJo software (version 10.5.2; TreeStar).
In vitro cell-cycle analysis
Total PBMCs were stimulated with Dynabeads Human T-Activator CD3/CD28 (Thermo Fisher) for 3 days. Cells were washed with PBS, fixed in 66% EtOH for 3 hours at 48C, and then washed twice in PBS 2 times and stained with propidium iodide (50mg/mL) for 30 minutes at 378C in the presence of RNase A (100mg/mL), followed by analysis with flow cytometry.
TCR internalization
PBMCs from P2 and 1 healthy control subject were either left unstimulated or stimulated with 0.5 mg/mL anti-CD3 (OKT3, catalog #14-0037-82; eBioscience) plus 0.5mg/mL anti-CD28 (catalog #302914; BioLegend) in 500mL of serum-supplemented RPMI at 378C for 2, 15, and 30 minutes. At each time point, cells were collected, washed with serum-supplemented PBS, and stained with Live/Dead (L34959; Invitrogen) staining and fluorochrome-conjugated CD3-eFluor450 (48-0037-42; eBioscience) and TCRab-APC (17-9986-42; eBioscience) for 15 minutes at 48C (dark). Cells were washed with serum-supplemented PBS, acquired, and analyzed by using flow cytometry (LSRFortessa; BD) and FlowJo software (version 10.5.2; TreeStar).
Transferrin internalization assay
PBMCs from P2 and 2 healthy control subjects were cultured in 200mL of serum-supplemented RPMI (SH30027.01; GE Healthcare Life Sciences) in round-bottom 96-well plates with 1 mg/mL anti-CD3 (OKT3, catalog J ALLERGY CLIN IMMUNOL JUNE 2019 2321.e2 LETTERS TO THE EDITOR
#14-0037-82; eBioscience) and 1mg/mL Protein A (catalog #P6031; Sigma-Aldrich) at 378C for 48 and 72 hours. At each time point, cells were collected and washed with PBS at 300 relative centrifugal force units for 5 minutes and resuspended in 250mL of RPMI serum-free media with 25 mmol/L HEPES (H3375-100G; Sigma) and 0.5% of BSA (15260-037; Life Technologies). Cells were starved for 30 minutes at 378C, washed once with PBS, resuspended in serum-free RPMI with biotinylated transferrin (T23363; Invitrogen) and 0.5% BSA, and pulsed for 30 minutes at 48C. Medium were then changed to serum-supplemented RPMI, and temperature was shifted to 378C for 0, 10, and 30 minutes to stimulate biotinylated transferrin trafficking. Internalization was stopped by incubating cells on ice and washing with cold PBS, followed by staining and flow cytometry. For the different time point of transferrin internalization, the percentage of surface transferrin expression was calculated as follows:
Median fluorescence intensity ðMFIÞ of surface transferrin at time x MFI of surface transferrin at time 0 minutes 3100:
Cells were the stained with Live/Dead (L34959; Invitrogen) staining and fluorochrome-conjugated CD3-PE/Cy7 (317334; BioLegend), TCRab-FITC (555547; BD PharMingen), and streptavidin-PE (554061; BD Biosciences) antibodies for 15 minutes at 48C (dark) and then washed with serum-supplemented PBS twice analyzed by using flow cytometry (LSRFortessa; BD) and FlowJo software (version 10.5.2; TreeStar).
REFERENCES
E1.Paila U, Chapman BA, Kirchner R, Quinlan AR. GEMINI: integrative exploration of genetic variation and genome annotations. PLoS Comput Biol 2013;9: e1003153.
E2.Maffucci P, Bigio B, Rapaport F, Cobat A, Borghesi A, Lopez M, et al. Blacklist-ing variants common in private cohorts but not in public databases optimizes hu-man exome analysis. Proc Natl Acad Sci U S A 2019;116:950-9.
E3.Erman B, Bilic I, Hirschmugl T, Salzer E, Boztug H, Sanal €O, et al. Investigation of genetic defects in severe combined immunodeficiency patients from Turkey by targeted sequencing. Scand J Immunol 2017;85:227-34.
J ALLERGY CLIN IMMUNOL VOLUME 143, NUMBER 6
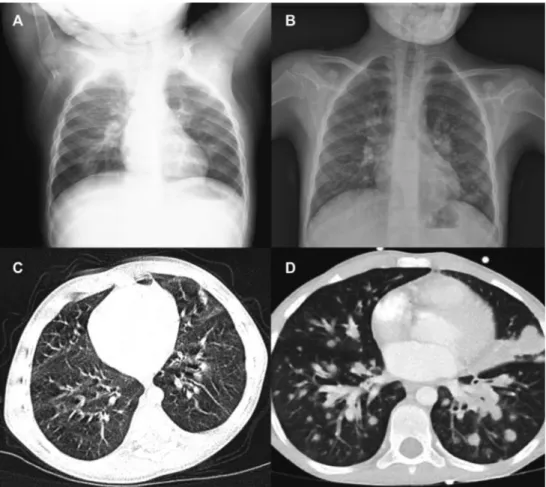
FIG E1. Anteroposterior chest radiography showing lack of thymic shadow in P2 (A) and P3 (B) and noncon-trast chest CT scan showing bronchiectasis in P2 (C) and multiple parenchymal nodules in P3 (D).
J ALLERGY CLIN IMMUNOL JUNE 2019 2321.e4 LETTERS TO THE EDITOR
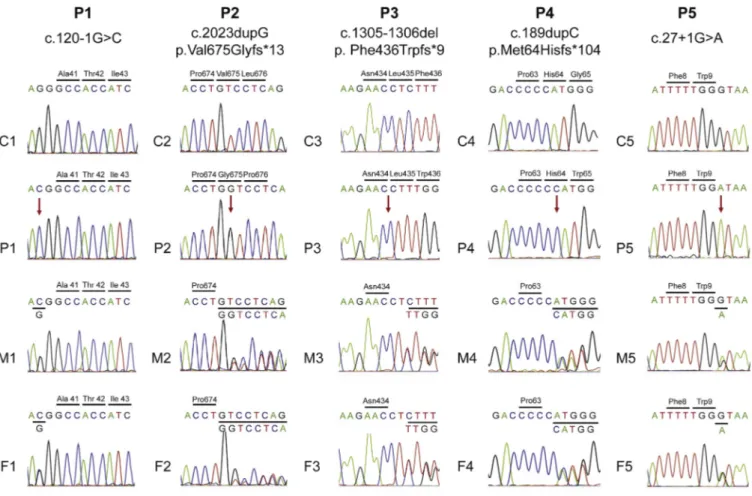
FIG E2. Chromatograms of FCHO1 genomic DNA sequences in healthy control subjects (C1-C5), patients (P1-P5), and heterozygous carriers (mother, M1-M5; father, F1-F5) for each family. Red arrows indicate local-ization of homozygous mutations in the patients.
J ALLERGY CLIN IMMUNOL VOLUME 143, NUMBER 6
FIG E3. Relative expression of FCHO1 and FCHO2 transcripts in healthy donors’ lymphoid subpopulations (CD41, CD81, CD191, and CD561cells), fibroblasts, and K562 cells. Expression of target genes was normal-ized tob-actin reference gene expression levels within the same sample to determine D cycle threshold values.
J ALLERGY CLIN IMMUNOL JUNE 2019 2321.e6 LETTERS TO THE EDITOR
FIG E4. A, Surface expression of CD69, CD25, and CD71 after 24 and 48 hours of stimulation with anti-CD3 plus Protein A in T cells from 2 healthy control subjects and P2. Staining with isotype control is shown in gray. B, Dilution of CellTrace Violet staining as a readout of Dynabeads CD3/CD28-induced proliferation of CD41(top) and CD81(bottom) T cells from a healthy control subject (left panels) and P2 (middle panels), with overlay shown in right panels. C, Flow cytometric analysis of the kinetics of TCRb surface expression in unstimulated and anti-CD3/CD28–stimulated PBMCs from a healthy control subject (upper panels) and P2 (lower panels).
J ALLERGY CLIN IMMUNOL VOLUME 143, NUMBER 6
FIG E5. TCRb (TRB) repertoire of peripheral blood T cells from a healthy control subject and P2. Shown is a heat map of TRBV-TRBJ gene productive rearrangements among total sequences obtained.
J ALLERGY CLIN IMMUNOL JUNE 2019 2321.e8 LETTERS TO THE EDITOR
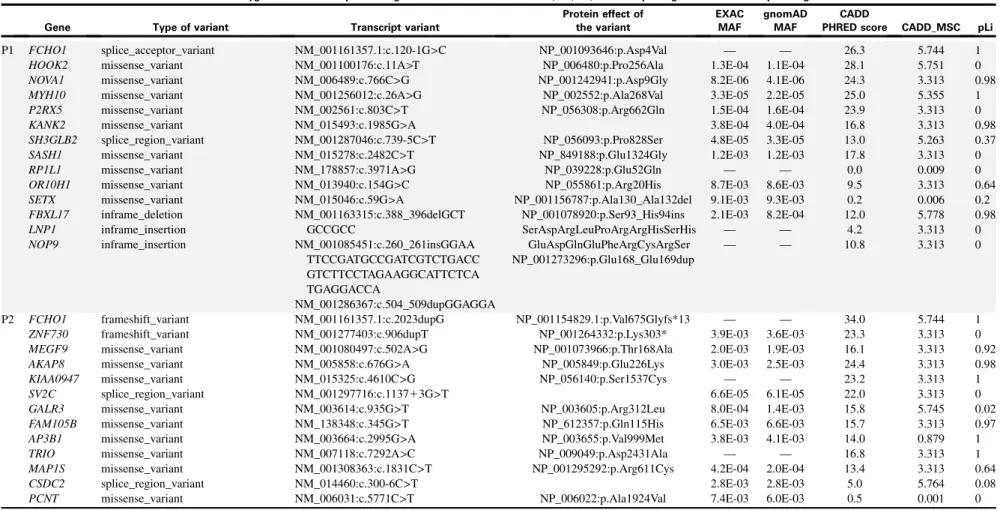
TABLE E1. Results of whole-exome sequencing and targeted sequencing of primary immune deficiency–related genes
Rare homozygous exonic and splice-site genetic variants identified in P1, P2, P4, and P5 by using whole-exome sequencing
Gene Type of variant Transcript variant
Protein effect of the variant EXAC MAF gnomAD MAF CADD
PHRED score CADD_MSC pLi
P1 FCHO1 HOOK2 NOVA1 MYH10 P2RX5 KANK2 SH3GLB2 SASH1 RP1L1 OR10H1 SETX FBXL17 LNP1 NOP9 splice_acceptor_variant missense_variant missense_variant missense_variant missense_variant missense_variant splice_region_variant missense_variant missense_variant missense_variant missense_variant inframe_deletion inframe_insertion inframe_insertion NM_001161357.1:c.120-1G>C NM_001100176:c.11A>T NM_006489:c.766C>G NM_001256012:c.26A>G NM_002561:c.803C>T NM_015493:c.1985G>A NM_001287046:c.739-5C>T NM_015278:c.2482C>T NM_178857:c.3971A>G NM_013940:c.154G>C NM_015046:c.59G>A NM_001163315:c.388_396delGCT GCCGCC NM_001085451:c.260_261insGGAA TTCCGATGCCGATCGTCTGACC GTCTTCCTAGAAGGCATTCTCA TGAGGACCA NM_001286367:c.504_509dupGGAGGA NP_001093646:p.Asp4Val NP_006480:p.Pro256Ala NP_001242941:p.Asp9Gly NP_002552:p.Ala268Val NP_056308:p.Arg662Gln NP_056093:p.Pro828Ser NP_849188:p.Glu1324Gly NP_039228:p.Glu52Gln NP_055861:p.Arg20His NP_001156787:p.Ala130_Ala132del NP_001078920:p.Ser93_His94ins SerAspArgLeuProArgArgHisSerHis GluAspGlnGluPheArgCysArgSer NP_001273296:p.Glu168_Glu169dup — 1.3E-04 8.2E-06 3.3E-05 1.5E-04 3.8E-04 4.8E-05 1.2E-03 — 8.7E-03 9.1E-03 2.1E-03 — — — 1.1E-04 4.1E-06 2.2E-05 1.6E-04 4.0E-04 3.3E-05 1.2E-03 — 8.6E-03 9.3E-03 8.2E-04 — — 26.3 28.1 24.3 25.0 23.9 16.8 13.0 17.8 0.0 9.5 0.2 12.0 4.2 10.8 5.744 5.751 3.313 5.355 3.313 3.313 5.263 3.313 0.009 3.313 0.006 5.778 3.313 3.313 1 0 0.98 1 0 0.98 0.37 0 0 0.64 0.2 0.98 0 0 P2 FCHO1 ZNF730 MEGF9 AKAP8 KIAA0947 SV2C GALR3 FAM105B AP3B1 TRIO MAP1S CSDC2 PCNT frameshift_variant frameshift_variant missense_variant missense_variant missense_variant splice_region_variant missense_variant missense_variant missense_variant missense_variant missense_variant splice_region_variant missense_variant NM_001161357.1:c.2023dupG NM_001277403:c.906dupT NM_001080497:c.502A>G NM_005858:c.676G>A NM_015325:c.4610C>G NM_001297716:c.113713G>T NM_003614:c.935G>T NM_138348:c.345G>T NM_003664:c.2995G>A NM_007118:c.7292A>C NM_001308363:c.1831C>T NM_014460:c.300-6C>T NM_006031:c.5771C>T NP_001154829.1:p.Val675Glyfs*13 NP_001264332:p.Lys303* NP_001073966:p.Thr168Ala NP_005849:p.Glu226Lys NP_056140:p.Ser1537Cys NP_003605:p.Arg312Leu NP_612357:p.Gln115His NP_003655:p.Val999Met NP_009049:p.Asp2431Ala NP_001295292:p.Arg611Cys NP_006022:p.Ala1924Val — 3.9E-03 2.0E-03 3.0E-03 — 6.6E-05 8.0E-04 6.5E-03 3.8E-03 — 4.2E-04 2.8E-03 7.4E-03 — 3.6E-03 1.9E-03 2.5E-03 — 6.1E-05 1.4E-03 6.6E-03 4.1E-03 — 2.0E-04 2.8E-03 6.0E-03 34.0 23.3 16.1 24.4 23.2 22.0 15.8 15.7 14.0 16.8 13.4 5.0 0.5 5.744 3.313 3.313 3.313 3.313 3.313 5.745 3.313 0.879 3.313 3.313 5.764 0.001 1 0 0.92 0.98 1 0 0.02 0.97 1 1 0.64 0.08 0 (Continued) J ALLERGY CLIN IMMUNOL VOLUME 143, NUMBER 6 LETTERS TO THE EDITOR 2321.e9
TABLE E1. (Continued)
Rare homozygous exonic and splice-site genetic variants identified in P1, P2, P4, and P5 by using whole-exome sequencing
Gene Type of variant Transcript variant
Protein effect of the variant EXAC MAF gnomAD MAF CADD
PHRED score CADD_MSC pLi
P4 FCHO1 AIM1L KIAA0040 THADA CAND2 MUC4 ZNF718 DGKQ DGKQ GRK4 HTT ADH1B MTTP TXNDC5 KLHL31 ZP3 FBXW8 DZIP1 GOLGA6L2 DENND4A ZFPM1 WRAP53 USP22 ECSIT RFX1 NOTCH3 frameshift_variant disruptive_inframe_deletion missense_variant missense_variant splice_acceptor_variant missense_variant missense_variant missense_variant splice_region_variant frameshift_variant splice_region_variant missense_variant missense_variant missense_variant missense_variant splice_region_variant missense_variant missense_variant missense_variant missense_variant disruptive_inframe_deletion missense_variant missense_variant missense_variant missense_variant missense_variant NM_001161357.1:c.184_185insC NM_001039775.3:c.1593_1643delC GTGAAGGGCCCCGGTGCTCCTG ATGCCTCATTTCCCACCTGGAA AGAGGT NM_014656.2:c.195C>A NM_022065.4:c.4989C>G NM_001162499.1:c.492-1G>A NM_018406.6:c.3592G>A NM_001039127.5:c.951T>C NM_001347.3:c.719G>A NM_001347.3:c.272-3C>T NM_182982.2:c.655_656insA NM_002111.8:c.529-3C>T NM_000668.5:c.937C>T NM_001300785.1:c.2738C>T NM_030810.4:c.110G>A NM_001003760.4:c.331G>A NM_001110354.1:c.536-4T>A NM_153348.2:c.880C>G NM_198968.3:c.1970C>T NM_001304388.1:c.2416G>C NM_001320835.1:c.3943A>G NM_153813.2:c.1334_ 1339delCTCTGG NM_018081.2:c.187G>A NM_015276.1:c.613C>A NM_016581.4:c.146G>T NM_002918.4:c.839A>G NM_000435.2:c.6061G>A NP_001154829.1:p.Met64Hisfs*104 NP_001034864.2:p.Asp539_ Pro555del NP_055471.2:p.Asn65Lys NP_071348.3:p.His1663Gln NP_060876.5:p.Ala1198Thr NP_001034216.2:p.Asn3175 NP_001338.2:p.Arg240His NP_892027.2:p.Arg222Lysfs NP_000659.2:p.Arg313Cys NP_001287714.1:p.Pro913Leu NP_110437.2:p.Arg37Gln NP_001003760.2:p.Val111Met NP_699179.2:p.His294Asp NP_945319.1:p.Pro657Leu NP_001291317.1:p.Ala806Pro NP_001307764.1:p.Ser1315Gly NP_722520.2:p.Leu446_Ala447del NP_060551.2:p.Val63Met NP_056091.1:p.Leu205Met NP_057665.2:p.Ser49Ile NP_002909.4:p.Gln280Arg NP_000426.2:p.Val2021Met 8.2E-06 7.1E-05 — 4.4E-05 — — 2.2E-03 9.5E-04 — 4.9E-04 8.2E-04 8.2E-05 2.3E-04 — 2.0E-03 6.9E-04 — 3.1E-04 9.6E-05 — 1.4E-03 4.1E-04 1.7E-05 — 2.5E-05 1.6E-04 — — — 3.0E-05 — 1.6E-03 2.4E-03 1.7E-03 — 5.2E-04 7.9E-04 8.9E-05 3.5E-04 3.3E-04 2.3E-03 7.5E-04 0.0E100 3.4E-04 — — 1.2E-03 3.5E-04 8.1E-06 4.1E-06 4.5E-05 2.3E-04 28.9 2.4 14.8 10.3 32.0 7.6 3.3 19.3 9.9 31.0 8.6 24.5 15.5 12.3 26.1 0.6 23.9 24.4 11.4 16.3 10.2 7.7 24.7 0.1 26.1 28.7 5.744 5.798 10.903 3.313 3.313 3.313 3.313 3.313 3.313 3.313 3.313 0.002 3.313 3.313 3.313 3.313 3.313 3.313 3.313 3.313 23.7 5.562 3.313 3.313 12.19 1 0 0 0 0 0 NA 0 0 0 1 0.19 0.01 0 0.02 0 0 0 0 0 0.03 0.62 0.98 0.02 1 0.21 (Continued) J ALLERGY CLIN IMMUNOL JUNE 2019 2321.e10 LETTER S TO THE EDITOR
TABLE E1. (Continued)
Rare homozygous exonic and splice-site genetic variants identified in P1, P2, P4, and P5 by using whole-exome sequencing
Gene Type of variant Transcript variant
Protein effect of the variant EXAC MAF gnomAD MAF CADD
PHRED score CADD_MSC pLi
P5 FCHO1 PTCD3 NIFK ARPP21 XIRP1 TOPAZ1 DNAH1 PRKCD CFAP44 ZNF595 MAST4 C5orf63 AP5Z1 RADIL SKAP2 GARS CDK13 MAMDC4 ANAPC2 KMT2D RGS11 TMEM8A FTSJ3 GNA13 AXIN2 RNF213 MYO1F F2RL3 PCNT splice_donor_variant missense_variant frameshift_variant missense_variant missense_variant missense_variant missense_variant missense_variant missense_variant splice_acceptor_variant missense_variant missense_variant missense_variant missense_variant missense_variant missense_variant missense_variant splice_region_variant missense_variant missense_variant missense_variant missense_variant missense_variant missense_variant missense_variant splice_region_variant missense_variant missense_variant missense_variant NM_001161357.1:c.2711G>A NM_017952.5:c.1028G>A NM_032390.4:c.683_684delTG NM_001267619.1:c.1871C>T NM_194293.2:c.4991G>A NM_001145030.1:c.4783A>G NM_015512.4:c.888G>C NM_006254.3:c.1928G>A NM_001164496.1:c.5396G>A NM_182524.3:c.63412C>T NM_001164664.1:c.6014C>G NM_001164479.1:c.37A>G NM_014855.2:c.1162G>A NM_018059.4:c.1142T>C NM_003930.4:c.583C>A NM_002047.3:c.269A>G NM_003718.4:c.4247C>A NM_206920.2:c.79617C>T NM_013366.3:c.522G>C NM_003482.3:c.8669C>G NM_183337.2:c.647G>A NM_021259.2:c.1139C>T NM_017647.3:c.485G>A NM_006572.5:c.445A>G NM_004655.3:c.986G>A NM_001256071.2:c.1197218C>T NM_012335.3:c.943G>A NM_003950.3:c.554G>A NM_006031.5:c.7252G>A NP_060422.4:p.Arg343Gln NP_115766.3:p.Val228Glyfs NP_001254548.1:p.Ser624Leu NP_919269.2:p.Arg1664Gln NP_001138502.1:p.Ile1595Val NP_056327.4:p.Gln296His NP_006245.2:p.Arg643His NP_001157968.1:p.Arg1799Gln NP_001158136.1:p.Thr2005Ser NP_001157951.1:p.Arg13Gly NP_055670.1:p.Val388Ile NP_060529.4:p.Leu381Pro NP_003921.2:p.Arg195Ser NP_002038.2:p.Asp90Gly NP_003709.3:p.Pro1416His NP_037498.1:p.Gln174His NP_003473.3:p.Pro2890Arg NP_899180.1:p.Arg216His NP_067082.2:p.Ser380Leu NP_060117.3:p.Arg162His NP_006563.2:p.Ile149Val NP_004646.3:p.Ser329Asn NP_036467.2:p.Gly315Arg NP_003941.2:p.Arg185His NP_006022.3:p.Gly2418Ser — 3.3E-05 — — 2.9E-04 2.8E-03 6.5E-04 9.9E-05 — — 1.5E-04 4.3E-05 5.8E-05 — — 8.3E-06 9.1E-05 — 8.2E-06 — 2.8E-05 3.7E-04 8.2E-06 2.5E-04 1.6E-05 3.2E-03 1.7E-04 — 2.5E-05 — 4.5E-05 — — 3.9E-04 1.7E-03 6.6E-04 1.1E-04 2.8E-05 — 1.7E-04 5.0E-05 5.7E-05 — — 4.1E-06 5.7E-05 — — 1.2E-05 3.8E-05 3.5E-04 8.1E-06 2.6E-04 1.6E-05 3.6E-03 1.7E-04 9.4E-06 3.3E-05 33.0 26.2 24.3 23.4 16.7 22.6 8.9 23.8 23.4 0.4 6.9 22.9 10.6 16.4 31.0 24.7 26.6 10.9 20.7 25.0 0.5 14.6 27.3 23.7 23.1 3.1 16.2 24.1 12.8 5.744 3.313 3.313 3.313 3.313 3.313 22.1 26.5 4.487 3.313 23.8 3.313 8.906 22.9 3.313 3.313 3.313 0.001 3.313 3.313 3.313 5.785 21.7 3.313 3.313 3.313 0.001 1 0 0 0 0 0.99 0 1 0 0 0.01 0 0 0 0.91 0.79 0.75 0 0.99 1 0 0 0.48 0.53 0.12 0 0.16 0 0
Variants identified on targeting sequencing of >500 immune-related genes
P3 Homozygous variants FCHO1 Heterozygous variants C1QB CCDC40 EMR2 IL17F PARN TNFAIP3 frameshift_variant splice_acceptor_variant missense_variant missense_variant missense_variant missense_variant missense_variant NM_001161357.1:c.1305_1306del NM_000491:c188-1G>T NM_001243342.1:c.2891A>G NM_013447.4:c.185C>T NM_052872.3:c.230G>A NM_002582.4:c.1785T>G NM_006290.3:c.1189T>C NP_001154829.1:p.Phe436Trpfs*9 NP_000482.3:p.His964Arg NP_038475.2:p.Met62Thr NP_443104.1:Arg77His NP_002573.1: Asp595Glu NP_001257436.1:Ser397Pro — — — 1.5E-04 5.8E-05 2.3E-04 — — — 8.9E-02 3.2E-05 4.5E-05 2.1E-04 — 33.0 32.0 4.3 1.2 26.2 5.7 28.3 4.74 19.64 0 2.31 2.31 2.31 2.31 1 0.16 0 0 0.04 0 1
MAF, Minor allele frequency; NA, not applicable.
J ALLERGY CLIN IMMUNOL VOLUME 143, NUMBER 6 LETTERS TO THE EDITOR 2321.e11
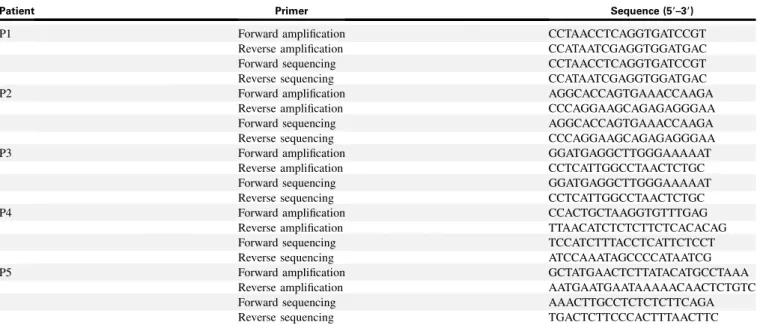
TABLE E2. Sequence of primers used for Sanger confirmation of FCHO1 mutations
Patient Primer Sequence (59–39)
P1 Forward amplification CCTAACCTCAGGTGATCCGT
Reverse amplification CCATAATCGAGGTGGATGAC
Forward sequencing CCTAACCTCAGGTGATCCGT
Reverse sequencing CCATAATCGAGGTGGATGAC
P2 Forward amplification AGGCACCAGTGAAACCAAGA
Reverse amplification CCCAGGAAGCAGAGAGGGAA
Forward sequencing AGGCACCAGTGAAACCAAGA
Reverse sequencing CCCAGGAAGCAGAGAGGGAA
P3 Forward amplification GGATGAGGCTTGGGAAAAAT
Reverse amplification CCTCATTGGCCTAACTCTGC
Forward sequencing GGATGAGGCTTGGGAAAAAT
Reverse sequencing CCTCATTGGCCTAACTCTGC
P4 Forward amplification CCACTGCTAAGGTGTTTGAG
Reverse amplification TTAACATCTCTCTTCTCACACAG
Forward sequencing TCCATCTTTACCTCATTCTCCT
Reverse sequencing ATCCAAATAGCCCCATAATCG
P5 Forward amplification GCTATGAACTCTTATACATGCCTAAA
Reverse amplification AATGAATGAATAAAAACAACTCTGTC
Forward sequencing AAACTTGCCTCTCTCTTCAGA
Reverse sequencing TGACTCTTCCCACTTTAACTTC
J ALLERGY CLIN IMMUNOL JUNE 2019 2321.e12LETTERS TO THE EDITOR