1
CLUSTERING EFFECT ON COMPETETIVE ADVANTAGE in SMEs: DOES IT REALLY GIVE ANADVANTAGE?
Yıldız Y.GUZEY
International Trade and Finance Department, Izmir University, Turkey [email protected]
Ozlem TASSEVEN
Department of Economics and Finance, Dogus University, Turkey [email protected]
Hilmi ELIFOGLU
Department of Accounting & Taxation, St. Johns University, USA [email protected]
Ahu GUZEL
Business Department, Izmir University, Turkey [email protected]
N.Can OKAY
University of Portsmouth, UK [email protected]
ABSTRACT
According to Michael Porter’s Diamond Model, a business cluster is defined as geographic concentration of inter-connected companies and institutions working in a common industry. In addition, clusters encompass an array of collaborating and competing services and providers that create a specialized infrastructure, which supports the cluster’s industry.
The economic cluster model, represents a synergy, a dynamic relationship and a network between not only the companies that comprise a cluster but also the successful partnering of the stakeholders. Today in all over the World, successful clusters have established a greater competitive advantage and wealth creation for their regions when compared to companies not in a cluster. Given this success more policy makers and regions are considering fostering cluster development as building blocks of regional economies.
Research is planned and performed for understanding the clustering in SMEs Industrial Estate in Istanbul if it gives a competitive advantage to the Cluster members or not. It is performed to determine and satisfy the lack of knowledge about the small and medium enterprises’ issues, technologic systems, production quality standards, capacity usage ratios, interactions with other firms, habits of following the technologic improvements and clustering effects on the members.
Key words: Clusters, SMEs, Clustering JEL Classification: M19
1.INTRODUCTION
Clusters are geographic concentrations of interconnected companies and institutions in a particular field.They extend downstream to channels and customers and laterally no manufactures of complementary products and to companies in industries related by skills, technologies, or common inputs (Rosenfeld, 1991). Percepting cluster as a term significantly increased by Michael Porter’s studies.
2
1. Related firms with each other; for example SMEs at Egyptian Bazaar. They are selling familiar products (jewerly, spice and giftware.etc.)
2. Distribution channels, customers, suppliers and the firms which are expecting benefits from same sectors such as technology producers.
3. Related institutions about a sector. For example: colleges, organizations, education and standarized firms. Clusters are the key organizational unit for understanding and improving the performance of regional collection of unrelated firms (Tracy & Clark, 2003). Firms cluster together within a region because each firm benefits from being located near other similar or related firms. The firms in a cluster have common competitive strengths and needs. Given the popularity of the cluster approach, it is valuable to understand what clusters are, why they exist, how to identify them, how they matter for regional economic development, and how to use cluster analysis in policy and practice. Clusters represent a fundamental organizing framework for understanding regional economies and for developing economic strategies (Hirst&Thompson, 1996).
Clusters occur in many types of industries, in both larger and smaller fields, and even in some local businesses, such as restaurants, car dealers, and antique shops. They are present in large and small economies, in rural and urban areas, and at several geographic levels. Clusters vary in size, breadth, and state of development. Crag (2002) and Porter (1998) argue that some clusters consist primarily of small- and medium-sized firms.
2. CLUSTER THEORY
According to Newland “The theoretical approachs about Business Clusters are striking in their variety” (Newland, 2003). A wide set of arguments drawn upon to establish what advantages rely on spatial concentration and to determine the balance between competition and cooperation that generates the advantages (Perry, 2005).
There are five main approaches about clustering;
Agglomeration Theory: (Marshall:1890-1927): Agglomeration Theory explains that firms cluster to share a “commons”of business services, labour pool and to enable individual specialization.Theory viewed Business Clusters as collections of atomistic businesses, connected through market relations rather than deliberate collaboration (Perry,2005).The sources of agglomeration economy allow firms within the same industry to gain from their mutual presence close to each other. Cluster membership benefits helped small firms located in clusters substitude for the internal scale advantages obtained by large firms. Reduced information costs are the key feature of Marshall’s economies (McCann,2001).When firms are located together, it suggests that there is relatively easy access to representatives of other firms of interests (Perry, 2005).
Transaction Coasts and the “Californian School”:According to Transaction Coasts and the Californian
school,business cluster formation is related with market conditions that increase the uncertanity faced by individual businesses and risk.In response for market condition, production chains have tended to “disintegrate”among independed businesses connected through transactions.
Flexible Specialization: This theory assumes, cluster members gain from the transfer of industry intelligence outside formal transaction. Firms in a cluster are expected to become interdependent through the flexibility of indivudual firms boundaries.
Innovative milieux and the GREMI research group: Innovative milieux and the GREMI research group argues that clustering supports a collective learning process operating through skilled labour mobility, customer-supplier interaction and informal “cafeteria effects”.
Institutional and evolutionary economics: Theory asssumes that the wisdom of clustering comes from where business and intitutional dependencies lock a particular business community into a common response.
3
From the other approaches, there are three underlying processes are identified and present: trust, localized learning and externalization.
2.1. Dimensions of Clustering
One key to understanding clusters is to recognize that there are multiple dimensions to cluster relationships, including geography, social distance, technology, and production flows. Not all clusters operate in all dimensions. Clustering is about proximity; the underlying rationale is that businesses that are closer to one another have advantages that are unavailable to businesses that are farther away. Some firms that are close to one another perform differently from otherwise similar peers located elsewhere(Crang&Martin,1991; Benner 2002)..
There are three dimensions of clusters:
Life cycle (existing, emerging, and potential): There is general agreement that clusters exhibit a life cycle, which draws from "product lifecycle" and "industry life cycle" theories. The cluster life cycle also includes the possibility that clusters may reinvent or redefine themselves as markets and technology change (Sadowski, B.M., Maitland, C. & van Dongen, 2002).
Linkages (buyer-supplier or labour pool): Most firms buy inputs (raw materials, services, components) from other firms.
Geography (regional or statewide): Characterizing the dimensions of clustering, as with defining clusters in the first place, is not an exact science (Santarelli, E. & D'Altri, 2003).
2.2. Clusters and Competitive Advantage Relations
In order to continue their existence enterprises must have competitive advantage against their competitors. Although a number of states and regions are using the cluster model to analyze their economies and organize key industries, only a few begin to show fundamental changes in the provision of economic services based on clusters (Rosenfeld 2003). There are three advantages that can be used in clustering strategies (Sternberg, 1991 Stoneman, & Toivanen, 1997 and Rosenfeld 1995).
Cost Advantage: In clustering structures, its easier to get customers. Its more effective and cheaper to use common utilities such as ( transportation, communication, energy, cleaning, security etc )
Variety Advantage: Relationships and correlative competition pressure turn enterprises to find new products and services in order to strengthen their abilities.
Resource Advantage: Easier labour force, easier financing, easier goods and services, easier capital and finally easier information and technology.
Porter (1998) state that factors attracting clusters are;
Labour Pool: One of the reasons for SMEs to make clustering structure is to attain labour pool easily. Supplier Specialization: If SMEs find any potential customers about a specific subject, they can spend
their money develop specialization.
Information Knowledge: Labour forces that are focusing on same economical intentions and problems, provide shared information knowledge.
4
Path Dependency: Economical opportunities appear on a specific region, are the results of existing economical activities.
Culture: When we analyze cluster firms, the most important component is social intercourse between SMEs. It is not only about relationship between employee and employers. It is also related with customers. Local Demand: Consumers demand is also effective for clusters.
Clusters can make competitive advantages by combining those factors together. Competitive advantage grows out of the value a firm is able to create for its buyer and this can be diagnosed through the value chain. Sternberg, (1991) Rosenfeld, (1991, 1995) state that innovation is seen to be central in creating a competitive advantage by perceiving or discovering new and better ways to compete in an industry and bringing them to market.
2.3. Types of business clusters generally based on different kinds of knowledge;
Techno clusters – These types of clusters are generally new technology-oriented, well adapted to the knowledge-based economy, and generally have collaborative networks with University or research centers etc.
Historic knowhow-based clusters – Historic knowhow-based clusters are based on more traditional activities than other types of clusters that maintain their advantage in know-how as an core competency over the years or over the centuries (for example; Granbazaar).
Factor Endowment clusters are based on comparative advantage and have geographical position. Their comparative advantage generally related with their location.For example:Some Fish companies located near the seaside or wine production clusters located some sunny region. Like Italy, Sicilya, France and San Francisco Napa Valley.
3.LIGHTING SECTOR:
3.1. Definition and Content of The Lighting
Lighting is an element that steps forward with it’s both decorative and functional feature. Light was used in street
lamps in 18. Century then it started to be used in spaces. With the fast development of the technology and creativities of designers made lighting an important decoration element, beyond the lighting need. The aim of lighting; is not obtaining a certain lighting level, it became providing the ideal and correct visual conditions. Today, lighting firms, with the developing designs are not only producing and selling lamps or ampoules but also they are creating decorative solutions by designing projects that are suitable for every space.
3.2. Lighting Sector In Turkey
In 1990 Turkey’s export was 13.8 million dollars, import 12.52 million dollars and foreign trade volume was at 26.3 million dollars level. With the crisis of 1994 import reduced to 11.6 million dollars level, export rised to 20.9 million dollars level. However, between the years of 1996-2000 import was one step forward than export. After the economic crisis in 2001, Turkey Lighting Sector turned towards export rapidly and came into prominence with it’s exporter identity. In 2002 and 2003 the increase trend in export went on. Turkish ligting sector which is developed in recent years, multipled the lighting alternatives of the architects projects in international market and on the other hand, it started to export it’s products to foreign markets. The number of firms, manufacturing in accordance with the international quality standards is rising every day in Turkey.
5
Table 1: Production Values According to Year
Years Production Values (TL) 2000 4,969,199
2001 6,552,975 2002 12,918,373 2003 19,035,189 2004 18,939,798
In 2000, our yearly manufacturing amount of 4.9 million TL showed four times increase in a short period
of 4 years. This sector became ready to be a very important and fast developing sector with high income
and added value.
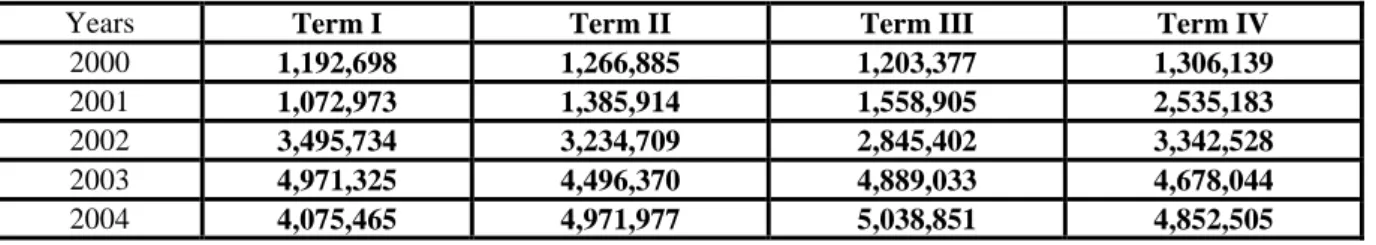
Table 2: Production of Lighting Equipments According to Terms (TL)
Years Term I Term II Term III Term IV
2000 1,192,698 1,266,885 1,203,377 1,306,139
2001 1,072,973 1,385,914 1,558,905 2,535,183
2002 3,495,734 3,234,709 2,845,402 3,342,528
2003 4,971,325 4,496,370 4,889,033 4,678,044
2004 4,075,465 4,971,977 5,038,851 4,852,505
3.3. Sector and Employment
The number of the people that lighting equipments sector employ in our country is nearly 10.000. Considering that actual manufacturing firms start production in full capacity, it is expected that they will employ nearly 20.000 people.
4.RESEARCH
This research is planned and performed to investigate whether the clustering in Şişhane & Küçükköy Lighting Industrial Estate gives a competitive advantage to the enterprises in Şişhane and Küçükköy or not. Scope of research is planned as the small and medium enterprises in Şişhane & Küçükköy Lighting Industrial Estate, Istanbul.
Table 3. Research Hypothesis
Procurement method of the companies of their raw materials – input & benefiting from cluster members. Procurement method of the companies of their raw materials – input & having advantage of procuring raw materials – input of the cluster.
Sales method of the products & input & having advantage of procuring raw materials – input of the cluster. Sales method of the products & insufficiency of warehousing areas.
Company strategies & relationship among cluster members.
Cooperation opportunities with other companies and partnership with cluster members.
Cooperation opportunities with other companies and opportunities of cluster members to have cooperation and advantage.
Having advantage in procurement of the goods-raw material & sufficiency of carriage/transport/infrastructure. To Feel Lucky because of location & opportunities of cluster members to have cooperation and advantage.
99 Small and medium enterprises that are in Şişhane & Küçükköy Lighting Industrial Estate are sampled. The samples are chosen randomly from all sectors. Basic terms used in the analysis are as follows:
Enterprises that employed (1-20) people are; SMALL Enterprises that employed (21-101) people are; MEDIUM
6
Enterprises that employed (101-more) people are; LARGE.Face to face interview method is used in the analyses. In research, there are 47 questions that are open-ended and multiple-choices. We have made face to face interview for the application of questionnaires with 99 firms and have evaluated the results using SPSS Program. Research is performed to determine and satisfy the lack of knowledge about the small and medium enterprises in cluster, clustering, cost advantages, interactions with other firms and clustering effects on business functions.
4.1. Data Analysis
Survey sheets were coded and numbered, filed and tagged with the firms’ details. All questionnaires have been evaluated. For testing research hypothesis given in Table 3, Chi Square -Fisher & Yates- techniques are used.
Table 4. Research Site Description
Location Frequency Percent Valid Percent
Şişhane Küçükköy Other
Both Şişhane and Küçükköy Valid Total 35 48 11 5 99 35,4 48,5 11,1 5,1 100,0 35,4 48,5 11,1 5,1 100,0
Age of Owner Frequency Percent Valid
Percent Cumulative Percent <1961 1961-1970 1971-1980 >1980 Missing System Total 32 47 17 2 1 99 32,3 47,5 17,2 2,0 1,0 100,0 32,7 48,0 17,3 2,0 100,0 32,7 80,6 98,0 100,0
Frequency Percent Valid Percent Lamp shade manufacturers
Lighting - Lighting tools manufacturers Lighting – Painting industry
Lighting – Lighting glass Lighing – Decoration
Lighting – Electricity industry Lighting – Steel indusrty Lighting – Furniture
Lighting – Advertising industry
Lighting - Chandeliers Crystal parts manufacturers Lighting
Lighting glass manufacturing Decoration
Electiricity industry Sandblasting Steel industry
Chandeliers Crystal parts manufacturers Valid Total 2 2 2 3 2 4 6 1 1 2 63 1 1 1 1 3 4 99 2,0 2,0 2,0 3,0 2,0 4,0 6,1 1,0 1,0 2,0 63,6 1,0 1,0 1,0 1,0 3,0 4,0 100 2,0 2,0 2,0 3,0 2,0 4,0 6,1 1,0 1,0 2,0 63,6 1,0 1,0 1,0 1,0 3,0 4,0 100 Enterprises’ Time of Incorporation
Distribution
Frequency Percent Valid Percent Cumulative Percent 1961-199 1991-2000 2001-2009 Valid Total 16 44 39 99 16,2 44,4 39,4 100,0 16,2 44,4 39,4 100,0 16,2 60,6 100,0 Enterprises’ Incorporators Frequency Percent Valid
Percent
Cumulative Percent
7
By me With my partners By my father Took over Valid Total 50 30 15 4 99 50,5 30,3 15,2 4,0 100,0 50,5 30,3 15,2 4,0 100,0 50,5 80,8 96,0 100,0 The Business Main Activity Subject WhenIt Was First Established
Frequency Percent Valid Percent Cumulative Percent Same Other Valid Total 78 21 99 78,8 21,2 100,0 78,8 21,2 100,0 78,8 100,0
Legal Structures Frequency Percent Valid
Percent
Cumulative Percent Joint stock company
Limited partnership Personal Property Valid Total 2 61 36 99 2,0 61,6 36,4 100,0 2,0 61,6 36,4 100,0 2,0 63,6 100,0
Closed Areas(M2) Frequency Percent Valid
Percent Cumulative Percent <100 m2 100-199m2 200-299m2 300-399m2 >399m2 Valid Total 6 32 20 18 23 99 6,1 32,3 20,2 18,2 23,2 100,0 6,1 32,3 20,2 18,2 23,2 100,0 6,1 38,4 58,6 76,8 100,0 Closed Areas’ Sufficiency(M2) Frequency Percent Valid
Percent Cumulative Percent Yes No Total Missing System Valid Total 70 28 98 1 99 70,7 28,3 99,0 1,0 100,0 71,4 28,6 100,0 71,4 100,0
Business Expansion Frequency Percent Valid
Percent
Cumulative Percent No
At the same place At different place Total Missing System Valid Total 71 11 16 98 1 99 71,7 11,1 16,2 99,0 1,0 100,0 72,4 11,2 16,3 100,0 72,4 83,7 100,0
Employees’ Numbers Working In Production
Frequency Percent Valid Percent Cumulative Percent No workers 1-9 person(s) 10-19 20-29 >29 Valid Total 12 32 42 11 2 99 12,1 32,3 42,4 11,1 2,0 100,0 12,1 32,3 42,4 11,1 2,0 100,0 12,1 44,4 86,9 98,0 100,0 Employees’ Numbers Working In Other
Departments
Frequency Percent Valid Percent Cumulative Percent No workers 1-3 person(s) 4-6 >6 Valid Total 5 48 36 10 99 5,1 48,5 36,4 10,1 100,0 5,1 48,5 36,4 10,1 100,0 5,1 53,5 89,9 100,0 Enterprises’ Average Capacities In Last
Three Months
Frequency Percent Valid Percent
Cumulative Percent
8
40%-59% 60%-79% >79% Valid Total 39 50 6 99 39,4 50,5 6,1 100,0 39,4 50,5 6,1 100,0 43,4 93,9 100,0 Enterprises’ Suppliers Frequency Percent ValidPercent Cumulative Percent From Wholesaler From producer Directly import Valid Total 16 73 10 99 16,2 73,7 10,1 100,0 16,2 73,7 10,1 100,0 16,2 89,9 100,0 Description of Products Frequency Percent Valid
Percent Cumulative Percent Semi-finished product Finished product Valid Total 18 81 99 18,2 81,8 100,0 18,2 81,8 100,0 18,2 100,0
Customer Frequency Percent Valid
Percent Cumulative Percent To Retailers Wholesalers Factories Retailers / Wholesalers Wholesalers / Dealer Retailers / W.salers / Dealers Retailers / W.salers / Factories Retailers / W.salers / Export comp. Retailers / W.salers / Directly Export W.salers / Exp. Comp./ Directly Ex. Retailers / W.salers / Dealers / D. Ex. Retailers /W.salers / Exp. com. / D. Exp. Retailers /W.salers/Dealers /Exp.comp /D.Exp. Total 1 10 1 51 2 5 3 6 10 1 3 5 1 99 1,0 10,1 1,0 51,5 2,0 5,1 3,0 6,1 10,1 1,0 3,0 5,1 1,0 100,0 1,0 10,1 1,0 51,5 2,0 5,1 3,0 6,1 10,1 1,0 3,0 5,1 1,0 100,0 1,0 11,1 12,1 63,6 65,7 70,7 73,7 79,8 89,9 90,9 93,9 99,0 100,0
Technology Usage Frequency Percent Valid
Percent Cumulative Percent Modern Traditional Valid Total 45 54 99 45,5 54,5 100,0 45,5 54,5 100,0 45,5 100,0 Technology Renovations of Enterprises Frequency Percent Valid
Percent Cumulative Percent Yes Partially No Total Missing System Valid Total 32 47 19 98 1 99 32,3 47,5 19,2 99,0 1,0 100,0 32,7 48,0 19,4 100,0 32,7 80,6 100,0
When the small and medium enterprises in Şişhane & Küçükköy Lighting Industrial Estate are classified; As can be seen in Table 4 from 99 respondent SMEs, it is found that;
63,6% of the enterprises are operating in lighting business,
6,1% of the enterprises are operating in both lighting business and steel industry (supply industry of lighting equipments),
4% of the enterprises are operating in “Chandeliers Crystal parts manufacturing” business, 4% of the enterprises are operating in both lighting and electricity industry (bulb-cable etc.).
9
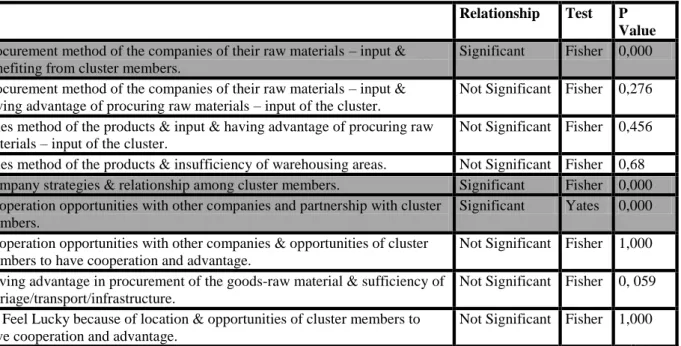
Table 5: The Results of Hypothesis Tests
Relationship Test P Value Procurement method of the companies of their raw materials – input &
benefiting from cluster members.
Significant Fisher 0,000 Procurement method of the companies of their raw materials – input &
having advantage of procuring raw materials – input of the cluster.
Not Significant Fisher 0,276 Sales method of the products & input & having advantage of procuring raw
materials – input of the cluster.
Not Significant Fisher 0,456 Sales method of the products & insufficiency of warehousing areas. Not Significant Fisher 0,68 Company strategies & relationship among cluster members. Significant Fisher 0,000 Cooperation opportunities with other companies and partnership with cluster
members.
Significant Yates 0,000 Cooperation opportunities with other companies & opportunities of cluster
members to have cooperation and advantage.
Not Significant Fisher 1,000 Having advantage in procurement of the goods-raw material & sufficiency of
carriage/transport/infrastructure.
Not Significant Fisher 0, 059 To Feel Lucky because of location & opportunities of cluster members to
have cooperation and advantage.
Not Significant Fisher 1,000
According to Chi-square test results as given in Table 5, we find out that there is a statistically significant relationship between technique of production, raw materials and inputs & benefiting from cluster members. We obtained that there is a statistically significant relationship between cooperation opportunities with other companies & partnership with cluster members. Also, it is found that there is a relationship between Company strategies & relationship among cluster members.
5.CONCLUSION
In summary, survey targets the clusturing, structural characteristics and what kind of competitive advantages lighting firms are getting from Şişhane & Küçükköy Lighting Industrial Estate.
The results showes that the enterprises are mostly located in Küçükköy (48,5%), most of the owners were born between the years 1961-1970 (47,5%), the enterprises are mostly operating in only lighting sector (63,6%), the firms generally opened between 1991-2000 (44,4%), mostly have established own business (50,5%), legal structure of firm is limited partnership with 61,6%, And business activity area is mostly between 100-199 m2 (32,3%), mostly do not think expanding their business (71,7%), most firms have 10-19 employers in production with 42,4% and 1-3 employers in other departments with 48,5%, the average capacity of enterprises in last 3 months is between 60%-79% (50,5%), most of enterprises are supplying from producers (73,7%), most of enterprises sell their products to “Retailers / Wholesalers” (51.5%), most of enterprises believe that being together with another lighting enterprises is an advantage (97%), all of the enterprises reach their target customer easily.
By this research we aimed to find a relationship between competitive advantage and cluster membership. As a results of the hypothesis tested; It is found, that there is a relationship between technique of production, raw materials and inputs& benefiting from cluster members, Cooperation opportunities with other companies & partnership with cluster members, company strategies &relationship among cluster members. Existence of raw material suppliers at Şişhane and Küçükköy and being closer of these suppliers to the enterprises give advantage to them in terms of saving time and money. (Transportation and Stock cost can be minimized so profitability can be maximized). Enterprises follow style and trend innovations from each other and they determine their manufacturing new product and growing decisions according to the leaders of the sector. The firms making use of other firms around their company by not only raw material and product technuque but also directing their customers to the other firms around.
10
As Porter (1998) stated, cluster is a system of interconnected firms whose value as a whole is greater than the sum of its parts. Small and medium enterprises in Şişhane & Küçükköy Lighting Industrial Estate are also working together as one company for developing and helping each others.
REFERENCES
Audretsch, D.B. (1998), “Agglomeration and the Location of Innovative Activity”. Oxford Review of Economic Policy, 14(2): 18-29.
Cragg, P.B. (2002), “Benchmarking Information Technology Practices in Small Firms”. European Journal of Information Systems, 11:267-282, Development Quarterly 5, November, 242 356.
Crang, P. and Martin, R. (1991) “Mrs Thatcher’s Vision of the “New Britain” and the Other Sides of the “Cambridge Phenomenon”, Environment and Planning: Society and Space 9: 91-116.
Hirst, P. and Thomson. (1996), Globalization in Question,Cambridge:Polity Press.
McCann, P.(1997)”How Deeply Embedded is Silicon Glen? A cautionary note”,Regional Studies 31(7): 695-703. Newlands, D.(2003) “Competition and Cooperation in Industrial Clusters: the Implications for Public
Policy”,European Planning Studies 11(5): 521-32.
Pery, M.(1995) “Industry Structures, Networks and Joint Action Groups”, Regional Studies 29(3): 208-17.
Porter, M.E.(1998), “Clusters and the New Economics of Competition”. Harvard Business Review. November-December.
Rosenfeld, S. A.(1991),“Over Achievers: Business Clusters that Work, Prospects for Regional Development”. Chapel Hill, NC: Regional Technology Strategies, Inc,1991.
Rosenfeld, S. A.(1995), “Industrial-Strength Strategies: Business Clusters and Public Policy”. The Aspen Institute for Humanistic Studies, Washington, DC,1995.
Rosenfeld, S. (2003) “Expanding Opportunities: Cluster Strategies that Reach More People and More Places”, European Planning Studies 11(4): 359-77.
Sadowski, B.M., Maitland, C. & Van Dongen, J. (2002), “Strategic use of the Internet by Small-and Medium-Sized Companies: an Exploratory Study”. Information Economy and Policy, 14: 75-93.
Santarelli, E. and Daltri, S. (2003), “The Diffusion of e-commerce Among SMEs: Theoretical Implications and Empirical Evidence”. Small Business Economics, 21:273-283.
Sternberg, E. (1991), The Sectoral Cluster in Economic Development Policy: Lessons from Rochester and Buffalo, New York, Economic Policy: Lessons from Rochester and Buffalo, New York.
Stoneman, P. & Toivanen O. (1997), “The Diffusion of Multiple Technologies: An Empirical Study”. Economics of Innovation and New Technology, 5: 1-18.
Tracy, P. & Clark, G.L. (2003), “Alliances, Networks and Competitive Strategy: Rethinking Clusters of Innovation”, Growth & Change, 34(1).