Contents lists available atScienceDirect
Engineering Geology
journal homepage:www.elsevier.com/locate/enggeo
Estimation of the undrained shear strength of Adapazari fine grained soils by
cone penetration test
Ertan Bol
a, Akın Önalp
b, Aşkın Özocak
a, Sedat Sert
a,⁎ aCivil Engineering Department, Sakarya University, Sakarya, TurkeybCivil Engineering Department, İstanbul Kultur University, İstanbul, Turkey
A R T I C L E I N F O Keywords:
Cone penetration test Tip resistance Sleeve friction Undrained shear strength Triaxial test
Soil behavior type index
A B S T R A C T
A comprehensive study to determine the undrained shearing resistance of fine grained soils by the use of cone pene-tration test (CPTu) was carried out on the thick fluvial sediments of the plain of Adapazari, Turkey. The soundings were performed adjacent to geotechnical boreholes for comparison. Eighty-three undisturbed samples of low, intermediate and high plasticity were procured in the process, which were classified and tested in unconsolidated undrained triaxial (UU) conditions in the laboratory. The cone resistance, sleeve friction and pore water pressure values recorded along the length of undisturbed sampling were averaged to obtain characteristic values. It is known that the empirical formulae to interpret CPT readings use cone factors Nk, Nktand Nkewhich can be highly variable. This can lead to
unacceptable error levels in the assessment of undrained shear strength (su). Nevertheless, it was noticed in this study
that the undrained strengths estimated by employing the traditional relationships for CPT came out quite close to the values measured in the laboratory if soil classes are taken into account. Since soil sampling is not done in the cone penetration test by default, classification of the soil is attempted by the use of the soil type behavior index (Ic). This
study showed that the error margins for suvalues measured in the laboratory and inferred from CPT are considerably
reduced by using the soil type behavior index (Ic) to determine soil behavior type specific cone factors.
1. Introduction
There is considerable demand to obtain the undrained shear strength (su) of fine grained soils in many geotechnical problems, because it is a
fundamental property. The bearing capacity of a shallow foundation, stability analyses of slopes and embankments, shaft and tip resistance of drilled shafts and driven piles are calculated using this parameter. The analyses compare the shearing resistance of the soil with the actual loads imposed on the system. Undrained shear strength can be measured by a variety of in situ testing devices as well as laboratory. The related field tests are the standard penetration test (SPT) (Sowers, 1954;Terzaghi and Peck, 1967; Stroud, 1974; Sowers, 1979), cone penetration test (CPT) (Lunne et al., 1997), flat dilatometer test (DMT) (Marchetti, 1980;Tanaka and Tanaka, 1996;Młynarek et al., 2018) and the pressuremeter test (PBT) (Gibson and Anderson, 1961;Marshland and Randolph, 1977). Strength is measured by various tests in the laboratory ranging from unconfined compression to the complicated hollow cylinder. However, the most popular laboratory tests to evaluate undrained shear strength of fine grained soil are the triaxial (TX) and unconfined compression (UC) tests. The cone penetration test (CPT, CPTu), which was developed in the 30s, has found increasing use in recent years to determine the physical,
mechanical and dynamic properties of soils, due to its rapid execution and ability to record the soil profiles continuously. With the aid of developing technology, the properties such as resistivity, chemistry of ground water, its pH, and the temperature can also be measured with this equipment.
The aim of this paper is to test and to optimize the formulation of the correlation of CPTu results and undrained shear strength values measured by means of unconsolidated undrained triaxial tests (UU). As mentioned byLunne et al. (1997), there are theoretical solutions and empirical ap-proaches to evaluate undrained shear strength (su) from cone penetration
data in the literature. Theoretical solutions such as cavity expansion theory (Skempton, 1951;Vesic, 1972;Vesic, 1975), strain path theory (Baligh, 1985; Teh, 1987) and numerical approaches (Ladanyi, 1967) take the undrained modulus (Eu), and the stiffness index (Ir) into account. Other
theoretical approaches are similar to the calculation method based on the theory of bearing capacity of footings (Terzaghi, 1943;de Beer, 1977). The general bearing capacity equation is expressed as
= +
qc N sc u vo (1)
where σvois the in situ total stress, qcbearing capacity of the cone and Nca
theoretical cone factor representing the bearing capacity factor. There are several relationships developed to estimate undrained
https://doi.org/10.1016/j.enggeo.2019.105277
Received 14 June 2018; Received in revised form 27 April 2019; Accepted 29 August 2019 ⁎Corresponding author.
E-mail address:[email protected](S. Sert).
Available online 30 August 2019
0013-7952/ © 2019 Elsevier B.V. All rights reserved.
Table 1
Laboratory and in-situ test data.
ID Depth (m) wL wP wn FC% CLASS e0 γn(kN/m3) Sr(%) su(kPa) GWT (m) qc(MPa) fs(MPa) u2(MPa)
1 2.50 86 32 43 99 CH 1.17 17.20 97 69 2.00 0.946 0.033 0.011 2 2.50 82 27 30 99 CH 1.34 17.40 100 48 0.85 0.540 0.031 −0.007 3 10.00 82 26 46 100 CH 1.20 17.07 95 71 1.50 0.996 0.050 0.137 4 3.00 81 25 38 99 CH 1.09 17.82 100 70 1.80 1.049 0.053 0.043 5 2.50 79 33 46 100 MH 1.37 17.00 100 34 1.58 0.728 0.029 0.070 6 2.50 76 33 50 81 CH 1.37 17.00 100 40 2.30 0.657 0.026 0.008 7 2.50 74 32 58 99 CH 1.37 17.41 100 36 2.35 0.661 0.019 −0.001 8 2.50 74 25 45 98 CH 1.23 17.30 99 50 2.80 0.508 0.029 0.033 9 3.95 74 27 39 100 CH 1.23 17.81 100 76 1.70 0.788 0.062 0.031 10 9.00 74 29 41 100 CH 1.69 17.80 100 82 1.70 1.010 0.081 0.008 11 4.00 73 27 41 100 CH 1.13 17.38 97 77 0.80 0.901 0.051 −0.032 12 2.50 71 30 36 100 CH 1.20 17.70 100 47 1.80 0.804 0.033 −0.001 13 3.00 71 31 37 99 CH 1.02 18.20 100 84 0.80 0.978 0.064 0.079 14 2.40 70 27 44 100 CH 0.95 18.32 99 32 1.50 0.504 0.010 −0.010 15 7.64 70 27 47 99 CH 1.24 17.12 100 46 3.40 0.804 0.021 −0.045 16 4.00 69 24 36 98 CH 0.95 18.20 100 72 2.50 1.054 0.026 0.016 17 2.50 69 28 43 100 CH 1.24 17.30 99 48 2.00 0.822 0.032 0.000 18 2.50 69 29 54 99 CH 1.28 16.99 100 40 1.40 0.367 0.022 0.004 19 2.50 68 26 43 99 CH 1.18 17.70 100 51 1.80 0.683 0.034 0.005 20 3.00 68 25 46 99 CH 1.19 17.80 100 32 0.40 0.487 0.024 0.002 21 2.50 65 31 42 94 CH 1.17 17.20 98 50 0.50 0.630 0.054 0.058 22 10.00 64 22 36 97 CH 1.47 18.00 100 62 2.80 0.856 0.044 0.035 23 2.50 62 23 49 98 CH 1.57 17.06 97 22 2.25 0.520 0.015 0.040 24 2.50 61 23 38 100 CH 1.01 17.90 100 72 0.40 0.713 0.042 0.039 25 10.00 61 22 40 99 CH 1.05 18.30 99 67 2.10 0.967 0.050 0.099 26 2.50 59 28 41 100 CH 1.01 17.18 95 44 1.00 0.612 0.043 0.038 27 2.50 58 26 44 94 CH 1.09 17.57 100 44 0.65 0.687 0.033 −0.038 28 2.50 55 19 28 99 CH 0.85 18.25 91 74 3.60 0.841 0.047 0.032 29 8.50 52 23 39 100 CH 1.12 17.60 99 44 0.85 1.016 0.036 0.014 30 2.50 52 20 38 93 CH 1.17 18.00 99 41 2.70 0.450 0.020 0.018 31 4.50 52 26 43 100 CH 1.12 17.72 100 40 1.80 0.653 0.026 0.021 32 2.50 51 26 41 96 CH 1.15 17.40 98 31 1.00 0.569 0.012 −0.016 33 2.50 51 26 38 99 CH 1.31 17.06 99 23 0.60 0.519 0.022 0.053 34 4.00 50 23 39 96 CH 1.03 17.90 100 41 0.70 0.634 0.030 0.035 35 3.00 50 22 29 95 CH 0.98 18.11 100 55 2.30 0.691 0.036 0.039 36 2.50 49 22 39 99 CI 1.04 18.08 100 32 1.85 0.731 0.024 0.011 37 7.00 49 26 36 98 CI 1.11 17.15 97 38 1.00 0.849 0.022 −0.024 38 3.10 49 22 45 99 CI 1.23 16.78 93 39 1.18 0.637 0.018 −0.014 39 2.50 48 25 45 99 CI 1.10 17.59 95 35 0.60 0.645 0.020 −0.025 40 2.50 48 22 33 97 CI 1.02 17.91 99 46 1.65 0.829 0.036 0.009 41 6.00 47 22 36 90 CI 0.88 18.75 100 54 2.00 1.100 0.037 −0.077 42 2.50 47 20 36 89 CI 0.91 18.26 100 54 1.60 0.475 0.020 −0.026 43 7.85 46 22 40 100 CI 1.09 17.71 99 65 1.18 1.135 0.030 −0.019 44 6.60 45 27 42 100 MI 1.07 17.64 98 78 2.40 0.911 0.058 0.089 45 8.50 44 29 36 99 MI 0.90 18.60 99 140 1.45 2.084 0.082 −0.030 46 10.00 44 20 30 96 CI 0.81 18.86 99 100 0.50 1.037 0.036 0.088 47 8.45 44 20 36 98 CI 0.95 18.33 100 41 1.10 0.757 0.030 0.074 48 6.00 43 21 26 72 CI 1.01 17.68 95 51 1.65 1.081 0.046 0.237 49 2.50 42 17 39 95 CI 1.17 17.40 99 38 1.10 0.485 0.024 0.066 50 6.00 42 27 38 95 MI 0.94 18.10 98 87 2.50 1.017 0.052 0.062 51 2.50 42 19 36 99 CI 0.90 19.05 100 52 1.95 0.484 0.023 0.011 52 2.90 42 17 38 100 CI 1.00 17.73 94 46 1.10 0.737 0.016 0.002 53 2.50 41 18 35 92 CI 0.92 17.91 93 41 1.90 0.889 0.049 −0.008 54 2.50 41 18 35 95 CI 0.94 17.80 95 47 2.20 0.446 0.019 0.002 55 4.00 41 25 35 96 CI 1.11 17.83 100 31 2.20 0.535 0.027 −0.054 56 3.90 41 26 45 98 MI 1.09 17.26 92 44 2.40 0.565 0.026 −0.001 57 3.04 40 19 36 97 CI 0.96 18.29 100 38 1.10 0.641 0.025 −0.038 58 10.00 39 19 33 91 CI 0.96 18.59 100 95 1.70 1.012 0.039 −0.034 59 2.50 37 25 35 70 MI 0.95 18.14 98 40 2.00 0.811 0.031 0.057 60 2.50 37 18 36 97 CI 1.04 17.50 98 30 0.80 0.616 0.025 0.019 61 11.50 35 22 33 99 CI 1.03 17.76 100 76 0.60 1.772 0.078 0.013 62 2.50 35 26 37 93 MI 0.92 18.37 100 41 0.90 0.580 0.027 0.073 63 6.12 35 22 32 98 CI 0.82 18.99 99 63 1.10 1.386 0.045 −0.080 64 2.50 34 NP 35 97 ML 0.91 18.77 100 59 2.10 1.546 0.014 −0.035 65 4.00 34 NP 41 66 ML 0.77 19.72 100 87 1.90 2.236 0.042 0.051 66 3.50 34 22 28 74 ML 0.93 18.30 100 41 1.30 1.052 0.015 −0.022 67 3.00 34 21 36 99 CL 0.92 18.34 100 71 2.70 1.244 0.039 0.008 68 2.50 33 NP 34 96 ML 0.94 18.14 97 48 2.20 1.816 0.055 0.017 69 2.50 32 NP 36 80 ML 0.95 18.43 100 33 1.00 1.110 0.030 0.048 70 1.30 32 20 34 78 CL 0.84 18.85 100 44 1.10 1.665 0.008 −0.012 71 2.77 32 18 37 93 CL 0.92 18.46 100 26 0.50 0.813 0.006 −0.079 72 4.50 32 23 38 92 CL 1.17 17.49 100 23 0.50 0.802 0.004 −0.065 73 2.50 31 NP 35 98 ML 0.89 19.10 100 62 0.40 1.343 0.032 0.017 74 6.05 31 24 30 96 ML 0.98 18.45 100 77 1.18 2.418 0.048 −0.082
shear strength from cone penetration parameters. These relationships can be classified into four main categories based on total cone re-sistance, net cone rere-sistance, effective cone resistance and excess pore water pressure. The equations resulting from these approaches are si-milar to the theoretical solution ofTerzaghi (1943).
Investigations that have focused on the estimation of these empirical factors in order to define the undrained shear strength suare numerous
(Keaveny and Mitchell, 1986;Konrad and Law, 1987;Yu and Mitchell, 1998). There is no consensus among the researchers on the value of the factors witnessed by large scatter.Kulhawy and Mayne (1990)studied the calibration procedures for cone factors in the laboratory and stated that there are several factors that affect the value of empirical cone factors such as testing and sampling methods, direction of loading, strain rate, boundary conditions, stress level as well as disturbance effects. On the other hand, there are several tests for measuring the undrained shear strength in the laboratory such as unconfined, triaxial and vane whose results can be employed for comparison with the CPT data (Jamiolkowski et al., 1985;Kulhawy and Mayne, 1990).
Undrained shear strength of normally consolidated clays is measured by using the unconsolidated undrained triaxial test (UU) (Bishop and Henkel, 1962), laboratory vane test (Blight, 1968;Matsui and Abe, 1981; Chandler, 1988), pocket penetrometer (ASTM WK27337, 2010) and falling cone (Tanaka et al., 2012). The UU test (quick) (Head and Epps,
2011), which is considered ideal for saturated normally consolidated clays, was employed in this study. At least two samples are tested at different confining pressures in this test. When the sample is removed from the UD tube, it is under an isotropic negative stress (σ' = −ue)
(Holtz et al., 2011). It retains its integrity after extraction under the effect of this negative pore water pressure, which enables it to ‘stand’. Under the applied cell pressure, the isotropic total stress (σcell= σ3) will be
re-sisted by the pore water pressure generated: σcell= σ3= Δuw. In the UU
test, consolidation of the sample is not allowed and shearing is carried out immediately upon raising of the confining pressure in undrained condition and the deviator stress causing the yield of the sample is measured. The test is repeated at a higher cell pressure. Although the cell pressures in consecutive tests are increased, the effective stress remains constant at -ue. Consequently, the undrained strength will be
in-dependent of the cell pressure since it is a function of the effective stress. Accordingly, if three specimens are tested at different cell pressures, three stress circles having with identical diameters will be obtained providing a horizontal failure envelope (Skepton, 1948). The expression for shearing resistance (su) expressed as;
= +
su cu tan u (2)
where cuis the undrained shear strength, σ is the vertical total stress and ϕu is the angle of undrained shearing resistance. Total stress will
Table 1 (continued)
ID Depth (m) wL wP wn FC% CLASS e0 γn(kN/m3) Sr(%) su(kPa) GWT (m) qc(MPa) fs(MPa) u2(MPa)
75 2.05 31 21 35 94 CL 0.87 18.43 97 57 0.50 1.710 0.007 −0.077 76 2.50 30 NP 33 88 ML 0.82 19.50 100 38 0.70 1.459 0.030 0.023 77 10.00 30 20 26 94 CL 0.73 19.04 97 60 1.60 1.214 0.031 0.019 78 2.00 29 NP 28 82 ML 0.84 18.96 98 28 1.35 0.778 0.001 −0.012 79 2.50 28 NP 39 76 ML 0.90 18.50 99 30 1.80 0.591 0.011 −0.004 80 2.50 27 NP 34 88 ML 0.88 19.06 100 39 2.30 1.379 0.019 −0.011 81 2.50 NP NP 37 76 ML 0.84 19.40 98 35 2.10 0.915 0.003 0.014 82 2.50 NP NP 30 81 ML 0.68 19.59 100 35 2.00 1.016 0.009 −0.033 83 0.20 NP NP 30 55 ML 0.73 19.42 100 49 5.00 1.440 0.030 0.001
wL: liquid limit, wP: plastic limit, wn: natural water content, FC: fines content, CLASS: soil class according toTS1500 (2000), e0: void ratio, γn: unit weight, Sr: saturation ratio, su: undrained shear strength, GWT: ground water table, qc: cone resistance, fs: sleeve friction, u2: pore pressure behind cone.
Table 2
Variations in Nkvalues with reference to the type of laboratory test performed.
Researcher/s Soil type Reference test/s Nk
Sanglerat (1972) Normally consolidated clays 15–21
Stiff clays 22–26
Anagnostopoulos (1974) Soft silty clays UU 17
Kjekstad et al. (1978) Non-fissured overconsolidated clays UU 17
Lunne and Kleven (1981) Normally consolidated marine clays FVT 11–19
Tumay et al. (1982) Mississippi deltaic deposits 6.7
Meigh (1987) Normally consolidated clays 15–21
Stiff fissured overconsolidated clays 27 ± 3
Zervogiannis et al. (1987) Alluvial deposits UU 18
Nevels Jr (1989) Alluvial soils, highly plastic, firm to stiff UU 39
Clays tends to be come soft with depth PMT 34
Stark and Delashaw (1990) Non-fissured normally to lightly OC clays UU 8.5–16.5
Koukis et al. (1997) Soft silty clays, in Patras, Greece UU 19
Eid and Stark (1998) Soft to stiff, saturated glacial clays UCS 15.5
Jörß (1998) Marine clays 20
Boulder clays 15
Chen (2001) Three test sites in Malaysia 5–12
Sabatini et al. (2002) Beaumont Formation-Houston Area UU, CU, DMT 19
Montgomery Formation-Houston Area UU, CU, DMT 23
Ricceri et al. (2002) Venice lagoon soils UU 11–25
Anagnostopoulos et al. (2003) Alluvial deposits of Greece UU vs electrical cone 17.2
Alluvial deposits of Greece UU vs mechanical cone 18.9
Gebreselassie (2003) For different soil types – 7.6–28.4
Önalp et al. (2006) Adapazarı NL/lightly over consolidated clays UU 14.55
Hong et al. (2010) Busan clay, Korea (25% < Ip< 40%) TX 7–20
Almeida et al. (2010) High plasticity, soft clay, (42% < Ip< 400%) FVT 4–16
Rémai (2013) Soft Holocene clays, Hungary UC, CU 18.6
transform to su= cubecause ϕu= 0. This is known as the ϕu= 0
con-dition and the parameter obtained is defined as the undrained shearing resistance, su.
A survey of the literature on the subject indicated that no significant study has been done to evaluate undrained shear strength parameter with reference to soil classification by the use of CPT data.
2. Properties of Adapazari soils and the database
The studied soils consist of fluvial deposits that were transported to the Adapazari plain (Turkey) by River Sakarya that flows along the eastern border of the city Adapazari nowadays. These soils were de-posited during the Holocene and are normally consolidated to lightly overconsolidated (OCRavg≈ 3) at shallow depth (Bol, 2013; Özocak
et al., 2013) with sensitivities rising to 1.94 (Arel and Özocak, 2005). There are studies that investigated the distribution and origins of the soils on the Adapazari plain (Bol, 2003;Bol et al., 2010; Bol, 2012) which showed that all the sub-facies that could be found in a typical floodplain are present throughout the soil profile.
A rich database named “Adapazarı Soil Database” collected from test results from the plain, the site of the catastrophic earthquakes of 1999, has been used for this research. This database has been established with
information collected from several research projects (Bray et al., 2001; Bol et al., 2013;Önalp et al., 2007;Önalp et al., 2010). Disturbed and undisturbed samples were taken at several depths of boreholes and tested in the laboratory. Information on soil classification tests, triaxial tests and cone penetration data have been taken from the database at levels where undrained shear strengths are available. Additional soundings by using a 200 kN acoustic CPTu equipment and boreholes have also been performed to complement the available data.Table 1 summarizes the results of the available laboratory and field work. 3. Methods
Undrained shear strength (su) using “total” cone resistance from
cone penetration test data is calculated with the following equation.
= s q N ( ) u c vo k (3)
where Nkis an empirical cone factor and σvois the total in-situ vertical
stress. Table 2 presents the values for Nk, proposed by various
in-vestigators. The table indicates a wide variation in the values. Evalu-ating the data used in this study (Table 1) Nkwas found to vary between
8 and 37 as depicted inFig. 1a.
The corrected total cone resistance qtis given by
= + ×
qt qc (1 a) u2 (4)
Here, a = area ratio of the cone (two different cones with area ratios (a) of 0.58 and 0.60 have been used in this study) and u2= pore pressure
measured behind the cone. Thus, the cone factor is redefined as:
= N q s ( ) kt t vo u (5)
A summary of the findings of several researchers for Nktis given in
Table 3. This table shows variations of Nktvalues with reference to the
type of laboratory test used and it is clear that no definite value for Nkt
can be extracted from the data. Similarly, total cone resistance was
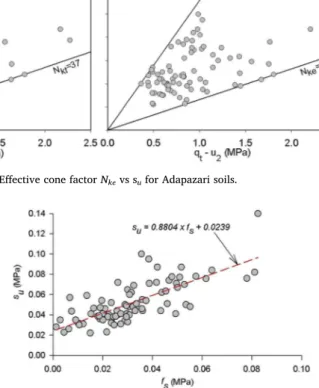
Fig. 1. (a) Cone factor Nkvs su; (b) Cone factor Nktvs su; and (c) Effective cone factor Nkevs sufor Adapazari soils.
Table 3
Variations of Nktvalues with type of laboratory test used for reference.
Researcher Soil and test types Nkt
Lunne et al. (1985) North Sea soils, CAUC triaxial 9–20
Aas et al. (1986) su(lab)= (su(c)+ su(d)+ su(e))/3a, 3% < IP< 50%
8–16
La Rochelle et al.
(1988) FVT, no relationship with Ip 11–18
Rad and Lunne (1986) su(c) 8–29
Powell and Quertman
(1988) ssu(c)u(c)(in fissured clays) 10–2010–30 Senneset et al. (1989) For normally consolidated clays 10–15
For overconsolidated clays 15–19
Luke (1995) Danish Clays, CAUC 8.5–12
Tanaka and Tanaka
(1996) UCSFVT 8–169–14 Fukasawa and Kusakabe (2001) DST-1/UCT/FVT 10.8/13/11.6 Fukasawa et al. (2004) UCS, DST, DST-1,2,3 12 Karakouzian et al.
(2003) Under consolidated marine clay, FVT 10–15 Lunne et al. (2005) Soft to firm clays, su(c) 12
Önalp et al. (2006) UU (su(c)) 7–29
Low et al. (2010) 3 onshore and 11 offshore clays, su(c) 11.9
Rémai (2013) UC, CU 17–32
Mayne et al. (2015) 51 soft to firm intact clays, CAUC 11.8 a s
u(c): triaxial compression, su(d): triaxial extension, su(e): direct simple shear,
DST: direct shear test, FVT: field vane test, IP: plasticity index, UCS: unconfined compression test, CAUC: anisotropically-consolidated-undrained test.
found to vary between 8 and 37 (Fig. 1b) by the evaluation of the data inTable 1. Additionally,Fig. 1b indicates that cone factors calculated with corrected cone resistances (Nkt) were not noticeably different from
the uncorrected values.
According toCampanella et al. (1982), sucan be calculated by using
effective cone resistance (qe);
= = s q N q u N ( ) u e ke t ke 2 (6) Lunne et al. (1985)showed that effective cone factor (Nke) varies
between 1 and 13 and developed a correlation for Nkeand Bq.Karlsrud
et al. (2005)developed correlations for the estimation of Nke, taking
into account the sensitivity of the soil (St) and the pore pressure
coef-ficient Bqand proposed
= <
Nke 11.5 9.05Bq for St 15 (7)
= >
Nke 12.5 11.0Bq for St 15 (8)
Pore pressure ratio (Bq) can be calculated as;
= = B u q u u q q t vo t vo 2 0 (9) where σvo= in-situ total vertical stress, u0= in-situ equilibrium water
pressure, u2= pore water pressure measured behind the cone, Δu = excess pore water pressure measured during penetration (u2-u0). Nkevalues were found to vary between 9 and 38 (Fig. 1c) for Adapazari
soils.
Lunne et al. (1997)reported the relationships that have been pro-posed for the induced excess pore pressure Δu and the undrained strength. These relationships have a general form of
= =
s u
N ( u u u)
u
u 2 0 (10)
NΔuis found to vary between 2 and 20 based on cavity expansion
theory.Lunne et al. (1985)used triaxial compression (CAUC) test re-sults and found a reliable correlation for pore water pressure ratio (Bq),
with corresponding NΔuvalues varying between 4 and 10. Karlsrud
et al. (1996)similarly used CAUC test results to obtain a relationship between suand NΔuwhere they showed that NΔuvaried between 6 and
8.La Rochelle et al. (1988), using uncorrected field vane (FVT) as re-ference strength, found that NΔuvaried between 7 and 9 for three
Ca-nadian clays, even though OCR ranged between 1.2 and 5.0.Ricceri et al. (2002)proposed Eq.(11)to express the relationship between NΔu
and Bqfor alluvial deposits of the Venice Lagoon.
= × +
Nu 18.6 Bq 0.13 (11)
Begemann (1965)was the first to suggest that the undrained shear strength (su) in clayey soils can be estimated from sleeve friction (fs). He
demonstrated that the undrained shear strength measured in the vane
Fig. 3. The influence of physical properties on Nkt.
Fig. 4.Sowers (1979)chart to estimate undrained shear strength from SPTN.
test was 1/14th of the tip resistance measured by the mechanical cone while the sleeve resistance has almost the same value with the su
measured in the FVT. According toAnagnostopoulos et al. (2003)the fs/ suratio is 1.26 and 1.00 for the mechanical and the electrical cones,
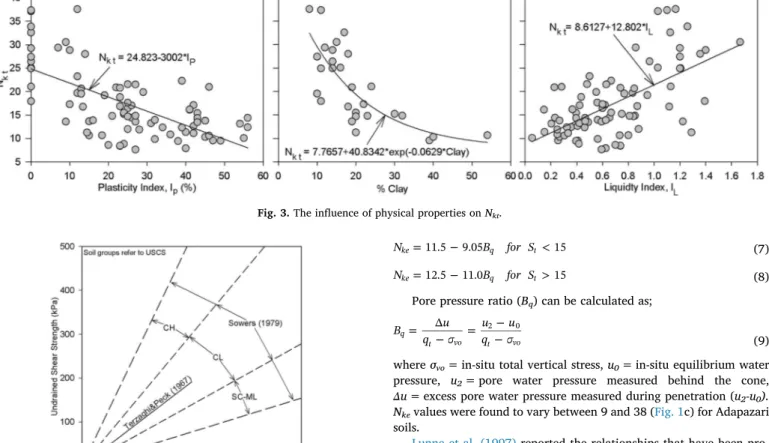
respectively. This ratio was determined to be 0.608 for Adapazari soils. Fig. 2shows the the relationship between sleeve friction (fs) and
undrained shear strength (su) from TX-UU test with a coefficient of
determination R2= 0.536 for Adapazari soils. One can express the
following relationship for Adapazari soils where suand fsare in MPa.
= × +
su 0.8804 fs 0.0239 (12)
According to Powel and Lunne (2005) undrained shear strength obtained from the frictional resistance represents the remoulded un-drained strength. Because of this, unun-drained shear strength from sleeve friction may have incorrect values.
Available evidence shows that estimating the undrained strength value from CPTu readings shows a high scatter, regardless of the method used to estimate it. The reason for this may possibly be that suis
not the only parameter representing strength. It is likely that the type of soil, penetration rate and the effect of type of test used for reference may influence the results (Senneset et al., 1989). The index properties of the samples used to obtain their correlation with Nktare shown in
Fig. 3. The value of Nktdrops with increasing plasticity index and clay
content and decreasing liquidity index. This finding suggests that the class of the soil may be directly influencing the cone factors. Accord-ingly, it was decided to place emphasis on determining the class of soil. A study conducted bySowers (1979)to analyze the undrained shear strength deduced from standard penetration test (Fig. 4) shows that each of the main soil groups such as CH, CL, SC and ML (ASTM D2487-17, 2017) should processed with different factors. The use of a soil type dependent factor reduces the error margin, instead of using an average trend line. This study uses a similar attempt to relate shear resistance to CPTu data.
The Turkish Standard for soil classification TS 1500/2000, separates fine grained soils into three regions as of low (wL< 35), intermediate
(35 < wL< 50) and high plasticity (wL> 50) on the plasticity chart.
This enables the investigator to evaluate soils of intermediate plasticity as a different group whereby the wide band for soils of low plasticity (CL) increases the error margins in the Sowers Chart.
When the values of undrained shear strength measured in the la-boratory are plotted against the CPT data for each soil group (Fig. 5), distinct zones arise similar to the Sowers Chart. By evaluatingFig. 5, it can be seen that as the liquid limit increases, cone factors decrease. It can thus be inferred that different soil classes are indeed clustered in separate regions. Accordingly the type of a soil can be determined through CPT measurements, despite the fact that no samples are ob-tained in this test.
Initial studies to classify soils with cone penetrometer were carried out by using cone resistance (qc) and sleeve friction (fs), without
cor-recting them for the effect of porewater pressure or overburden pres-sure (Begemann, 1965).Sanglerat et al. (1974)argued that the friction ratio (Rf= fs/qc) and the cone resistance are functions of the class of
soil. Friction ratios (Rf) are more commonly used in classification than
sleeve friction (fs) alone. The early classifications were mostly carried
out with the aid of pre-prepared charts (Begemann, 1965; Sanglerat et al., 1974;Schmertmann, 1978;Douglas and Olsen, 1981;Jones and Rust, 1982;Senneset et al., 1989;Eslami and Fellenius, 1997). It ap-pears that Robertson's charts (Robertson et al., 1986;Robertson, 1990) are the most favoured.
In addition to these, studies on soil classification in recent years have mainly been aimed at defining the “Soil Behavior Type Index” Ic,
for which the normalized cone resistance (Q), normalized friction ratio (F) and a pore pressure coefficient (Bq) are used. A summary of the cited
formulae for Icis given inTable 4. In this table,Robertson and Wride
(1998) formula appears again as the most popular. Robertson and Wride (1998)proposed the use of the normalized penetration resistance
Q (dimensionless) and the normalized friction ratio F (in per cent) to
calculate the Icvalues as = Q q P P c vo a a vo n 2 (13) = F f q 100 s c vo (14)
where σvoand σ'voare the total and effective overburden stresses
re-spectively. Pais the reference pressure with the same units used in Eq.
(13)(i.e. Pa= 100 kPa if σ'vois in kPa) and Pa2is the reference pressure
with the same units as qcand σvoused in Eq.(13)(i.e. Pa= 0.1 MPa if qc
and σvoare in MPa).
The soil behavior indices in this study were calculated using all the proposed formulas and each sample was grouped according to its soil behavior index. The CPT data and the undrained shear strengths mea-sured in the laboratory were then plotted using these soil groups. Cone factors appeared to be more consistent for the groups with similar Ic, as
shown inFig. 6.
The average of the upper and lower limit values of each group of similar soil behavior indices (Ic) were selected as cone factors. The error
margin emerged to be narrower this way, compared to the case if all data were evaluated and no distinction for the soil classes was made.
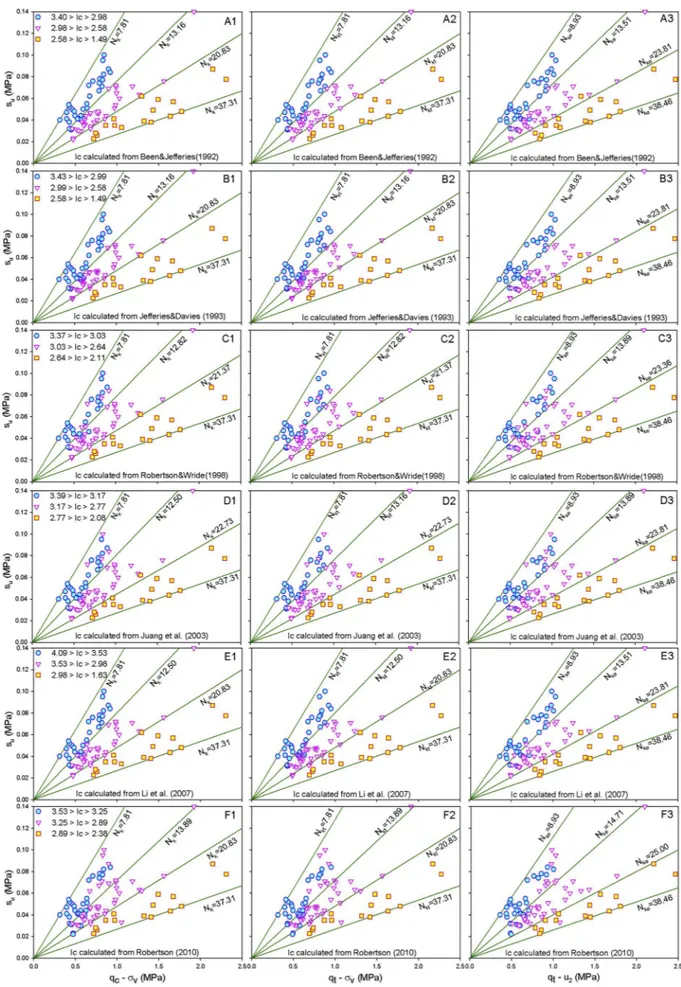
Fig. 6(A1) shows the suvalues measured in the laboratory against
the total cone resistance (qc-σvo). These points were grouped by their Ic
values calculated by the formula ofJefferies and Davies (1993). The Nk
values corresponding to these Icvalues were determined drawing the
boundaries between these groups. Thus, the average Nkvalue for the
soils with 3.29 > IcJD> 2.59 can be taken as Nk= (7.81 + 13.16)/
2 = 10.49. Similar evaluations are presented inTable 5for both Nktand Nkeaccording to the Icformulae proposed by other researchers quoted. 3.1. Soil classification by using pore pressure gradients (i)
Bol (2013)showed that the changes in the pore water pressures (i) during a CPTu test is closely related to the type of soil and proposed that parameter i is a better alternative to the other methods used for classifying soils through the use of CPT measurements. The parameter i representing the pore water pressure gradients along the soil profile during penetration is a dimensionless number describing the changes in
Table 4
A summary of the proposed formulas for Ic.
Been and Jefferies (1992) Ic= {3 log[ (1Q Bq)+1]}2+[1.5+1.3(log )]F 2 (15) Jefferies and Davies (1993) Ic= {3 log[ (1Q Bq)]}2+[1.5+1.3(log )]F 2 (16)
Robertson and Wride (1998) Ic= [3.47 log ]Q2+[1.22+log ]F2 (17)
Juang et al. (2003) Ic= [3.47 logqc N1 ]2+[1.22+log ]F2 (18)
Li et al. (2007) Ic m, = {3.25 log[ (1Q Bq)]}2+[1.5+1.3(1+log )]F 2.25 (19)
Robertson (2010) ISBT= [3.47 log( / )]q pc a 2+[1.22+logRf]2 (20)
pore water pressures during flight. = = i u u u ( ) vo vo vo 2 2z 2z z z 2 1 2 1 (22)
where z1and z2are the start and end depths of the studied layer in the
soil profile, u2z2and u2z1are the pore water pressures corresponding to
depths z2and z1, and σvoz2and σvoz1are the calculated total overburden
stresses at these depths.
It was found that the parameter i increased with increasing liquid limit, while decreasing with increasing grain size. In addition, i as-sumed negative values for soils of dilative character such as silts.Bol (2013)suggested intervals of soil type behaviour index (Ic, Eq. (21))
Table 5
The limits for Nk, Nktand Nkebased on different soil type behavior index (Ic).
Iccalculated from Icintervals Nk(1⁎) Nkt(2⁎) Nke(3⁎)
Lower Upper Average Lower Upper Average Lower Upper Average
Been and Jefferies (1992)(Aa) 3.40–2.98 7.81 13.16 10.49 7.81 13.16 10.49 8.93 13.51 11.22
2.98–2.58 13.16 20.83 17.00 13.16 20.83 17.00 13.51 23.81 18.66
2.58–1.49 20.83 37.31 29.07 20.83 37.31 29.07 23.81 38.46 31.14
Jefferies and Davies (1993)(Ba) 3.43–2.99 7.81 13.16 10.49 7.81 13.16 10.49 8.93 13.51 11.22
2.99–2.58 13.16 20.83 17.00 13.16 20.83 17.00 13.51 23.81 18.66
2.58–1.49 20.83 37.31 29.07 20.83 37.31 29.07 23.81 38.46 31.14
Robertson and Wride (1998)(Ca) 3.37–3.03 7.81 12.82 10.32 7.81 12.82 10.32 8.93 13.89 11.41
3.03–2.64 12.82 21.37 17.09 12.82 21.37 17.09 13.89 23.36 18.63 2.64–2.11 21.37 37.31 29.34 21.37 37.31 29.34 23.36 38.46 30.91 Juang et al. (2003)(Da) 3.39–3.17 7.81 12.50 10.16 7.81 13.16 10.49 8.93 13.89 11.41 3.17–2.77 12.50 22.73 17.61 13.16 22.73 17.94 13.89 23.81 18.85 2.77–2.08 22.73 37.31 30.02 22.73 37.31 30.02 23.81 38.46 31.14 Li et al. (2007)(Ea) 4.09–3.53 7.81 12.50 10.16 7.81 12.50 10.16 8.929 13.51 11.22 3.53–2.98 12.50 20.83 16.67 12.50 20.83 16.67 13.51 23.81 18.66 2.98–1.63 20.83 37.31 29.07 20.83 37.31 29.07 23.81 38.46 31.14 Robertson (2010)(Fa) 3.531–3.248 7.81 13.89 10.85 7.81 13.89 10.85 8.93 14.71 11.82 3.248–2.886 13.89 20.83 17.36 13.89 20.83 17.36 14.71 25.00 19.85 2.886–2.381 20.83 37.31 29.07 20.83 37.31 29.07 25.00 38.46 31.73
a These numbers and letters indicate that graph numbers inFig. 6.
Table 6
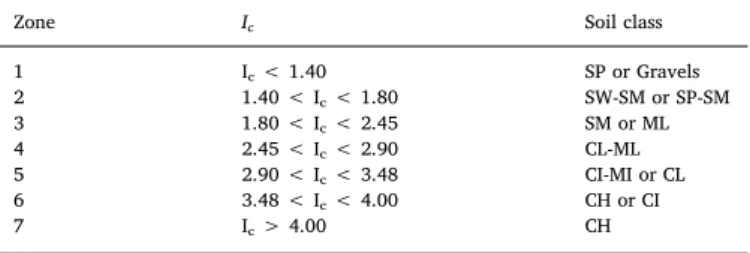
Soil classes identified by Icvalues (Bol, 2013).
Zone Ic Soil class
1 Ic< 1.40 SP or Gravels 2 1.40 < Ic< 1.80 SW-SM or SP-SM 3 1.80 < Ic< 2.45 SM or ML 4 2.45 < Ic< 2.90 CL-ML 5 2.90 < Ic< 3.48 CI-MI or CL 6 3.48 < Ic< 4.00 CH or CI 7 Ic> 4.00 CH
corresponding toTS1500 (2000)soil classes (Table 6). The difference of this method from the others is to identify soil class directly from la-boratory test results.
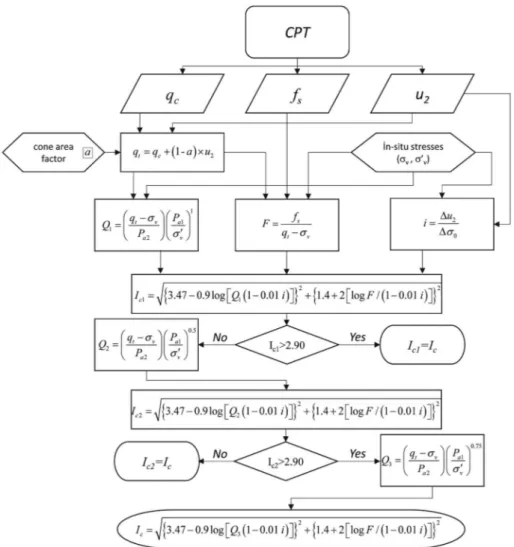
The procedure for calculating the parameter i is demonstrated in the example profile illustrated inFig. 7. The CPT data taken fromTable 1 for ID = 33 (2.50 m) and ID = 61 (11.50 m) were used. The data sug-gested that the samples denoted by 33 and 61 corresponded to depths 2.50–2.88 m and 11.68–11.90 m, and the excess porewater pressures measured in this range are listed inTable 7. According toBol (2013), parameter i should not be used in transition zones because sudden drops may occur at these boundaries. The procedure for calculating i needs a careful choice of calculation boundaries.
A procedure similar to that described by Robertson and Wride (1998)was employedTable 7to calculate the Icvalues with Eq. (21). In
this procedure, normalized penetration resistance Q is calculated by using the corrected total cone resistance qtinstead of qcinRobertson
and Wride (1998)formula.
= Q q P P t vo a a vo n 2 (23)
They stated that it will be appropriate to adopt n = 1 if IcR& W(1998)> 2.60 for clays but n will be 0.5 for sandy soils with IcR& W(1998)< 2.60, in modifying the value of Ic. However, Bol (2013)
showed that the border separating clays and sands is actually Ic= 2.90
as shown inFig. 8.
The procedure is as follows: Calculate Q using Eq. (20) with n = 1. Use the calculated Q to calculate Icwith Eq. (18). This value is used for
classification if Ic> 2.90. In case Ic< 2.90, take n = 0.50 to repeat
the first step. If Iccomes out smaller than 2.90, this second estimate is
used for classification. However, if Ic> 2.90 adopt n = 0.75 to get the
final value of Q and the Icrelated to it.
The flow chart illustrating the procedure (Bol, 2013) is presented in Fig. 9. The results of classification for the data listed inTable 1are summarized inTable 8.
Following the above procedure, the Iccalculated by Eq. (18) were
used to correlate the sumeasured in the laboratory with the CPTu data.
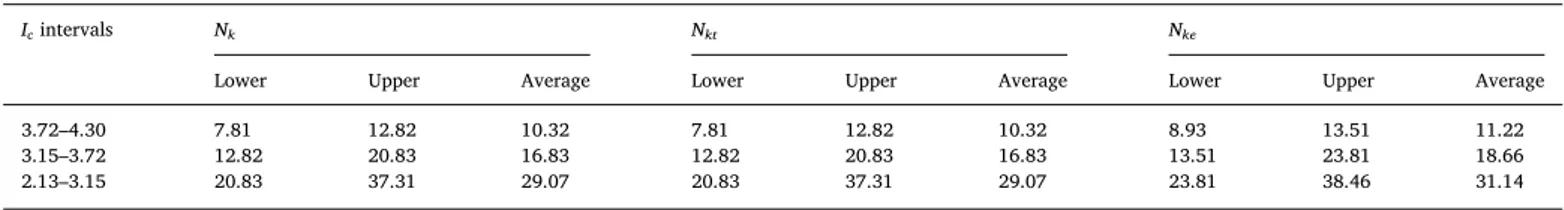
The Icvalues calculated according toBol (2013)are divided into groups
with lower and upper limits as shown inFig. 10. The averages of the limits for each soil group have been selected as cone factors Nk, Nktand Nke. The maximum, minimum, and average cone factors for all ranges of Icare shown inTable 9.
Tables 5 and 9show that the values of Nkand Nktare similar. The
reason for this is that the measured pore pressures (u2) are not so high
and cone resistance (qc) is always much higher than u2for soils studied.
Thus, cone resistance correction for measured pore pressure has a negligible influence on the distribution of data points.
Fig. 11shows the correlation of the undrained shear strength cal-culated using the average cone factors for each range of Iclisted in
Table 9with the undrained shear resistance. It is seen that all the points are clustered in the immediate vicinity of the x = y line with reasonably high R2values.
4. Sensitivity analysis
In order to confirm the robustness of the developed procedure, it is important to test the proposed models using performance evaluation criteria such as the correlation coefficient (R2), the mean absolute
re-lative error (AARE) and the mean square error (MSE).
Average absolute relative error (AARE) can be computed with the expression
Table 7
Example calculation of i by using ID:33 and ID:61 data.
ID Depth (m) qc(MPa) (avg.) fs(MPa) (avg.) u2(MPa) (avg.) z1(m) z2(m) σ0z1(MPa) σ0z2(MPa) u2z1(MPa) u2z2(MPa) i Ic
33 2.50 0.519 0.022 0.053 2.50 2.88 0.04500 0.05184 0.041 0.065 3.509 3.581
61 11.50 1.772 0.078 0.013 11.68 11.90 0.21024 0.21420 0.010 0.015 1.263 3.691
= = AARE N RE 1 | | p N 1 (24) in which = × RE s s s 100 um ue um (25)
Here, RE is the relative error in percent, sumis the measured
un-drained shear strength, sueis the estimated undrained shear strength
and N is the total number of data points. The mean square error (MSE) is defined as,
= = MSE N s s 1 ( ) i n um ue 1 2 (26) The AARE enables not only the prediction of the undrained shear strength, but also the distribution of prediction errors. Ideally, the value of AARE and MSE should be zero and R2should be equal to unity.
Table 10lists the intervals of Icobtained by using the formulae of
different researchers and the results of their statistical analyses. It is ob-vious that the estimated suvalues evaluated with the methods described
above reflect the measured suvalues reasonably well.Robertson (2010)
formula (Eq. (20)) gave results that did not conform with the general trend. Table 10 indicates that the formulae proposed byJefferies and Davies (1993),Been and Jefferies (1992),Li et al. (2007)andBol (2013) for calculating undrained strength using Icfrom CPTu produced results
which showed better agreement with the sumeasured in the laboratory.
The common approach by the researchers above is the use of the pore water pressure values from CPTu in the expressions they developed for Ic.
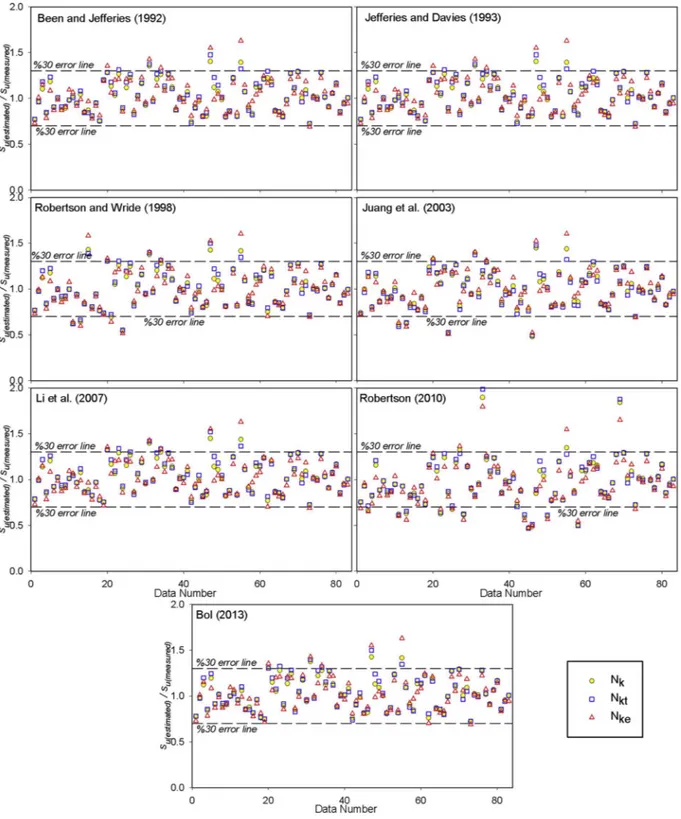
The discrepancy ratio Dr= sum/sue was employed to evaluate the
method proposed in this paper by an alternative approach. The dis-crepancy ratio (Dr) will be unity if the measured undrained shear
strength (sum) is equal to the estimated undrained shear strength (sue), as
desired.Fig. 12shows discrepancy ratios for all estimated suvalues
ob-tained by all Icintervals. Data points ofJefferies and Davies (1993),Been
and Jefferies (1992),Li et al. (2007)andBol (2013)methods have only a negligible number of data points being located outside the 30% error band. The proposed methodology to evaluate undrained shear strength from CPTu data is believed to provide accurate and reliable results.
Multiple linear regression analyses (MLRA) have been performed to show the relation between physical properties and the formulations of Ic
Table 8
Calculated i and Icvalues.
ID u2z1(MPa) u2z2(MPa) σvoz1(MPa) σvoz2(MPa) i Ic ID u2z1(MPa) u2z2(MPa) σvoz1(MPa) σvoz2(MPa) i Ic
1 0.012 0.010 0.0439 0.0508 −0.292 3.363 43 −0.021 −0.017 0.1411 0.1440 1.389 3.424 2 −0.018 0.001 0.0529 0.0576 4.060 3.883 44 0.083 0.102 0.1195 0.1206 17.593 4.167 3 0.116 0.138 0.1800 0.1890 2.444 3.904 45 −0.026 −0.003 0.1512 0.1591 2.904 3.535 4 0.035 0.054 0.0576 0.0630 3.519 3.657 46 0.076 0.117 0.1800 0.1858 7.118 3.755 5 0.068 0.071 0.0457 0.0482 1.190 3.483 47 0.073 0.075 0.1494 0.1516 0.926 3.835 6 0.008 0.007 0.0421 0.0504 −0.121 3.583 48 0.204 0.227 0.1102 0.1170 3.363 3.610 7 −0.004 0.000 0.0439 0.0479 1.010 3.403 49 0.053 0.074 0.0558 0.0616 3.646 3.814 8 0.025 0.039 0.0457 0.0522 2.160 3.946 50 0.062 0.052 0.1127 0.1217 −1.111 3.819 9 0.029 0.032 0.0767 0.0788 1.389 4.082 51 0.009 0.014 0.0450 0.0540 0.556 3.856 10 0.002 0.015 0.1692 0.1724 4.012 4.294 52 0.000 0.005 0.0551 0.0576 1.984 3.184 11 −0.032 −0.032 0.0731 0.0760 0.000 3.764 53 −0.012 −0.006 0.0313 0.0360 1.282 3.676 12 −0.005 0.002 0.0439 0.0511 0.972 3.553 54 0.001 0.003 0.0508 0.0522 1.389 3.816 13 0.045 0.117 0.0540 0.0612 10.000 3.848 55 −0.056 −0.052 0.0814 0.0853 1.010 4.042 14 −0.017 −0.007 0.0369 0.0432 1.587 3.232 56 −0.010 0.007 0.0702 0.0738 4.722 3.886 15 −0.045 −0.045 0.1278 0.1350 0.000 3.596 57 −0.040 −0.037 0.0522 0.0576 0.556 3.613 16 0.009 0.020 0.0637 0.0713 1.455 3.257 58 −0.040 −0.030 0.1710 0.1782 1.389 3.834 17 −0.004 0.003 0.0446 0.0522 0.926 3.514 59 0.045 0.068 0.0461 0.0482 10.648 3.573 18 −0.001 0.008 0.0544 0.0572 3.125 4.090 60 0.011 0.025 0.0457 0.0540 1.691 3.536 19 0.003 0.006 0.0385 0.0475 0.333 3.684 61 0.010 0.015 0.2102 0.2142 1.263 3.690 20 −0.001 0.004 0.0565 0.0590 1.984 3.784 62 0.075 0.071 0.0508 0.0544 −1.111 3.646 21 0.045 0.074 0.0342 0.0432 3.222 3.946 63 −0.080 −0.079 0.1102 0.1116 0.694 3.448 22 0.030 0.039 0.1807 0.1850 2.083 4.099 64 −0.013 −0.045 0.0454 0.0540 −3.704 2.598 23 0.029 0.043 0.0472 0.0511 3.535 3.483 65 0.060 0.045 0.0781 0.0810 −5.208 2.895 24 0.035 0.044 0.0479 0.0544 1.389 3.718 66 −0.028 −0.015 0.0846 0.0929 1.570 2.982 25 0.055 0.140 0.1764 0.1818 15.741 4.142 67 0.006 0.010 0.0558 0.0583 1.587 3.329 26 0.023 0.045 0.0450 0.0511 3.595 3.932 68 0.023 0.013 0.0403 0.0439 −2.778 3.083 27 −0.041 −0.038 0.0547 0.0619 0.417 3.682 69 0.044 0.050 0.0486 0.0590 0.575 3.141 28 0.003 0.036 0.0443 0.0504 5.392 3.841 70 −0.012 −0.026 0.0238 0.0248 −12.963 2.137 29 0.005 0.028 0.1490 0.1544 4.259 3.673 71 −0.085 −0.075 0.0482 0.0522 2.525 2.786 30 0.009 0.023 0.0504 0.0558 2.593 3.874 72 −0.068 −0.062 0.0810 0.0853 1.389 2.743 31 −0.001 0.040 0.0828 0.0900 5.694 3.769 73 0.028 0.010 0.0421 0.0439 −10.000 2.914 32 −0.021 −0.012 0.0513 0.0576 1.429 3.235 74 −0.082 −0.082 0.1062 0.1084 0.000 2.910 33 0.041 0.065 0.0450 0.0518 3.509 3.569 75 −0.074 −0.079 0.0338 0.0378 −1.263 2.168 34 0.031 0.039 0.0886 0.0972 0.926 3.813 76 0.022 0.023 0.0450 0.0472 0.463 2.929 35 0.038 0.036 0.0479 0.0580 −0.198 3.773 77 0.012 0.033 0.1717 0.1778 3.431 3.515 36 0.007 0.012 0.0457 0.0490 1.543 3.426 78 0.003 −0.018 0.0299 0.0353 −3.889 2.442 37 −0.055 0.022 0.1285 0.1336 15.278 3.614 79 −0.001 0.000 0.0490 0.0511 0.463 3.176 38 −0.018 −0.009 0.0619 0.0648 3.125 3.412 80 −0.011 −0.013 0.0486 0.0540 −0.370 2.875 39 −0.031 −0.019 0.0425 0.0475 2.381 3.351 81 0.029 0.003 0.0443 0.0486 −6.019 2.482 40 0.009 0.009 0.0450 0.0540 0.000 3.557 82 −0.027 −0.041 0.0385 0.0414 −4.861 2.735 41 −0.079 −0.077 0.1080 0.1170 0.222 3.588 83 0.000 −0.001 0.0054 0.0097 −0.231 2.806 42 −0.031 −0.025 0.0486 0.0540 1.111 3.769
Fig. 10. Determination of undrained strength based on soil type behavior index (Icdefined byBol (2013)).
Table 9
The limits for Nk, Nktand Nkebased on soil type behavior index according toBol (2013).
Icintervals Nk Nkt Nke
Lower Upper Average Lower Upper Average Lower Upper Average
3.72–4.30 7.81 12.82 10.32 7.81 12.82 10.32 8.93 13.51 11.22
3.15–3.72 12.82 20.83 16.83 12.82 20.83 16.83 13.51 23.81 18.66
proposed by different investigators. The dependent variable was the soil behaviour index (Ic-CPT) value proposed by each researcher whereas σvo, wL, wP, wnand FC were the independent variables. Subsequently a
com-parison of the soil type behaviour indices Ic-CPT obtained from CPTu
measurements was made with those calculated by the model formulations resulting from regression analyses (Ic-MLRA). The relative error RE, to incur
in the calculation of AARE used in statistical analyses shall be as follows
= ×
RE I I
I 100
c CPT c MLRA
c CPT (27)
On the other hand, the mean square error (MSE) is defined as,
= = MSE N I I 1 ( ) i n c CPT c MLRA 1 2 (28) Table 11lists the results of the statistical analyses. Similar to the illustration inTable 10it is observed that the correlation coefficients R2
for the methods proposed by Jefferies and Davies (1993), Been and Jefferies (1992),Li et al. (2007)andBol (2013)where excess porewater pressures are taken into account for the calculation of Icare higher than
other methods. The reason for low values of AARE and MSE calculated by theRobertson and Wride (1998),
Juang et al. (2003)andRobertson (2010)methods is possibly the relatively low intervals of Icadopted (seeTable 5). By evaluatingTables
10 and 11together; it can be seen that the methods, that establish the best relationship between physical properties and Ic, also estimate the
undrained shear strength more accurately too.
5. Conclusion
This paper aimed at obtaining the undrained shear resistance (su) of
fine grained soil through CPTu measurements with reference to its soil behavior type index. The suvalues of undisturbed samples were
mea-sured by UU triaxial testing in the laboratory. The CPT soundings were carried out in adjacent boreholes where parameters qc, fsand u2were
recorded at identical depths with UD sampling.
The soil type behavior indices (Ic) proposed by different
in-vestigators were calculated.
The graphs defining the relationship su-Icwere plotted with zones of
different soil classes that were assigned specific cone factors. It was observed that the suvalues for almost all proposed Ic, produced results
are close to the values measured in the laboratory. In addition, when the formulation for soil classification that considers excess pore water pressures (Bqor i) byJefferies and Davies (1993),Been and Jefferies
(1992), Li et al. (2007)andBol (2013)were used with the method proposed in this paper, the undrained shear strengths estimated came out to be nearer to the suvalues measured in the laboratory.
The sensitivity analysis performed using all data points has shown that the undrained strengths estimated by the proposed method provide values that remain within acceptable bands of error. It is concluded that the ca-pacity of the proposed equations to predict the undrained shear strength increases as their capacities to represent the soil physical properties increase.
Fig. 11. Comparison of undrained shear strengths of measured in the laboratory and predicted from CPT. Table 10
Statistical evaluation of the results.
Icintervals calculated from AARE (Nk) AARE (Nkt) AARE (Nke) MSE (Nk) MSE (Nkt) MSE (Nke) R2(Nk) R2(Nkt) R2(Nke)
Been and Jefferies (1992) 13.725 14.620 14.109 7.41E-05 8.08E-05 8.28E-05 0.780 0.767 0.771
Jefferies and Davies (1993) 13.725 14.620 14.109 7.41E-05 8.08E-05 8.28E-05 0.780 0.767 0.771
Robertson and Wride (1998) 15.635 16.305 16.526 1.15E-04 1.18E-04 1.32E-04 0.673 0.669 0.646
Juang et al. (2003) 15.795 16.464 15.589 1.45E-04 1.51E-04 1.44E-04 0.571 0.564 0.581
Li et al. (2007) 14.259 15.139 14.380 7.58E-05 8.37E-05 8.55E-05 0.787 0.775 0.771
Robertson (2010) 19.286 19.573 19.234 2.70E-04 2.64E-04 2.79E-04 0.410 0.415 0.420
Fig. 12. Distribution of discrepancy ratios. Table 11
Equation models and statistical evaluation of the results.
Ic-CPTcalculated from Model (Ic-MLRA) AARE MSE R2
Been and Jefferies (1992) =1.604 + (2.484σvo) + (0.00806wL) + (0.00862wP)-(0.000271wn) + (0.00481FC) 8.6190 0.0813 0.493 Jefferies and Davies (1993) =1.600 + (2.583σvo) + (0.00807wL) + (0.00864wP) + (0.0000558wn) + (0.00482FC) 8.6686 0.0831 0.494 Robertson and Wride (1998) =2.118 + (2.268σvo) + (0.00397wL) + (0.00482wP) + (0.00274wn) + (0.00216FC) 5.3116 0.0356 0.469 Juang et al. (2003) =2.035 + (0.966σvo) + (0.00469wL) + (0.00716wP) + (0.00259wn) + (0.00402FC) 5.5506 0.0421 0.452 Li et al. (2007) =1.795 + (2.931σvo) + (0.0110wL) + (0.0113wP)-(0.00225wn) + (0.00612FC) 9.8096 0.1353 0.491 Robertson (2010) =2.380-(0.766 σvo) + (0.00393wL) + (0.00780wP) + (0.00241wn) + (0.00334FC) 4.9969 0.0359 0.423 Bol (2013) =2.214 + (2.811σvo) + (0.00896wL) + (0.0118wP)-(0.00216wn) + (0.00492FC) 7.8753 0.1044 0.501
Acknowledgements
This work was supported by Sakarya University Scientific Research Project Unit (Project Number: 2013-01-04-020). Its generous support is gratefully acknowledged.
References
Aas, G., Lacasse, S., Lunne, T., Hoeg, K., 1986. Use of in-situ tests for foundation design on clay. In: Proc. of ASCE Specialty Conference In-Situ’ 86: Use of In Situ Tests in Geotechnical Engineering, Blacksburg, pp. 1–30.
Almeida, M., Marques, M., Baroni, M., 2010. Geotechnical parameters of very soft clays from CPTu. In: Proc. of 2nd International Symposium on Cone Penetration Testing, CPT’10, Huntington Beach, paper no. 2–46.
Anagnostopoulos, A., 1974. Evaluation of the undrained shear strength from static cone penetration test in a soft silty clay in Patras, Greece. In: Proc. European Symposium on Penetration Testing, Stockholm, pp. 13–14.
Anagnostopoulos, A., Koukis, G., Sabatakakis, N., Tsiambaos, G., 2003. Empirical corre-lations of soil parameters based on cone penetration test (CPT) for Greek soils. Geotech. Geol. Eng. 21 (4), 377–387.
Arel, E., Özocak, A., 2005. Evaluation of Degree of Sensitivity in Adapazarı Soils (in Turkish). Geotechnical Symposium. Adana Civil Engineers Association.
ASTM D2487-17, 2017. Standard practice for classification of soils for engineering pur-poses (Unified Soil Classification System). In: Annual Book of ASTM Standards. Vol. 04.08 ASTM International, West Conshohocken, PA, USA.
ASTM WK27337, 2010. New Test Method for Pocket Penetrometer Test (Under Development). ASTM International, PO Box C700, West Conshohocken, PA 19428, USA.
Baligh, M.M., 1985. Strain path method. ASCE J. Geotech. Eng. 111 (9), 1108–1136.
https://doi.org/10.1061/(ASCE)0733-9410(1985)111:9(1108).
Been, K., Jefferies, M.G., 1992. Towards systematic CPT interpretation. In: Predictive Soil Mechanics: Proceedings Wroth Memorial Symposium. Thomas Telford, London, pp. 121–134.
Begemann, H.K., 1965. The friction jacket cone as an aide in determining the soil profile. In: Proc. of 6th International Conference on Soil Mechanics and Foundation Engineering, Montreal, QC, Canada, pp. 17–20 Vol. 1.
Bishop, A.W., Henkel, D.J., 1962. The Measurements of Soil Properties in the Triaxial Test, 2nd ed. Arnold, London 227 pp.
Blight, G.E., 1968. A note on field vane testing of silty soils. Can. Geotech. J. 5 (3), 142–149.https://doi.org/10.1139/t68-014.
Bol, E., 2003. The Geotechnical Properties of Adapazari Soils (in Turkish). PhD Thesis. Sakarya University, Adapazari, Turkey 195 pp.
Bol, E., 2012. Determination of the relationship between soil properties and earthquake damage with the aid of neural networks: a case study in Adapazari, Turkey. Nat. Hazards Earth Syst. Sci. 12 (9), 2965–2975. https://doi.org/10.5194/nhess-12-2965-2012.
Bol, E., 2013. The influence of pore pressure gradients in soil classification during pie-zocone penetration test. Eng. Geol. 157, 69–78.https://doi.org/10.1016/j.enggeo. 2013.01.016.
Bol, E., Önalp, A., Arel, E., Sert, S., Özocak, A., 2010. Liquefaction of silts: the Adapazari criteria. Bull. Earthq. Eng. 8 (4), 859–873. https://doi.org/10.1007/s10518-010-9174-x.
Bol, E., Özocak, A., Sert, S., 2013. Undrained shear strength evaluation by using Cone Penetration Test (CPT) (in Turkish). In: Research Project (2013-Ongoing). Sakarya University, Scientific Research Unit.
Bray, J.D., Sancio, R.B., Youd, L.F., Christensen, C., Cetin, K.O., Onalp, A., Durgunoglu, T., Stewart, J.P.C., Seed, R.B., Baturay, M.B., Karadayilar, T., Emrem, C., 2001. Documenting Incidents of Ground Failure Resulting from the August 17, 1999 Kocaeli, Turkey Earthquake. Pacific Earthquake Engineering Research Center Website: http://peer.berkeley.edu/publications/turkey/adapazari/.
Campanella, R.G., Gillespie, D., Robertson, P.K., 1982. Pore pressures during cone pe-netration testing. In: Proceedings of the 2nd European Symposium on Pepe-netration Testing, ESOPT-2, Amsterdam. vol. 2. pp. 507–512.
Chandler, R.J., 1988. The in situ measurement of the undrained shear strength of clays using the field vane. In: Richards, A.F. (Ed.), Vane Shear Strength Testing in Soils: Field and Laboratory Studies. Vol. 1014. pp. 13–44 American Society for Testing and Materials, Special Technical Publication.
Chen, C.S., 2001. Evaluating undrained shear strength of Klang clay from cone penetra-tion test. In: Internapenetra-tional Conference on In-situ Measurement of Soil Properties and Case Histories, Bali, Indonesia, pp. 141–148.
de Beer, E.E., 1977. Static cone penetration testing in clay and loam. In: Sondeer Symposium, Utrecht.
Douglas, B.J., Olsen, R.S., 1981. Soil classification using electric cone penetrometer. In: ASCE, Proc. of Conference on Cone Penetration Testing and Experience, St. Louis, pp. 209–227.
Eid, H.T., Stark, T.D., 1998. Undrained shear strength from cone penetration test. In: Geotechnical Site Characterization, ISC’98. Vol. 2. pp. 1021–1025.
Eslami, A., Fellenius, B.H., 1997. Pile capacity by direct CPT and CPTu methods applied to 102 case histories. Can. Geotech. J. 34 (6), 880–898.
Fukasawa, T., Kusakabe, O., 2001. A History of Development of Cone Penetration Tests with Reappraisal of Interpretation Methods and Its Applicability to Clay Soils. Technical Report, Department of Civil Engineering, Tokyo Institute of Technology, No: 64. pp. 23–60.
Fukasawa, T., Mizukami, J., Kusakabe, O., 2004. Applicability of CPT for construction control of seawall on soft clay improved by sand drain method. Soils Found. 44 (2), 127–138.
Gebreselassie, B., 2003. Experimental, Analytical and Numerical Investigations of Excavations in Normally Consolidated Soft Soils. PhD thesis. University of Kassel.
Gibson, R.E., Anderson, W.F., 1961. In-situ measurement of soil properties with the pressuremeter. Civil Eng. Public Works Rev. 56 (658), 615–618.
Head, K.H., Epps, R.J., 2011. Manual of Soil Laboratory Testing, Volume 2: Permeability, Shear Strength and Compressibility Tests, Third edition. Whittles Publishing, Scotland, UK 499 pp.
Holtz, R.D., Kovacs, W.D., Sheahan, T.C., 2011. Introduction to Geotechnical Engineering, 2nd ed. Pearson.
Hong, S., Lee, M., Kim, J., Lee, W., 2010. Evaluation of undrained shear strength of Busan clay using CPT. In: Proc. of 2nd International Symposium on Cone Penetration Testing, CPT’10, Huntington Beach, paper no. 2–23.
Jamiolkowski, M., Ladd, C.C., Germain, J.T., Lancellotta, R., 1985. New developments in field and laboratory testing of soils. In: Proc. of the 11th International Conference on Soil Mechanics and Foundation Engineering, San Francisco. Vol. 1. pp. 57–153. Jefferies, M.G., Davies, M.P., 1993. Use of CPTu to estimate equivalent SPT N60. Geotech.
Test. J. 16 (4), 458–468.https://doi.org/10.1520/GTJ10286J.
Jones, G.A., Rust, E., 1982. Piezometer penetration testing. In: CUPT. Proc. of the 2nd European Symposium on Penetration Testing, ESOPT-2, Amsterdam. Vol. 2. pp. 607–614.
Jörß, O., 1998. Erfahrungen bei der Ermittlung von cu-Werten mit der Hilfe von
Drucksondierungen in bindigen Böden. Geotechnik 21, 26–27.
Juang, C.H., Yuan, H., Lee, D.H., Lin, P.S., 2003. Simplified cone penetration test-based method for evaluating liquefaction resistance of soils. J. Geotech. Geoenviron. 129 (1), 66–79.
Karakouzian, M., Avar, B.B., Hudyma, N., Moss, J.A., 2003. Field measurements of shear strength of an underconsolidated marine clay. Eng. Geol. 67, 233–242.https://doi. org/10.1016/S0013-7952(02)00182-5.
Karlsrud, K., Lunne, T., Brattlien, K., 1996. Improved CPTU interpretations based on block samples. In: Proc. 12th Nordic Geotechnical Conference, Reykjavik. Vol. 1. pp. 195–201 Also NGI, Oslo. Publ. 202.
Karlsrud, K., Lunne, T., Kort, D.A., Strandvik, S., 2005. CPTU correlations for clays. In: Proc. 16th International Conference on Soil Mechanics and Geotechnical Engineering, Osaka, pp. 693–702.
Keaveny, J., Mitchell, J.K., 1986. Strength of fine-grained soils using the piezocone. In: Proc of GSP 6, Part of Use of In-Situ Tests in Geotechnical Engineering. ASCE, Reston/ VA, pp. 668–685.
Kjekstad, O., Lunne, T., Clausen, C.J.F., 1978. Comparison between in-situ cone resistance and laboratory strength for overconsolidated North Sea clays. Mar. Geotechnol. 3 (1), 23–36.
Konrad, J.M., Law, K.T., 1987. Undrained shear strength from piezocone tests. Can. Geotech. J. 24 (3), 392–405.
Koukis, G., Tsiambaos, G., Sabatakakis, N., 1997. Correlations of mechanical character-istics and classification of soil units of Patras city (in Greek). In: Proc. of 3rd Hellenic Congress in Geotechnical Engineering, Patras. Vol. 1. pp. 121–127.
Kulhawy, F.H., Mayne, P.W., 1990. Manual on estimating soil properties for foundation design. In: Report EL-6800. Electric Power Research Institute, Cornell University, Palo Alto.
La Rochelle, P., Zebdi, M., Leroueil, S., Tavenas, F., Virely, D., 1988. Piezocone tests in sensitive clays of Eastern Canada. In: Proc. of First International Symposium on Penetration Testing, ISOPT-1, Orlando. Vol. 2. pp. 831–841.
Ladanyi, B., 1967. Deep punching of sensitive clays. In: Proc. of the Third Pan American Conference on Soil Mechanics and Foundation Engineering, Caracas. Vol. 1. pp. 533–546.
Li, D.K., Juang, C.H., Andrus, R.D., Camp, W.M., 2007. Index properties-based criteria for liquefaction susceptibility of clayey soils: a critical assessment. J. Geotech. Geoenviron. 133 (1), 110–115.https://doi.org/10.1061/(ASCE)1090-0241(2007) 133:1(110).
Low, H.E., Lunne, T., Andersen, K.H., Sjursen, M.A., Li, X., Randolph, M.F., 2010. Estimation of intact and remoulded undrained shear strengths from penetration tests in soft clays. Geotechnique 60 (11), 843–859.https://doi.org/10.1680/geot.9.P.017.
Luke, K., 1995. The use of cufrom Danish triaxial tests to calculate the cone factor. In:
Proc. of the Intern. Symp. On Cone Penetration Testing, CPT'95, Linkoping, Sweden, pp. 209–214.
Lunne, T., Kleven, A., 1981. Session at the ASCE National Convention: Cone Penetration Testing and Materials, St. Louis. Role of CPT in North Sea foundation engineering, pp. 76–107.
Lunne, T., Christophersen, H.P., Tjelta, T.I., 1985. Engineering use of piezocone data in North Sea clays. In: Proc. 11th International Conference on Soil Mechanics and Foundation Engineering, San Francisco. Vol. 2. pp. 907–912.
Lunne, T., Robertson, P.K., Powell, J.J.M., 1997. Cone Penetration Testing in Geotechnical Practice. Blackie Academic, EF Spon/Routledge, New York.
Lunne, T., Randolph, M.F., Chung, S.F., Andersen, K.H., Sjursen, M., 2005. Comparison of cone and t-bar factors in two onshore and one offshore clay sediments. In: Frontiers in Offshore Geotechnics (Proc. ISFOG-1, Perth). Taylor & Francis Group, London, pp. 981–989.
Marchetti, S., 1980. In situ tests by flat dilatometer. ASCE J. Geotech. Eng. Div. 106 (3), 299–321.
Marshland, A., Randolph, M.F., 1977. Comparisons of the results from pressuremeter tests and large in situ plate tests in London Clay. Géotechnique 27 (2), 217–243.https:// doi.org/10.1680/geot.1977.27.2.217.
Matsui, T., Abe, N., 1981. Shear mechanisms of vane test in soft clays. Soils Found. 21 (4), 69–80.https://doi.org/10.3208/sandf1972.21.4_69.
Mayne, P.W., Peuchen, J., Baltoukas, D., 2015. Piezocone evaluation of undrained strength in soft to firm offshore clays. In: Frontiers in Offshore Geotechnics III, Vol. 2 (Proc. ISFOG-3, Oslo). Taylor & Francis, London, pp. 1091–1096.
Meigh, A.C., 1987. Cone Penetration Testing: Methods and Interpretation. Butterworths, London.
Młynarek, Z., Wierzbicki, J., Stefaniak, K., 2018. Interrelationship between undrained shear strength from DMT and CPTU tests for soils of different origin. Geotech. Test. J. 41 (5).https://doi.org/10.1520/GTJ20170365.
Nevels Jr., J.B., 1989. Interpretation of the Discontinuous Mechanical Cone Penetration test in Northeastern Oklahoma Alluvial Soils. Ph.D. Thesis. Oklahoma State University 287 pp.
Önalp, A., Bol, E., Ural, N., 2006. Estimation of undrained shear strength from cone tip resistance in clayey soils. In: Seventh International Congress on Advances in Civil Engineering. Yıldız Technical University, Istanbul, Turkey.
Önalp, A., Arel, E., Bol, E., Özocak, A., Sert, S., 2007. The assessment of liquefaction potential with dissipation method in piezocone penetration testing (CPTU) (in Turkish). In: The Scientific and Technological Research Council of Turkey-TÜBİTAK, Project No: 104M387, Ankara.
Önalp, A., Arel, E., Bol, E., Özocak, A., Sert, S., Ural, N., 2010. The effect of dynamic tests on recognition of failure of fine grained soils in seismic conditions by using Adapazari Criteria (in Turkish). In: The Scientific and Technological Research Council of Turkey- TÜBİTAK, Project No: 106M042, Ankara.
Özocak, A., Sert, S., Bol, E., 2013. Evaluation of the liquefaction potential through dis-sipation measurement in PCPT. Q. J. Eng. Geol. Hydrogeol. 46, 337–350.https://doi. org/10.1144/qjegh2012-028.
Powel, J.J.M., Lunne, T., 2005. Use of CPTU data in clays/fine grained soils. Studia Geotech. Mech. XXVII (3-4), 29–66.
Powell, J.J.M., Quertman, R.S.T., 1988. The interpretation of cone penetration test in clays, with particular reference to rate effects. In: Proc. of the Int. Sym. on Penetration Testing, ISOPT-1, Orlando. Vol. 2. Balkema Pub., Rotterdam, pp. 911–917.
Rad, N.S., Lunne, T., 1986. Correlations between Piezocone Results and Laboratory Soil Properties. Norwegian Geotechnical Institute, Oslo, Norway, pp. 306–317 Report 52155.
Rémai, Z., 2013. Correlation of undrained shear strength and CPT resistance. Period. Polytech. Civil Eng. 57 (1), 39–44.https://doi.org/10.3311/PPci.2140. Ricceri, G., Simonini, P., Cola, S., 2002. Applicability of piezocone and dilatometer to
characterize the soils of the Venice Lagoon. Geotech. Geol. Eng. 20 (2), 89–121.
https://doi.org/10.1023/A:1015043911091.
Robertson, P.K., 1990. Soil classification using the CPT. Can. Geotech. J. 27 (1), 151–158.
https://doi.org/10.1139/t90-014.
Robertson, P.K., 2010. Soil behavior type from the CPT: an update. In: Proc. of 2nd International Symposium on Cone Penetration Testing, CPT’10, Huntington Beach, paper no. 2-56.
Robertson, P.K., Wride, C.E., 1998. Evaluating cyclic liquefaction potential using the cone penetration test. Can. Geotech. J. 35 (3), 442–459.https://doi.org/10.1139/t98-017.
Robertson, P.K., Campanella, R.G., Gillespie, D., Grieg, J., 1986. Use of piezometer cone data. In: Clemence, S. (Ed.), Proceedings of American Society of Civil Engineers, ASCE, In-Situ 86 Specialty Conference. Geotechnical Special Publication, Blacksburg, pp. 1263–1280 GSP No. 6.
Sabatini, P.J., Bachus, R.C., Mayne, P.W., Schneider, J.A., Zettler, T.E., 2002. Evaluation
of Soil and Rock Properties, Technical Manual, Report No: FHWA-IF-02-034. Geo Syntec Consultants, 1100 Lake Hearn Drive, NE, Atlanta, Georgia.
Sanglerat, G., 1972. The Penetrometer and Soil Exploration. Elsevier Science Ltd., Amsterdam, the Netherlands.
Sanglerat, G., Nhim, T.V., Sejourne, M., Andina, R., 1974. Direct soil classification by static penetrometer with special friction sleeve. In: Proc. of the First European Symposium on Penetration Testing, ESOPT-1, Stockholm. Vol. 2.2. pp. 337–344.
Schmertmann, J.H., 1978. Guidelines for cone test, performance, and design. In: Federal Highway Administration, Report FHWA-TS-78209, Washington, 145 pp.
Senneset, K., Sandven, R., Janbu, N., 1989. Evaluation of soil parameters from piezocone test. In: In-situ Testing of Soil Properties for Transportation, Transportation Research Record, No. 1235, Washington, D.C. pp. 24–37.
Skempton, A.W., 1951. The bearing capacity of clays. Proc. Build. Res. Congr. 1, 180–189.
Skepton, A.W., 1948. The ø = 0 analysis of stability and its theoretical basis. In: Proceedings of the 2nd International Conference on Soil Mechanics and Foundation Engineering. Vol. 1. pp. 72–78.
Sowers, G.F., 1954. Modern procedures for underground investigations. Proc. Am. Soc. Civ. Eng. 80 (435), 11.
Sowers, G.F., 1979. Introductory Soil Mechanics and Foundations, 4th ed. Macmillan, New York 621 pp.
Stark, T.D., Delashaw, J.E., 1990. Correlations of unconsolidated-undrained triaxial tests and cone penetration tests. In: Transportation Research Record, Proceeding No. 1278, pp. 96–102.
Stroud, M.A., 1974. The standard penetration test in insensitive clays and soft rock. In: Proceedings of the 1st European Symposium on Penetration Testing, Stockholm, Sweden. Vol. 2. pp. 367–375 2.
Tanaka, H., Tanaka, M., 1996. A site investigation method using cone penetration and dilatometer tests (in Japanese). In: Technical Note of the Port and Harbour Research Institute Ministry of Transport, Japan, No: 837, pp. 1–52.
Tanaka, H., Hirabayashi, H., Matsuoka, T., Kaneko, H., 2012. Use of fall cone test as measurement of shear strength for soft clay materials. Soils Found. 52 (4), 590–599.
Teh, C.I., 1987. An Analytical Study of the Cone Penetration Test. PhD Thesis. Oxford University.
Terzaghi, K., 1943. Theoretical Soil Mechanics. John Wiley and Sons, New York 510 pp.
Terzaghi, K., Peck, R.B., 1967. Soil Mechanics in Engineering Practice. John Wiley, New York 729 pp.
TS1500, 2000. Soil Classification in Civil Engineering (in Turkish). Turkish Standards Institute, Ankara, Turkey.
Tumay, M.T., Acar, Y., Deseze, E., 1982. Soil exploration in soft clays with the quasi-static electric cone penetrometer. In: Proc. 2nd Eur. Symposium on Penetration Testing, Amsterdam, pp. 915–921.
Vesic, A.S., 1972. Expansion of cavities in infinite soil mass. ASCE J. Soil Mech. Found. Eng. 98 (3), 265–290.
Vesic, A.S., 1975. Principles of pile foundation design. In: Soil Mechanics Series No: 38, School of Engineering. Duke University, Durham, NC 48 pp.
Yu, H.S., Mitchell, J.K., 1998. Analysis of cone resistance: review of methods. ASCE J. Geotech. Geoenviron. Eng. 124 (2), 140–149.
Zervogiannis, H., Bouckovalas, G., Christoulas, St., 1987. Correlation of mechanical characteristics and classification of soil deposits (in Greek). Bull. Cent. Pub. Works Lab. 4, 255–265.