Determination with Linear Form of Turkey’s
Energy Demand Forecasting by the Tree Seed
Algorithm and the Modified Tree Seed
Algorithm
Ayşe BEŞKİRLİ1,2, Hasan TEMURTAŞ3, Durmuş ÖZDEMİR3
1Departmant of Computer Engineering, Burdur Mehmet Akif Ersoy University, Burdur, 15000, Turkey 2Departmant of Computer Engineering, Eskişehir Osmangazi University, Eskişehir, 26000, Turkey
3Departmant of Computer Engineering, Kütahya Dumlupınar University, Kütahya, 43100, Turkey
1
Abstract—Energy plays an important role in every stage of human life in different forms and variations. Along with the developments in economic, social and industrial fields, the amount of energy that countries need is increasing day by day. Therefore, it is significant to estimate the energy demand for a country's economic activities accurately. In this study, the energy demand forecast (EDF) application optimization problem of Turkey, one of the real-world optimization problems, was performed by MTSA (Modified Tree Seed Algorithm) and TSA (Tree Seed Algorithm) methods. From 1979 to 2005, gross domestic product (GDP), population, export and import values were used as parameter data. Thus, in the presence of three different possible scenarios, Turkey's energy demand from 2006 to 2025, which was estimated by MTSA and TSA methods. To demonstrate the success of MTSA and TSA in the problem of energy demand forecasting (EDF), they are compared with Ant Colony Algorithm (ACO), Particle Swarm Optimization (PSO), Bat Algorithm (BA), Differential Evolution Algorithm (DEA) and Artificial Algae Algorithm (AAA) methods which are in the literature. According to the results of the analysis, it was observed that the MTSA method was a successful estimation tool for energy demand.
Index Terms—algorithms, demand forecasting, energy optimization, heuristic algorithms.
I. INTRODUCTION
Energy plays an important role in the economic and social development of a country from past to present. Along with social, economic and industrial developments, the energy that manifests itself in every stage of human life causes a rise in the amount of energy, which countries need [1] and [2]. In particular, energy has been an important factor in the economic and social development of countries and societies. The place and importance of energy in human life are increasing day by day. Despite the nuclear power plant accidents and financial crises, the demand for energy and the installation of new power plants continue to increase [3]. Today, energy, one of the most important needs, is also an indicator of the level of development of a country [4] and [5]. Estimation of energy demand is of great importance for developed and developing countries. In particular, the need for energy is increasing rapidly due to the increasing
population and developing technology and industrialization. For instance, in Turkey, while per capita energy consumption was 274 kWh in 1974, it increased to 2,682 kWh in 2014 [2].
To ensure the healthy development of the energy sector, distribution, supply, demand, pricing and transmission plans are of great importance for this sector [6]. The most important of these planning studies is to determine the future energy demand by considering the increasing energy demand. Since energy requires high costs and it is not stored, a balance must be established between energy production and consumption [7]. Therefore, the importance of accurate estimation of energy demand increases. If the forecasted energy is lower than the energy needed, it may cause an energy crisis, and if it is high, the energy resources may decrease, while at the same time it may cause harm to the economy [8]. The more accurate the energy demands to be predicted, the more successful the planning work will be. In other words, the success of the planning works is based on the accuracy of the projected energy demand.
When the literature is analysed, researchers have conducted studies on energy demand forecasting (EDF) using various methods for the energy demand of many countries. Some of these studies; Geem and Roper [9] estimated the energy demand of South Korea using an artificial neural network (ANN). Ekonomou [10] have created an estimation model with an artificial neural network for Greece's energy consumption forecast. Yu et al. [11] estimates by proposing a hybrid algorithm for China's EDF. Similarly, Piltan et al. [12] created a prediction model using evolutionary algorithms for Iran's EDF. Sánchez-Oro et al. [13] created a prediction model based on artificial neural network method for the EDF of Spain. Mohamed and Bodger [14] estimated electricity consumption in New Zealand with multiple linear regression. Bianco et al. [15] estimated the electricity consumption of Italy by using the linear regression model. Yu et al. [16] proposed a hybrid algorithm with PSO and GA for projections of China's energy demand. Yu et al. [17] proposed a PSO-GA optimization model to estimate China's primary energy demand. In most countries, although studies related to energy forecast has been continued for a long time, the Digital Object Identifier 10.4316/AECE.2020.02004
forecast studies on energy issues in Turkey gained momentum towards the end of 1990. Turkey Statistical Institute (TSI), the Ministry of Energy and Natural Resources (MoENR), State Planning Organization (SPO) at the end of the 1970s, they started to use mathematical models to forecast energy demand [18].
Not to hinder access to energy resources and investments, advance and industrialization, budget planning, in the long term, the amount of energy needed by Turkey, where 70% of the energy demand is met by the imports, needs to be accurately estimated [19]. For this reason, researchers have developed many heuristic or meta-heuristic algorithms to solve engineering problems that are difficult or impossible to solve [20] and [21]. By modelling these algorithms in a computerized environment, scientists realized that the solution of real-world problems was achieved faster and the
results found were closer to the real value [22]. This has led to the emergence of optimization techniques and improvements through continuous improvements. Optimization is usually described as the handle of using the limited available means to solve a problem and finding the best among the results obtained [23] and [24]. The task of optimization is to determine the optimal result of a function whose constraints are given for continuous or discrete problems.
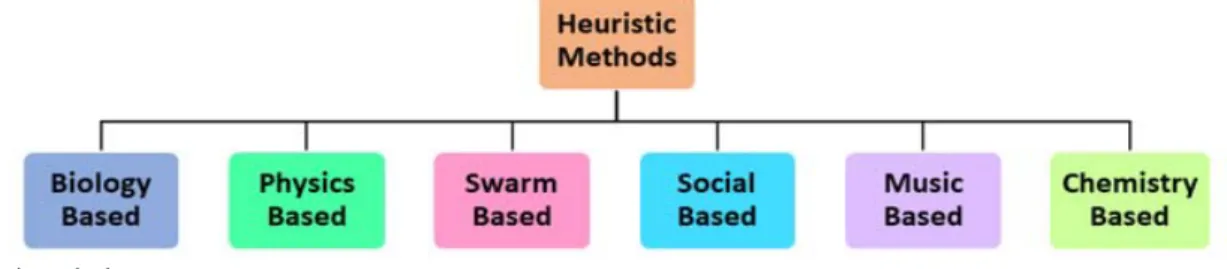
From past to present, the creatures in nature that inspire science play a huge role in the emergence of new advances. Scientists have advanced lots of algorithms inspired by the behaviours of living things in nature [25]. Such algorithms are also called meta-heuristic methods. As shown in Figure 1, heuristic methods happen six nature-inspired bases [26].
Figure 1. Heuristic methods
A. Sample Application Fields of Heuristic Algorithms There are many studies about optimization techniques in the literature. When the studies in the literature are examined, it is seen that the algorithm has obtained more successful results as a result of some changes made in the algorithm. Akay and Karaboga [27] adjusted a new parameter to the Artificial Bee Colony algorithm (ABC) and made parameter adjustments along with other parameters of the algorithm. With changes in these parameter values, ABC has been said to be a suitable method to solve optimization problems effectively. In their study, Chen et al. [28] proposed an approach to improve image contrast using the artificial bee colony algorithm. In the proposed approach, they have developed an objective function for a new objective image contrast by adding a new image contrast measure. They suggested that the method they proposed was faster and more efficient than the existing approaches. Ahmad et al. [29] suggested a new hybrid genetic algorithm for workflow timing optimization. They compared hybrid genetic algorithms with different approaches in the literature. According to the test results, they emphasized that the program time of the algorithm they proposed is better. Yilmaz and Kucuksille [30] developed the bat algorithm to solve optimization problems. They used standard benchmark functions and real-world optimization problems to analyse the performance of the developed bat algorithm.
B. Optimization Studies in the Field of Energy
In their study, Kiran, Ozceylan, Gunduz, and Paksoy [31] suggested a hybrid method for forecasting Turkey's electricity demand. The proposed method is the first model that combines two metaheuristic algorithm techniques for particle swarm optimization (PSO) and ant colony optimization (ACO). With the suggested method, using the data of the gross domestic product (GDP), population, import and export in 1979-2005, they estimated energy
demand between 2006 and 2025. As a result, they stated that the proposed method successfully predicted energy demand. In their study, Kiran, Ozceylan, Gunduz, and Paksoy [32] developed a new method with artificial bee colony (ABC) and particle swarm optimization (PSO) techniques to forecasting the electricity demand in Turkey. To demonstrate the applicability and accuracy of the suggested models, they compared the ant colony optimization (ACO) in the literature for the same problem. According to the results obtained, the error rate of the suggested method was lower than ACO and they offered more suitable solutions. Bayrak and Esen [33] suggested the ANN model for Turkey's EDF. They used the 1960-2011 data for the 2012-2020 forecast of energy demand. When comparing the estimation results with MoENR's official estimation results, they stated that there was quite a difference between them and said that the proposed method achieved successful results for energy demand estimation. By using a genetic algorithm-based grey prediction method (GAGM) and particle swarm optimization based grey prediction method (PSOGM), Cayır Ervural and Ervural [34] carried out the EDF in Turkey.
When the studies related to optimization problems in the literature are examined, there are many studies for meta-heuristic algorithms. When these algorithms, in their original form, are applied to real-world problems, they may not always provide the best solution according to the algorithms available in the literature. Researchers have been made some changes to the algorithm to get a better solution to the problems. If the algorithms perform better with the changes made, the solution of the problem will be optimum or the solution approaches the optimum result.
In this study, it is aimed to optimally forecasting the energy demand, which is one of the real-world optimization problems, with MTSA which is a result of the modification of TSA, which is one of the meta-heuristic methods.
II. ORIGINAL TSA
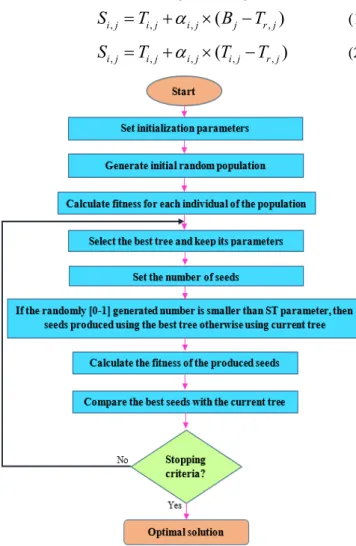
In 2015, Kiran [35] proposed a new meta-heuristic algorithm to solve continuous optimization problems. This algorithm has called tree seed algorithm (TSA). There is a certain connection between trees and seeds in the TSA. This connection consists of natural ways. In nature, tree seeds are distributed to the soil and these seeds grow in time and occur new trees [36]. When the soils of the trees are assumed as research areas, the position of trees and seeds express probable solutions for continuous problems [37]. Thus, the significance of seed location in the formation of trees has increased. There are two equations for the search field. The first one is the process of seed production for the best location of the tree population. This process has increased the local search power of the algorithm. In the other equation, the process is carried out using two distinct tree locations for the formation of a new seed [35]. Where S(i,j), the tree will be produced i. seed j. show the dimension. T(i,j) is the j. size of the i. tree. Bj is the j. size of the best tree location ever obtained. Tr,j is the j. size of the r. tree randomly selected from the population. α is randomly generated in the range [-1,1]. There are two equations for creating the location of a new seed. These equations are controlled by the search trend (ST) in the [0,1] range. Equation 1 is used if the randomly produced number in the range [0-1] is less than ST, otherwise, Equation 2 is used. The flow chart of the TSA is given in Figure 2.
, , ,
(
,)
i j i j i j j r jS
T
B
T
(1) , , ,(
, ,)
i j i j i j i j r jS
T
T
T
(2)Figure 2. TSA flow chart
III. MODIFIED TREE SEED ALGORITHM
As the complexity of problems rises, it is frequently hard for the algorithm to get the best solution [38]. For the algorithm to produce effective solutions, it is necessary to make some changes in the algorithm. Therefore, it is purposed to expand local and global space of the algorithm by changing the selection method of the trees in TSA. Instead of a randomly selected tree, a tournament selection method is proposed to create seeds. Tournament selection method works with the logic of selecting the strongest of the two randomly selected values. The number of seeds to be formed from the tree is a random N value between 10% and 25% of the population. This N number of trees then participates in a tournament and the best available trees are selected. The modification of TSA's seed selection method and the name of the proposed method were called the modified tree seed algorithm (MTSA) by Beskirli et al. [39].
To produce better quality seeds in Equations 3 and 4, the change in the selection technique of trees is illustrated. Seeds produced with these formulas are selected according to the ST parameter. If the number selected between [0-1] is less than ST, Equation 3 is used, and if the selected number is greater than ST, Equation 4 is used.
, , ,
(
,)
i j i j i j j t jS
T
B
T
(3) , , ,(
, ,)
i j i j i j i j t jS
T
T
T
(4)In this Equation, S(i,j) symbolize the size j. of the tree seed i. T(i,j) is the j. size of the i. tree. Bj, contains the size j. of the best-obtained tree locations. Tt,j is the j. size of tree t. which is selected from the population by the tournament selection method and α, represents the randomly generated in the [−1,1] range.
In Equations 3 and 4, the seed production stage is reformulated. Instead of randomly selecting (Tr) the trees in the formula of the original TSA, innovation has been made in the selection of trees using the tournament selection method (Tt). To produce quality solutions and to make effective scanning in the search space, a change was made in the seed selection method.
IV. APPLICATION OF RECOMMENDED METHODS TO THE
EDFPROBLEM
An energy demand forecasting model is formed by using the Economy-based gross domestic product (GDP), population, import and export data, which have the greatest effect on a country's energy demand and have been mentioned in the literature. This model consists of three scenarios. At the same time, by using this model, the estimation of the energy demand of the different countries can be made. In this study, TSA and MTSA methods were used to estimate Turkey's energy demand. Between 1979 and 2005, GDP for Turkey, population, import and export data, and Turkey's energy demand values are given in Table I. These data are used as input data and the objective function is calculated with them. All these data were collected from Turkey Statistical Institute, Ministry of Energy and Natural Resources, energy reports and literature [19], [40-42].
TABLE I.TURKEY’S ENERGY DEMAND,GDP,POPULATION,IMPORT AND EXPORT DATA Year Energy Demand (TWh) GDP ($10^9) Population (10^6) Imports ($10^9) Export ($10^9) 1979 30.71 82 45.53 5.07 2.26 1980 31.97 68 44.44 7.91 2.91 1981 32.05 72 45.54 8.93 4.70 1982 34.39 64 46.69 8.84 5.75 1983 35.70 60 47.86 9.24 5.73 1984 37.43 59 49.07 10.76 7.13 1985 39.40 67 50.31 11.34 7.95 1986 42.47 75 51.43 11.10 7.46 1987 46.88 86 52.56 14.16 10.19 1988 47.91 90 53.72 14.34 11.66 1989 50.71 108 54.89 15.79 11.62 1990 52.98 151 56.10 22.30 12.96 1991 54.27 150 57.19 21.05 13.59 1992 56.68 158 58.25 22.87 14.72 1993 60.26 179 59.32 29.43 15.35 1994 59.12 132 60.42 23.27 18.11 1995 63.68 170 61.53 35.71 21.64 1996 69.86 184 62.67 43.63 23.22 1997 73.78 192 63.82 48.56 26.26 1998 74.71 207 65.00 45.92 26.97 1999 76.77 187 66.43 40.67 26.59 2000 80.50 200 67.42 54.50 27.78 2001 75.40 146 68.37 41.40 31.33 2002 78.33 181 69.30 51.55 36.06 2003 83.84 239 70.23 69.34 47.25 2004 87.82 299 71.15 97.54 63.17 2005 91.58 361 72.97 116.77 73.48
In Table I, it is observed that Turkey has been in a constant state of development and economic values have raised over the years. Also, when Table II is examined, it can be said that there is a connection between the rise in economic values and the rise in energy consumed [43]. When these connections are taken into consideration, the formula is formed by using the linear form for energy demand estimation and modelled as in Equation 5.
The linear form Equation can be expressed as follows;
1 2 1 3 2 4 3 5
lineer
E
w
w X
w X
w X
w X
4 (5) X2The main goal of EDF is to find an optimum result by processing the available data. The values X1, X2, X3 and X4 in Equation 5 indicate the GDP, population, import and export values, respectively. According to these values, weight values (wi) are calculated which will make the most appropriate EDF for the given years. The objective function used is given in Equation 6.
2 1
min ( )
R(
observed estimated)
r r
r
f v
E
E
(6)Here and represent true and predicted values, while R holds the number of observations.
observed r
E estimated r
E
A. Comparison of MTSA and TSA through methods in the literature.
To demonstrate the success of MTSA and TSA methods on the EDF problem, it was compared with the results of the methods performed by Toksari [44], Unler [8], Hakli [45], Beskirli [43], Beskirli [46].
To compare the proposed methods within the literature and to analyse them healthily, as in the methods in the literature, for the MTSA and TSA methods, the data from 1979-2005 in Table I were taken into consideration and forecasting model for energy demand. For MTSA and TSA
methods, it was determined that the number of populations was 100, the ST value was 0.1, and the maximum number of function evaluations (MaxFEs) was 200,000. Weights of MTSA for linear form are given in Equation 7 and weights of TSA are given in Equation 8. Also, all coding was performed with MATLAB 2014 (8.3) and the best solution obtained by running 10 times under the same conditions was taken into consideration.
Weights for linear form:
_ 1 3 4 _ 0.00380 1.91227 0.37354 0.48351 55.89907 ( ) 41.71200 MTSA lineer MTSA lineer E X X X f v (7) _ 1 3 4 _ 0.01032 1.90057 0.25111 0.31693 55.62818 ( ) 46.27831 TSA lineer TSA lineer E X X X f v 2 X (8)
TABLE II.COMPARISON OF COEFFICIENTS AND RELATIVE ERRORS FOR
LINEAR FORM w1 w2 w3 w4 w5 Error MTSA -55.8991 0.0038 1.9123 0.3735 -0.4835 41.7120 TSA -55,6282 0,0103 1,9006 0,2511 -0,3169 46,2783 DEA -55.8991 0.0038 1.9123 0.3735 -0.4835 41.7120 AAA -55.8991 0.0038 1.9123 0.3735 -0.4835 41.7120 BA -57.7676 0.00002 1.9549 0.4023 -0.5316 42.4890 PSO -55.9022 0.0021 1.9126 0.3431 -0.4240 42.6139 ACO -51.3046 0.0124 1.8102 0.3524 -0.4439 45.7239
MTSA, TSA, DEA, AAA, BA, PSO and ACO algorithms coefficients and error values are given in Table II. The coefficients and error values of the algorithms other than MTSA and TSA were added to the table through obtaining from related studies.
successfully as it had the least error value as in the DEA and AAA methods, the other methods fell behind the MTSA.
The amount of energy demand and amount of energy observed which were estimated by MTSA and TSA methods
between the years 1996-2005 are presented in Table III. Also, the amount of error between the forecasting energy demand and the observed value for both MTSA and TSA and relative error rates are given in Table III.
TABLE III.ENERGY DEMAND FORECASTS FOR MTSA AND TSAMETHODS
Years
Observed Energy Demand
(OED)
Estimated Energy
Demand Error Quantity Error (%)
MTSA TSA MTSA TSA MTSA TSA
1996 69.86 69.71 68.98 0.15 0.89 0.21 1.27 1997 73.78 72.32 71.52 1.46 2.26 1.99 3.07 1998 74.71 73.30 73.03 1.41 1.68 1.89 2.25 1999 76.77 74.18 74.34 2.59 2.43 3.37 3.16 2000 80.50 80.71 79.45 -0.21 1.05 -0.27 1.30 2001 75.40 75.71 76.29 -0.31 -0.89 -0.42 -1.18 2002 78.33 79.13 79.47 -0.80 -1.14 -1.02 -1.45 2003 83.84 82.37 82.75 1.47 1.09 1.76 1.30 2004 87.82 87.19 87.15 0.63 0.67 0.72 0.76 2005 91.58 93.10 92.81 -1.52 -1.23 -1.66 -1.35
The mean relative error rates of the recommended methods to solve the EDF problem and the existing methods in the literature between 1996 and 2005 are presented in Table IV.
TABLE IV.MEAN RELATIVE ERRORS OF THE RECOMMENDED AND OTHER
METHODS
Algorithms Mean Relative Error
TSA 1.71 PSO 1.43 ACO 1.41 BA 1.35 DEA 1.33 AAA 1.33 MTSA 1.33
The lower the mean relative error rate for the EDF problem, the forecast results obtained will be as close to the OED values. In other words, an accurate estimation of the recommended method depends on the mean relative error. In the light of this information, it was seen that DEA, AAA and MTSA which is the recommended method in Table V had the lowest mean relative error with 1.33 value. TSA, PSO, ACO and BA methods fell behind the MTSA. Thus, it can be said that MTSA, DEA and AAA methods are closer to the OED values since they had at least mean relative error rate. Therefore, MTSA has obtained more successful estimates of energy demand than other methods (TSA, PSO, ACO and BA). Estimated energy demand amounts of MTSA, DEA, AAA, TSA, BA, PSO and ACO algorithms between 1996-2005 and the OED quantities in those years are shown in Figure 3.
When Figure 3 is examined, it is seen that DEA, AAA and MTSA, which is the proposed method, make similar estimations and get close to the OED according to other algorithms. The original TSA was found to be below the observed value. Original TSA, compared with the proposed method MTSA, it was seen that MTSA achieved a better result.
Figure 3. Comparison of EDF of algorithms
B. Future Projections of EDF Using MTSA and TSA Methods
After showing the success of the proposed methods according to the existing methods in the literature, between the years 1979-2005 with current data for calculating linear forms scenario, EDF was carried out in Turkey for the years between 2006 and 2025.
Three different scenarios were used to forecasting the energy demand of Turkey between the years 2006-2025 [43].
1st Scenario: It is presumed that between the years 2006-2025, the average GDP growth ratio is 4%, the population growth ratio is 0.5%, the import growth ratio is 2.5% and export growth ratio is 3%.
2nd Scenario: It is presumed that between the years 2006-2025, the average GDP growth ratio is 5%, the population growth ratio is 0.6%, the import growth ratio is 3.5% and export growth ratio is 3.5%.
3rh Scenario: It is presumed that between the years 2006-2025, the average GDP growth ratio is 6%, the population growth ratio is 0.7%, the import growth ratio is 4% and export growth ratio is 5.5%.
The energy demand estimation values obtained between 2006 and 2025 by using the coefficients obtained by MTSA and TSA method and the scenarios given are given in Table
V. The OED between 2006 and 2014 was used as test data. When Table V is evaluated in general, it is seen that the 2nd Scenario, especially for the MTSA method, makes estimations closer to the OED compared to other scenarios. The second closest estimate to the test data was obtained by the 2nd Scenario in the TSA method. Other scenarios fall
behind these two scenarios and are expected to have low success in the EDF for the coming years. Therefore, it can be said that the MTSA method will predict energy demand in the coming years more successfully with the 2nd Scenario.
TABLE V.FUTURE PROJECTIONS OF THE TOTAL ENERGY DEMAND OF PROPOSED METHODS ACCORDING TO SCENARIO 1,2 AND 3
MTSA TSA Years OED 1th Scenario 2nd Scenario 3rd Scenario 1th Scenario 2nd Scenario 3rd Scenario 2006 99.59 94.68 104.41 94.13 94,13 100,48 93,71 2007 107.63 96.33 105.64 95.20 95,50 101,55 94,65 2008 106.34 98.06 106.93 96.32 96,95 102,66 95,63 2009 106.14 99.88 108.28 97.50 98,46 103,82 96,65 2010 109.27 101.80 109.68 98.73 100,05 105,02 97,72 2011 114.48 103.81 111.14 100.02 101,72 106,28 98,83 2012 120.09 105.92 112.66 101.37 103,47 107,59 99,98 2013 120.29 108.14 114.25 102.78 105,30 108,95 101,19 2014 123.94 110.47 115.91 104.27 107,23 110,37 102,45 2015 129.3 112.92 117.64 105.82 109,25 111,85 103,77 2016 136.2 115.49 119.45 107.45 111,37 113,40 105,14 2017 143.4 118.19 121.34 109.16 113,60 115,01 106,58 2018 N/A 121.02 123.31 110.96 115,93 116,70 108,08 2019 N/A 124.00 125.37 112.84 118,39 118,45 109,64 2020 N/A 127.13 127.52 114.81 120,96 120,29 111,28 2021 N/A 130.41 129.77 116.88 123,67 122,21 112,99 2022 N/A 133.86 132.12 119.06 126,51 124,21 114,79 2023 N/A 137.48 134.58 121.34 129,49 126,30 116,66 2024 N/A 141.28 137.15 123.74 132,62 128,49 118,62 2025 N/A 145.27 139.84 126.25 135,90 130,77 120,67
The comparison of the EDF results of the proposed methods with the OED data is given in graphs for all scenarios in Figures 4, 5 and 6. Since the MTSA method provided a closer approximation to the OED compared to
the TSA method, a graphical analysis of the MTSA according to 1st Scenario, 2nd Scenario and 3rh Scenario was made and is presented in Figure 7.
Figure 5. Future EDF of the proposed methods for Scenario 2
Figure 6. Future EDF of the proposed methods for Scenario 3
Figure 7. Prediction of MTSA's future energy demand according to scenarios
V. CONCLUSION
MTSA and TSA methods were applied to the EDF optimization problem. It was determined that the population number for MTSA and TSA methods was as 100, ST value was as 0.1 and MaxFEs was as 200.000. To compare the proposed methods and the methods in the literature (ACO, PSO, BA, DEA and AAA) and to analyse them healthily, as in the methods in the literature, the gross domestic product (GDP) in 1979-2005 for MTSA and TSA methods, population, import and export data were taken into consideration and an estimation model was created for energy demand. Also, to ensure the validity of the model, the energy demand values used in 2006-2014 were used for testing purposes. The energy demand generated by the proposed methods is modelled under three possible scenarios and compared with the energy demand values observed in those years. Estimation success of MTSA and
TSA methods for energy demand varies depending on the scenarios and data set used in the study. When the scenarios are analysed, it is seen that the energy demand values obtained by the MTSA method for Scenario 2 are closer to the OED. As a result, it was observed that MTSA method is a successful estimation tool for energy demand since MTSA method has a lower average relative error compared to TSA with 1.33 value.
REFERENCES
[1] H. Ceylan and H. K. Ozturk, "Estimating energy demand of Turkey based on economic indicators using a genetic algorithm approach," Energy Conversion and Management, vol. 45, no. 15, pp. 2525-2537, 2004, doi:10.1016/j.enconman.2003.11.010.
[2] H. Tatli and K. Besir, "The Place of Turkey in the OECD Countries in the Context of Energy Consumption and Energy Prices," vol. 8, no. 15, pp. 353-376, 2018, doi:10.29029/busbed.389920.
[3] G. Günes and E. Aslan, "Use of renewable energy sources and its effects to sustainable tourism – Turkey Example," in Doğu Karadeniz
Bölgesi Sürdürülebilir Turizm Kongresi, pp. 221-234: Gümüşhane Üniversitesi Yayınları-31, Gümüshane/Turkey, 2015.
[4] A. Sozen, E. Arcaklioglu, and M. Ozkaymak, "Modelling of Turkey's net energy consumption using artificial neural network," Int. J. Comput. Appl. Technol., vol. 22, no. 2/3, pp. 130-136, 2005, doi:10.1504/IJCAT.2005.006944
[5] E. Bergasse, W. Paczynski, M. Dabrowski, L. De Wulf, "The relationship between energy and socio-economic development in the Southern and Eastern Mediterranean," CASE Network Reports, no. 412, 2013.
[6] H. Ogurlu, "Long Term Electrical Load Forecasting of Turkey Using Mathematical Modeling," MS, Selçuk Üniversitesi Fen Bilimleri Enstitüsü, 2011.
[7] M. F. Tefek, H. Uguz and M. Gucyetmez, "A new hybrid gravitational search–teaching–learning-based optimization method for energy demand estimation of Turkey," Neural Computing and Applications, vol. 31, pp. 2939-2954, 2019, doi:10.1007/s00521-017-3244-9.
[8] A. Unler, "Improvement of energy demand forecasts using swarm intelligence: The case of Turkey with projections to 2025," Energy Policy, vol. 36, no. 6, pp. 1937-1944, 2008, doi:10.1016/j.enpol.2008.02.018.
[9] Z.W. Geem, W.E. Roper, "Energy demand estimation of South Korea using artificial neural network," Energy Policy, vol. 37, no. 10, pp. 4049-4054, 2009, doi:10.1016/j.enpol.2009.04.049.
[10] L. Ekonomou, "Greek long-term energy consumption prediction using artificial neural networks," Energy, vol. 35, no. 2, pp. 512-517, 2010, doi:10.1016/j.energy.2009.10.018.
[11] S. Yu, K. Zhu, "A hybrid procedure for energy demand forecasting in China," Energy, vol. 37, no. 1, pp. 396-404, 2012, 10.1016/j.energy.2011.11.015.
[12] M. Piltan, H. Shiri, S. Ghaderi, "Energy demand forecasting in Iranian metal industry using linear and nonlinear models based on evolutionary algorithms," Energy conversion and management, vol. 58, pp. 1-9, 2012, doi:10.1016/j.enconman.2011.12.022.
[13] J. Sánchez-Oro, A. Duarte, S. Salcedo-Sanz, "Robust total energy demand estimation with a hybrid Variable Neighborhood Search– Extreme Learning Machine algorithm," Energy Conversion and Management, vol. 123, pp. 445-452, 2016, doi:10.1016/j.enconman.2016.06.050.
[14] Z. Mohamed, P. Bodger, "Forecasting electricity consumption in New Zealand using economic and demographic variables," Energy, vol. 30, no. 10, pp. 1833-1843, 2005, doi:10.1016/j.energy.2004.08.012. [15] V. Bianco, O. Manca, S. Nardini, "Electricity consumption
forecasting in Italy using linear regression models," Energy, vol. 34, no. 9, pp. 1413-1421, 2009, doi:10.1016/j.energy.2009.06.034. [16] S. Yu, K. Zhu, X. Zhang, "Energy demand projection of China using
a path-coefficient analysis and PSO–GA approach," Energy Conversion and Management, vol. 53, no. 1, pp.142-153, 2012, doi:10.1016/j.enconman.2011.08.015.
[17] S. Yu, Y. Wei, K. Wang, "A PSO–GA optimal model to estimate primary energy demand of China," Energy Policy, vol. 42, pp. 329-340, 2012, doi:10.1016/j.enpol.2011.11.090.
[18] E. Erdogdu, "Electricity demand analysis using cointegration and ARIMA modelling: A case study of Turkey," Energy Policy, vol. 35, no. 2, pp. 1129-1146, 2007, doi:10.1016/j.enpol.2006.02.013. [19] WECTNC, World Energy Council, Energy Report-2014, Ankara,
ISSN: 1301-6318 (Ankara, May). 2015.
[20] M. Afzalirad, M. Shafipour, "Design of an efficient genetic algorithm for a resource-constrained unrelated parallel machine scheduling problem with machine eligibility restrictions," Journal of Intelligent Manufacturing, vol. 29, no. 2, pp. 423-437, 2018, doi:10.1007/s10845-015-1117-6.
[21] A. Mucherino, O. Seref, "Modeling and solving real-life global optimization problems with meta-heuristic methods," Advances in Modeling Agricultural Systems, pp. 403-419, 2009, doi:10.1007/978-0-387-75181-8_19.
[22] I. Pence, M.S. Cesmeli, F.A. Senel, B. Cetisli, "A new unconstrained global optimization method based on clustering and parabolic approximation," Expert Systems with Applications, vol. 55, pp. 493-507, 2016, doi:10.1016/j.eswa.2016.02.036.
[23] A. Gaudiani, E. Luque, P. García, M. Re, M. Naiouf and A. Giusti, "How a computational method can help to improve the quality of river flood prediction by simulation," Advances and New Trends in Environmental and Energy Informatics, pp. 337-351, 2016.
[24] H. Shareef, M.M. Islam, A.A. Ibrahim, A.H. Mutlag, "A Nature Inspired Heuristic Optimization Algorithm Based on Lightning," 2015 3rd International Conference on Artificial Intelligence, Modelling and Simulation (AIMS), pp. 9-14, 2015, doi:10.1109/AIMS.2015.12.
[25] P. Agarwal and S. Mehta, " Nature-inspired algorithms: state-of-art, problems and prospects," International Journal of Computer Applications, vol. 100, no. 14, pp. 14-21, 2014.
[26] S. Akyol and B. Alataş, "The Current Swarm Intelligence Optimization Algorithms," Nevşehir Bilim ve Teknoloji Dergisi, vol. 1, no. 1, pp. 36-40, 2012.
[27] B. Akay and D. Karaboga, "A modified Artificial Bee Colony algorithm for real-parameter optimization," Information Sciences, vol. 192, no. Supplement C, pp. 120-142, 2012, doi:10.1016/j.ins.2010.07.015.
[28] J. Chen, W. Yu, J. Tian, L. Chen, and Z. Zhou, "Image contrast enhancement using an artificial bee colony algorithm," Swarm and Evolutionary Computation, vol. 38, pp. 287-294, 2018, doi:10.1016/j.swevo.2017.09.002.
[29] S. G. Ahmad, C. S. Liew, E. U. Munir, T. F. Ang, and S. U. Khan, "A hybrid genetic algorithm for optimization of scheduling workflow applications in heterogeneous computing systems," Journal of Parallel and Distributed Computing, vol. 87, pp. 80-90, 2016, doi:10.1016/j.jpdc.2015.10.001.
[30] S. Yilmaz and E. U. Kucuksille, "A new modification approach on bat algorithm for solving optimization problems," Applied Soft Computing, vol. 28, no. Supplement C, pp. 259-275, 2015, doi:10.1016/j.asoc.2014.11.029.
[31] M. S. Kiran, E. Ozceylan, M. Gunduz, and T. Paksoy, "A novel hybrid approach based on Particle Swarm Optimization and Ant Colony Algorithm to forecast energy demand of Turkey," Energy Conversion and Management, vol. 53, no. 1, pp. 75-83, 2012, doi:10.1016/j.enconman.2011.08.004.
[32] M. S. Kiran, E. Ozceylan, M. Gunduz, and T. Paksoy, "Swarm intelligence approaches to estimate electricity energy demand in Turkey," Knowledge-Based Systems, vol. 36, pp. 93-103, 2012, doi:10.1016/j.knosys.2012.06.009.
[33] M. Bayrak and O. Esen, "Forecasting Turkey’s energy demand using artificial neural networks: Future Projection Based on an Energy Deficit," Journal of Applied Economic Sciences, vol. 2, no. 28, pp. 191-204, 2014.
[34] B. Cayir Ervural and B. Ervural, "Improvement of grey prediction models and their usage for energy demand forecasting," Journal of Intelligent & Fuzzy Systems, vol. 34, no. 4, pp. 2679-2688, 2018, doi:10.3233/JIFS-17794.
[35] M. S. Kiran, "TSA: Tree-seed algorithm for continuous optimization," Expert Systems with Applications, vol. 42, no. 19, pp. 6686-6698, 2015, doi:10.1016/j.eswa.2015.04.055.
[36] M. Aslan, M. Beskirli, H. Kodaz, M.S. Kiran, "An improved tree seed algorithm for optimization problems," Int J Mach Learn Comput, vol. 8, no. 1, pp. 20-25, 2018, doi:10.18178/ijmlc.2018.8.1.657.
[37] M. Beskirli, "Performance Analysis of Tree Seed Algorithm in High Dimensional Test Functions," European Journal of Science and Technology, (Special Issue), pp. 93-101, 2019, doi:10.31590/ejosat.636416.
[38] M. F. Tefek and H. Uguz, " Solution of economic dispatch problem for wind-thermal power systems by a modified hybrid optimization method," Journal of the Faculty of Engineering and Architecture of Gazi University, vol. 34, no. 4, pp. 1871-1895, 2019, doi:10.17341/gazimmfd.571617.
[39] A. Beskirli, D. Ozdemir, and H. Temurtas, "A comparison of a modified tree–seed algorithm for high-dimensional numerical functions," Neural Computing and Applications, pp. 1-35, 2019, doi:10.1007/s00521-019-04155-3.
[40] WECTNC, World Energy Council, Energy Report-2013, Ankara (in Turkish), ISSN: 1301-6318 (Ankara, Ocak). 2014.
[41] NS, "National Statistics, http://www.tuik.gov.tr (in Turkish)," 2016. [42] M. F. Tefek and H. Uguz, "Estimation of Turkey Electric Energy
Demand until the Year 2035 Using TLBO Algorithm" International Journal of Intelligent Systems and Applications in Engineering, vol. 4, pp. 48-52, 2016, doi:10.18201/ijisae.266082.
[43] M. Beskirli, H. Hakli, and H. Kodaz, "The energy demand estimation for Turkey using differential evolution algorithm," Sādhanā, vol. 42, no. 10, pp. 1705-1715, 2017, doi:10.1007/s12046-017-0724-7. [44] D. M. Toksarı, "Ant colony optimization approach to estimate energy
demand of Turkey," Energy Policy, vol. 35, no. 8, pp. 3984-3990, 2007, doi:10.1016/j.enpol.2007.01.028.
[45] H. Hakli and H. Uguz, "Estimating energy demand of turkey using bat algorithm model," in International Journal of Arts & Sciences, Prague, Czech Republic, 2014.
[46] A. Beskirli, M. Beskirli, H. Hakli, and H. Uguz, "Comparing energy demand estimation using artificial algae algorithm: The case of Turkey," Journal of Clean Energy Technologies, vol. 6, no. 4, 2018, doi:10.18178/jocet.2018.6.4.487.