Received 02/17/2020 Review began 02/19/2020 Review ended 02/20/2020 Published 02/25/2020 © Copyright 2020
Yurdaisik et al. This is an open access article distributed under the terms of the Creative Commons Attribution License CC-BY 4.0., which permits unrestricted use, distribution, and reproduction in any medium, provided the original author and source are credited.
Accuracy of Multi-echo Dixon Sequence in
Quantification of Hepatic Steatosis
Isil Yurdaisik , Fuad Nurili
1. Radiology, Istinye University Gaziosmanpasa Medical Park Hospital, Istanbul, TUR 2. Radiology, Memorial Sloan Kettering Cancer Center, New York, USA
Corresponding author: Isil Yurdaisik, [email protected]
Abstract
ObjectiveToday, a biopsy is the gold standard in the diagnosis of non-alcoholic fatty liver. However, a biopsy is an invasive technique, limited to the sample taken, and it may lead to misdiagnosis. Therefore, novel noninvasive options are needed. The objective of this study was to investigate the accuracy of magnetic resonance (MR) Dixon sequence and elastography using magnetic resonance spectroscopy (MRS) as a reference in the quantification of hepatic steatosis. Methods
A total of 60 patients were included in the study. All patients underwent magnetic resonance imaging (MRI), MRS, and elastography in order to quantify hepatosteatosis. MRI and MRS imaging studies were performed using MR Dixon and high-speed T2-corrected multiple-echo 1H-MRS sequence (HISTO) sequences, respectively, in order to calculate proton density fat fraction (PDFF) values.
Results
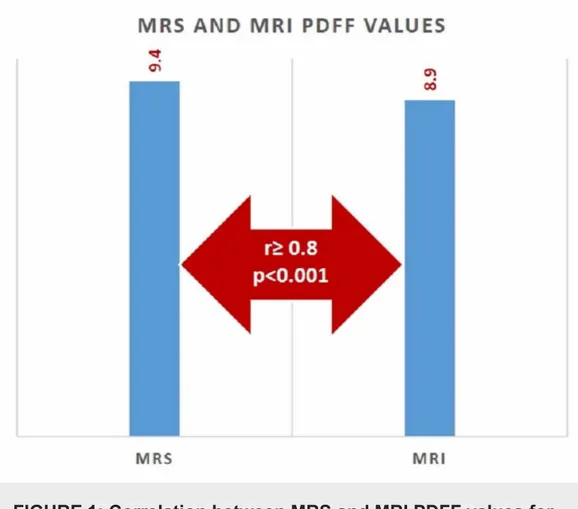
The mean MRI-PDFF value with the MRS region of interest (ROI) was found as 9.4% ± 12.1%. The mean MRS-PDFF was found as 8.9% ± 11.3%. No statistically significant difference was found between MRS-PDFF and MRI-PDFF values measured in ROI (p < 0.005). The correlation between MRS-PDFF and MRI-PDFF was examined with Spearman’s correlation analysis. Accordingly, there was an excellent correlation between MRS and MRI values measured in ROI (r ≥ 0.8, p < 0.001). Sensitivity, specificity, positive predictive value, and negative predictive value were calculated as 96%, 100%, 89.5%, and 92.6%, respectively, for MRI-PDFF in
predicting hepatic steatosis for the same ROI localization with MRS. The optimum cut-off value of MRS-PDFF in predicting hepatic steatosis was found as 5.3% using the same ROI localization with MRS.
Conclusion
The results of this study indicated an excellent correlation between MRI-PDFF and MRS-PDFF. The multi-echo Dixon MRI technique seems a promising alternative method in the detection of non-alcoholic fatty liver disease.
Categories: Internal Medicine, Radiology, Gastroenterology
Keywords: non-alcoholic fatty liver disease, magnetic resonance spectroscopy, proton density fat
1 2
Open Access Original
Article DOI: 10.7759/cureus.7103
fraction, elastography
Introduction
Non-alcoholic hepatic steatosis is a disease characterized by the accumulation of
triacylglycerol (TAG)-rich macrovesicular or microvesicular lipid droplets in hepatocytes [1]. Non-alcoholic fatty liver disease (NAFLD) is defined as at least 5% of hepatocytes containing intrahepatic TAG or lipid vacuoles in the absence of alcohol-abusing or viral infections. Hepatic steatosis is classified as Grade 0 (healthy, < 5%), Grade I (mild, 5% - 33%), Grade II (moderate, 34% - 66%), and Grade III (severe, < 66%), depending on the fat percentage in the hepatocytes
[2]. Steatosis may progress to nonalcoholic steatohepatitis, cirrhosis, or hepatocellular carcinoma. Hepatic steatosis is also a risk factor for liver transplantation and chronic kidney disease [3]. The clinical importance of fatty liver disease has resulted from its high prevalence in the general population, a wide spectrum of risk factors, and its potential of progression to cirrhosis or hepatocarcinoma. Because of the use of highly variable and subjective diagnostic criteria, the prevalence of hepatic steatosis has been reported between 3% and 39% [4-5].
The most reliable method for the detection of fatty liver is hepatic needle biopsy [6]. Today, a biopsy is the gold standard in the diagnosis of fatty liver disease. However, a biopsy is an invasive technique, limited to the sample taken, and it may lead to misdiagnosis [7]. Biopsy outcomes can differ depending on the area where the sample is taken. In addition, the volume of the typical liver piece analyzed is about 1/50,000 of the total volume of the organ [8]. Therefore, less invasive methods are needed. Ultrasonography (US) is currently the basic imaging system used for the detection of hepatic steatosis. US is an inexpensive and easily available method without radiation exposure. However, US cannot quantify liver fat and it has low sensitivity and specificity in predicting mild steatosis. Computed tomography (CT) also can rapidly detect hepatic steatosis. However, it requires radiation exposure and its diagnostic accuracy is low in predicting mild steatosis.
Magnetic resonance spectroscopy (MRS) has been used since 2005 in order to determine hepatic triglyceride concentration through the difference between resonance frequencies of water and fat [9]. Today, MRS is thought of as the non-invasive gold standard in the quantification of hepatic steatosis. However, MRS is limited to spatial coverage and is difficult to perform and analyze. Proton density fat fraction (PDFF) is shown as a practical alternative to MRS as a promising technique, which covers entire liver volume in a single breath-hold. Some studies have investigated the multi-echo Dixon method using MRS as the reference in order to quantify the fat content of the liver [10]. These studies have demonstrated that both methods eliminated the need for hepatic biopsy when PDFF was < 5%. In recent years, elastography has been successfully used to determine tissue stiffness in various organs, such as breast, tendons, and liver [11]. Preliminary reports have shown that changes in the liver parenchyma can be detected using the shear wave elastography technique. Elastography quantifies liver fat by measuring the propagation speed of ultrasound waves crossing the liver. As fibrosis progresses, liver tissue becomes stiff and the waves propagate more rapidly. It is possible to determine the degree of stiffness, and thus, the stage of the fatty liver, based on the propagation speed of the waves. The objective of this study was to investigate the accuracy of magnetic resonance Dixon (MR Dixon) sequence and elastography using MRS as a reference in the quantification of the hepatic steatosis form of non-alcoholic fatty liver disease.
Materials And Methods
A total of 60 patients who were referred to our clinic for liver imaging investigations between December 2019 and February 2020 accepted to participate and were included in this study. The patients’ demographic data, such as age and gender, body mass index, and biochemical analysis
outcomes were recorded. In addition, grades of hepatic steatosis were determined during the first US examinations and recorded. All patients underwent magnetic resonance imaging (MRI), MRS and elastography in order to quantify hepatosteatosis.
Patients with type I diabetes, drug-induced hepatitis, chronic liver disease, hepatic virus infection, a history of alcohol abuse with higher than 210 g a week in men and 140 g a week in women, and those with MRI contraindications, such as metallic implants and claustrophobia were excluded from the study. MRI and MRS imaging studies were performed using MR Dixon and high-speed T2-corrected multiple-echo 1H-MRS (HISTO) sequences, respectively, in order to calculate PDFF values.
MRI
Multi-echo gradient-echo sequences were performed with T2 correction [12]. In order to reduce the effects of T1 weighting, a low flip angle (4°C) was used [13]. Six fractional echo magnitude images were acquired during breath-holding. The center of the liver, coil, and magnetic area were aligned before the screening. A screening Dixon sequence was used to roughly and rapidly measure hepatic fat fraction. Water images, fat images, MRI-PDFF maps, and MR Dixon screening reports were obtained automatically. Screening findings were determined as normal or fat infiltration according to the 5% cut-off value. A circular region of interest (ROI) of 15 mm was colocalized with the MRS voxel on the corresponding PDFF map.
MRS
Single-voxel MRS (HISTO) with stimulated acquisition mode (STEAM) was performed as the reference. Since T2 decay differs between water and fat, we used high-speed T2 correction to avoid over-evaluation [14]. Five STEAM spectra were produced during a single breath-hold of 15 seconds. A flip angle of 90°C and an ROI of 15 x 15 x 15 mm were used. MRS PDFF values were calculated by the ratio of areas under fat peaks to the sum of the areas underwater and fat peaks.
Elastography
Real-time (supersonic)-two dimensional (2D) shear wave elastography (rt-SWE) was applied as intercostal. Patients were placed in the supine or lateral position with the right arm elevated above the head. Patients were instructed to hold their breath for 5 to 10 seconds while the measurements were made. Colored charts showing liver stiffness were used. In addition to visual assessment of these colored charts, quantitative ROI-based SWE measurement was made in the “stiffest” appearing areas in kilopascals (kPa). The measurements were performed in five different areas of the liver parenchyma and all SWE values were recorded [15].
Ethics statement
Before the beginning of the study, the necessary approval was obtained from the Istinye University Clinical Research Ethics Committee (approval 212019.K-19). All patients who accepted to participate were informed in detail about the objectives of the study and gave written and verbal consent. The study was conducted in accordance with the ethical principles of the Declaration of Helsinki.
Statistical analysis
Data obtained in the study were analyzed using the IBM Statistical Package for Social Sciences (SPSS), version 22.0 software (IBM SPSS Statistics, Armonk, NY). PDFF values of the patients were expressed as mean ± standard deviation. The normality of the data was tested with the Kolmogorov-Smirnov method. Since the data showed no normal distribution, the correlation
between MRS and MRI values was examined with Spearman’s correlation analysis. In order to determine the diagnostic accuracy of the MRI-PDFF (based on the MRS-PDFF as a reference), the sensitivity, specificity, positive predictive value, and negative predictive value of the MRI were calculated. The optimum cut-off value was determined using receiver operating characteristic (ROC) analysis. A p-value < 0.05 was considered statistically significant.
Spearman's rank correlation coefficient was considered to indicate a weak correlation between 0.2 - 0.4, a moderate correlation between 0.4 - 0.6, a good correlation between 0.6 - 0.8, and an excellent correlation at a value > 0.8.
Results
A total of 60 patients (30 females (50%), 30 males (50%)) who were referred to our clinic for liver investigations between December 2019 and February 2020 were included in the study. The mean age of the patients was 47.25 ± 14.30 years (range: 24 - 75). The mean age was found as 46.53 ± 13.98 (range: 24 - 72) years in male and 47.97 ± 14.29 (range: 25 - 75) years in female patients. No significant difference was found between the male and female patients (p > 0.05). The mean body mass index (BMI) value of the participants was found as 27.55 ± 5.59 kg/m2. Evaluating the patients by BMI values; 20 (33.33%) patients were normal, 25 (45.67%) patients were overweight, and 15 (25%) were obese.
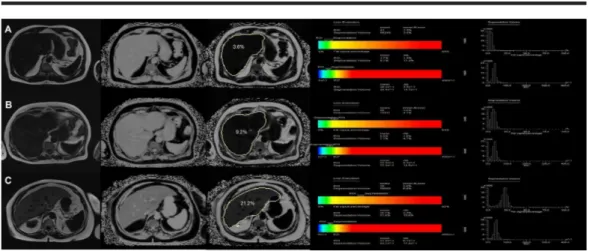
The mean MRI-PDFF value with MRS ROI was found as 9.4% ± 12.1%. The mean MRS-PDFF was found as 8.9% ± 11.3%. No statistically significant difference was found between MRS-PDFF and MRI-PDFF values measured in ROI (p < 0.005) (Figure 1). Examples of the multi-echo Dixon and magnetic resonance spectroscopy with different percentages of PDDF values are given in Figure 2.
FIGURE 1: Correlation between MRS and MRI PDFF values for
predicting hepatic steatosis
MRI: magnetic resonance imaging; MRS: magnetic resonance spectroscopy; PDFF: proton density fat fraction
FIGURE 2: Examples of the multi-echo Dixon (left) and
magnetic resonance spectroscopy (right) in three different
participants with different percentages of proton density fat
fraction values at ROI
A) PDFF of 3.6% measured by MRI and 3.7% by MRS in Patient 1; B) PDFF was measured as 9.2% by MRI and 8.8% by MRS in Patient 2; C) PDFF value of 21.2% by MRI and 20.1% by MRS in Patient 3
MRI: magnetic resonance imaging; MRS: magnetic resonance spectroscopy; PDFF: proton density fat fraction; ROI: region of interest
The correlation between MRS-PDFF and MRI-PDFF was examined with Spearman’s correlation analysis. Accordingly, there was an excellent correlation between MRS and MRI values
measured in ROI (r ≥ 0.8, p < 0.001).
When MRS-PDFF was taken as a reference, sensitivity, specificity, positive predictive value, and negative predictive value were calculated as 96%, 100%, 89.5%, and 92.6%, respectively, for MRI-PDFF in predicting hepatic steatosis for the same ROI localization with MRS. According to the ROC analysis, the optimum cut-off value of MRS-PDFF in predicting hepatic steatosis was found as 5.3% using the same ROI localization with MRS. The area under the curve (AUC) value of MRI-PDFF was found as 0.989 (95% confidence interval (CI): 0.972 - 1.00).
In our study, all patients underwent elastography at the same time in order to determine hepatic steatosis through hepatic tissue stiffness. Stiffness degrees were correlated with MRI-PDFF and MRS MRI-PDFF values, although these correlations were not statistically significant (both p > 0.05).
Discussion
Non-alcoholic fatty liver disease has reached epidemic sizes in most developed countries. The strong association between hepatic fat, metabolic syndrome, and cardiovascular diseases make hepatic steatosis even more important [16].
Hepatic steatosis is typically encountered in radiology practice mostly as an incidental finding or a part of investigations performed for high liver enzymes. Hepatic steatosis can be detected with ultrasonography, but this method is largely subjective and does not provide
quantification. In recent years, newer methods have been introduced for this purpose. MRS is accepted as the most accurate method for PDFF measurement. However, its availability is limited, it is not completely supported by the system software of clinical MRI scanners, and MRS requires technical expertise [12]. Although various MR techniques can detect hepatic steatosis, newer PDFF techniques have replaced spectroscopy as a non-invasive reference standard [17]. Comparing with MRS, multi-echo MRI techniques have several advantages in the detection of hepatic steatosis. MRI is more easily available. In addition, MRI can quantify hepatic fat content both in ROI and the entire liver. Therefore, when liver fat is distributed in a nonhomogeneous way, sampling errors are avoided. Furthermore, the image can not be obtained with MRS during breath-holding, and the operator should perform complex processes using specific software [18].
In the present study, the accuracy of the MRI Dixon sequence in predicting hepatic steatosis was investigated based on MRS (HISTO) sequences as a reference. According to the results of this study, we concluded that the use of MRI in the determination of hepatic steatosis is appropriate.
In our study, using the same ROI with MRS, the mean MRI-PDFF value was found as 9.4% and the mean MRS-PDFF value at 8.9%. In a study by Zhao et al. investigating the accuracy of multi-echo Dixon sequence in the detection of hepatic steatosis in Chinese children and adolescents, using the same ROI with MRS, the mean MRI-PDFF was found as 9.9% and MRS-PDFF as 9.1%
[19].
In our study, the correlation between MRI-PDFF and MRS-PDFF was examined using
Spearman’s correlation analysis. Accordingly, an excellent correlation was found between both methods (r ≥ 0.8, p < 0.001). In a study by Idilman et al., an excellent correlation was observed between these two methods in detecting hepatic steatosis (r = 0.986, p < 0.001) [20]. The authors reported that MRI-PDFF and MRS correctly distinguished moderate/severe steatosis from mild steatosis these two methods were not superior over each other. Again, in a study by Kang et al., a significant correlation was found between the modified Dixon MR technique and MRS [21]. Similar results were reported by Tang et al. and Kukuk et al. [22-23]. Recently, two studies (with one being conducted in adults and the other in children) evaluated patients with known or suspected non-alcoholic fatty liver [24-25]. In these studies, when MRI and MRS measurements were carefully colocalized, the longitudinal change in MRI-PDFF values was found to be closely correlated with longitudinal change in MRS-PDFF values (r = 0.96 and r = 0.986, respectively).
In our study, the sensitivity of MRI in predicting hepatic steatosis was found as 96% and specificity as 100%. The sensitivity and specificity of MRI in detecting mild hepatic steatosis have been reported between 76.7% - 90.0% and 87.1% - 91%, respectively, in the literature [26-27]. In a study by Mazhar et al. who were investigating the non-invasive evaluation of hepatic steatosis, sensitivity and specificity of MRI in detecting mild hepatic steatosis was reported as 85% and 100% [28].
In the present study, the optimum cut-off value of MRI in detecting hepatic steatosis was found to be 5.3%. Zhao et al. reported optimum MRI-PDFF threshold values as 5.1% [19]. However, there are studies reporting lower cut-off values in the literature [10, 29-30]. We attributed the differences in MRI-PDFF cut-off values among the studies to the differences between patient groups included and not including biopsy outcomes in some studies, as in our study.
The strengths of our study are its prospective design, a relatively high number of patients, and evaluation of MRS and MRI findings with elastography at the same time.
The most important limitation of our study was not including liver biopsy outcomes. We think that biopsy in all patients with mild or absent hepatic steatosis may not be reasonable. Finally, we could not compare MRS and MRI findings with biomedical parameters.
Conclusions
The results of this study indicated an excellent correlation between MRI-PDFF and MRS-PDFF. The multi-echo Dixon MRI technique seems a promising alternative method in the detection of non-alcoholic fatty liver disease. However, the introduction of this relatively newer method into routine practice requires further multicenter and comprehensive studies, including various patient groups.
Additional Information
Disclosures
Human subjects: Consent was obtained by all participants in this study. Istinye University Clinical Research Ethics Committee issued approval 212019.K-19. The authors declare no conflict of interest regarding this manuscript. Animal subjects: All authors have confirmed that this study did not involve animal subjects or tissue. Conflicts of interest: In compliance with the ICMJE uniform disclosure form, all authors declare the following: Payment/services info: All authors have declared that no financial support was received from any organization for the submitted work. Financial relationships: All authors have declared that they have no financial relationships at present or within the previous three years with any organizations that might have an interest in the submitted work. Other relationships: All authors have declared that there are no other relationships or activities that could appear to have influenced the submitted work.
References
1. Mehta SR, Thomas EL, Bell JD, Johnston DG, Taylor-Robinson SD: Non-invasive means of measuring hepatic fat content. World J Gastroenterol. 2008, 14:3476-3483.
10.3748/wjg.14.3476
2. Qayyum A, Nystrom M, Noworolski SM, Chu P, Mohanty A, Merriman R: MRI steatosis grading: development and initial validation of a color mapping system. AJR Am J Roentgenol. 2012, 198:582-588. 10.2214/AJR.11.6729
3. Losurdo G, Castellaneta A, Rendina M, Carparelli S, Leandro G, Di Leo A: Systematic review with meta‐analysis: de novo non‐alcoholic fatty liver disease in liver‐transplanted patients. Aliment Pharmacol Ther. 2018, 47:704-714. 10.1111/apt.14521
4. Adams LA, Lymp JF, St Sauver J, Sanderson SO, Lindor KD, Feldstein A, Angulo P: The natural history of nonalcoholic fatty liver disease: a population-based cohort study. Gastroenterology. 2005, 129:113-121. 10.1053/j.gastro.2005.04.014
5. Angulo P: Nonalcoholic fatty liver disease . N Engl J Med. 2002, 346:1221-1231.
10.1056/NEJMra011775
6. Joy D, Thava VR, Scott BB: Diagnosis of fatty liver disease: is biopsy necessary? . Eur J Gastroenterol Hepatol. 2003, 15:539-543. 10.1097/01.meg.0000059112.41030.2e
7. El-Badry AM, Breitenstein S, Jochum W, et al.: Assessment of hepatic steatosis by expert pathologists: the end of a gold standard. Ann Surg. 2009, 250:691-697.
10.1097/SLA.0b013e3181bcd6dd
8. Barr RG, Ferraioli G, Palmeri ML, et al.: Elastography assessment of liver fibrosis: Society of Radiologists in Ultrasound Consensus Conference Statement. Ultrasound Q. 2016, 32:94-107.
10.1097/RUQ.0000000000000209
of tissue fat concentration. J Magn Reson Imaging. 2012, 36:1011-1014. 10.1002/jmri.23741
10. Rehm JL, Wolfgram PM, Hernando D, Eickhoff JC, Allen DB, Reeder SB: Proton density fat-fraction is an accurate biomarker of hepatic steatosis in adolescent girls and young women. Eur Radiol. 2015, 25:2921-2930. 10.1007/s00330-015-3724-1
11. Yurdaisik I: Evaluation of the efficacy of computed tomography angiography in the diagnosis of brain death. Selcuk Med J. 2019, 35:242-248. 10.30733/std.2019.01158
12. Yokoo T, Shiehmorteza M, Hamilton G, et al.: Estimation of hepatic proton-density fat fraction by using MR imaging at 3.0 T. Radiology. 2011, 258:749-759. 10.1148/radiol.10100659
13. Heba ER, Desai A, Zand KA, et al.: Accuracy and the effect of possible subject-based confounders of magnitude-based MRI for estimating hepatic proton density fat fraction in adults, using MR spectroscopy as reference. J Magn Reson Imaging. 2016, 43:398-406.
10.1002/jmri.25006
14. Bydder M, Yokoo T, Hamilton G, et al.: Relaxation effects in the quantification of fat using gradient echo imaging. Magn Reson Imaging. 2008, 26:347-359. 10.1016/j.mri.2007.08.012
15. European Association for Study of Liver; Asociación Latinoamericana para el Estudio del Hígado: EASL-ALEH clinical practice guidelines: non-invasive tests for evaluation of liver disease severity and prognosis. J Hepatol. 2015, 63:237-64. 10.1016/j.jhep.2015.04.006
16. Targher G, Day CP, Bonora E: Risk of cardiovascular disease in patients with nonalcoholic fatty liver disease. N Engl J Med. 2010, 363:1341-1350. 10.1056/NEJMra0912063
17. Hines CDG, Frydrychowicz A, Hamilton G, et al.: T1 independent, T2* corrected chemical shift based fat-water separation with multi‐peak fat spectral modeling is an accurate and precise measure of hepatic steatosis. J Magn Reson Imaging. 2011, 33:873-881. 10.1002/jmri.22514
18. Cassidy FH, Yokoo T, Aganovic L, et al.: Fatty liver disease: MR imaging techniques for the detection and quantification of liver steatosis. Radiographics. 2009, 29:231-260.
10.1148/rg.291075123
19. Zhao YZ, Gan YG, Zhou JL, et al.: Accuracy of multi-echo Dixon sequence in quantification of hepatic steatosis in Chinese children and adolescents. World J Gastroenterol. 2019, 25:1513-1523. 10.3748/wjg.v25.i12.1513
20. Idilman IS, Keskin O, Celik A, Savas B, Elhan AH, Idilman R, Karcaaltincaba M: A comparison of liver fat content as determined by magnetic resonance imaging-proton density fat fraction and MRS versus liver histology in non-alcoholic fatty liver disease. Acta Radiol. 2016, 57:271-278. 10.1177/0284185115580488
21. Kang BK, Kim M, Song SY, Jun DW, Jang K: Feasibility of modified Dixon MRI techniques for hepatic fat quantification in hepatic disorders: validation with MRS and histology. Br J Radiol. 2018, 91:20170378. 10.1259/bjr.20170378
22. Tang A, Chen J, Le TA, et al.: Cross-sectional and longitudinal evaluation of liver volume and total liver fat burden in adults with nonalcoholic steatohepatitis. Abdom Imaging. 2015, 40:26-37. 10.1007/s00261-014-0175-0
23. Kukuk GM, Hittatiya K, Sprinkart AM, et al.: Comparison between modified Dixon MRI techniques, MR spectroscopic relaxometry, and different histologic quantification methods in the assessment of hepatic steatosis. Eur Radiol. 2015, 25:2869-79. 10.1007/s00330-015-3703-6
24. Cui J, Philo L, Nguyen P, et al.: Sitagliptin vs. placebo for non‐alcoholic fatty liver disease: a randomized controlled trial. J Hepatol. 2016, 65:369-376. 10.1016/j.jhep.2016.04.021
25. Tyagi A, Yeganeh O, Levin Y, et al.: Intra‐ and inter‐examination repeatability of magnetic resonance spectroscopy, magnitude‐based MRI, and complex‐based MRI for estimation of hepatic proton density fat fraction in overweight and obese children and adults. Abdom Imaging. 2015, 40:3070-3077. 10.1007/s00261-015-0542-5
26. van Werven JR, Marsman HA, Nederveen AJ, Smits NJ, ten Kate FJ, van Gulik TM, Stoker J: Assessment of hepatic steatosis in patients undergoing liver resection: comparison of US, CT, T1-weighted dual-echo MR imaging, and point-resolved 1H MR spectroscopy. Radiology. 2010, 256:159-168. 10.1148/radiol.10091790
27. Lee SS, Park SH, Kim HJ, et al.: Non-invasive assessment of hepatic steatosis: prospective comparison of the accuracy of imaging examinations. J Hepatol. 2010, 52:579-585.
10.1016/j.jhep.2010.01.008
28. Mazhar SM, Shiehmorteza M, Sirlin CB: Noninvasive assessment of hepatic steatosis . Clin Gastroenterol Hepatol. 2009, 7:135-40. 10.1016/j.cgh.2008.11.023
of magnetic resonance spectroscopy, proton density fat fraction and histological analysis in the quantification of liver steatosis in children and adolescents. World J Gastroenterol. 2016, 22:8812-8819. 10.3748/wjg.v22.i39.8812
30. Nasr P, Forsgren MF, Ignatova S, et al.: Using a 3% proton density fat fraction as a cut-off value increases sensitivity of detection of hepatic steatosis, based on results from