İSTANBUL BİLGİ UNIVERSITY
INSTITUTE OF SOCIAL SCIENCES
MA PROGRAM IN INTERNATIONAL POLITICAL ECONOMY
GREEN RECOVERY FROM THE CRISIS: A COMPARATIVE
ANALYSIS
MA Thesis by ZEYNEP BÜNÜL
Supervisor: Prof. Dr. Ertuğrul Ahmet TONAK
GREEN RECOVERY FROM THE CRISIS: A COMPARATIVE ANALYSIS
KRİZE KARŞI YEŞİL TOPARLANMA: KARŞILAŞTIRMALI ANALİZ Zeynep Bünül
108674001
Dissertation Supervisor:
Prof.Dr. E. Ahmet TONAK ... Dissertatiom Committee Members:
Prof. Dr. Ertuğrul Ahmet TONAK ... Istanbul Bilgi University
Asst. Prof. Dr. Ahmet Atıl AŞICI ... Istanbul Technical University
Hakan ARSLAN (IBU) …... Istanbul Bilgi University
Date of Approval: …...
Anahtar Kelimeler Keywords Karşılaştırmalı Analiz Comparative Analysis Yeşil Yeni Düzen Green New Deal Ekososyalizm Ecosocialism Üçlü Kriz Triple Crisis
iii ABSTRACT
The aim of this study is to examine and to compare the Green New Deal (GND) policy proposals, and the Ecosocialist alternative for the solution of the current economic, social, and ecological crises. After analyzing these two concepts, the study argues that although the Ecosocialist perspective is more ambitious in reaching a more egalitarian and ecologically sustainable future, it lacks a clearly defined set of actors and road map that can radically change the global system in accordance with the Ecosocialist principles in the long run. In that respect, it can be argued that GND policies can help to set the stage for the Ecosocialist agenda to achieve its long term objectives. Hence, from this point of view, both approaches can be seen as complementary rather than substitutes.
iv ÖZET
Bu çalışmanın amacı, mevcut ekonomik, sosyal ve ekolojik krizlere çözüm getirmesi açısından, Yeşil Yeni Düzen ve Ekososyalizm tarafından önerilen politikaları incelemek ve karşılaştırmaktır. Bu iki görüşü de analiz ettikten sonra bu çalışma; Ekososyalist görüş daha eşitlikçi ve ekolojik olarak sürdürülebilir bir geleceğe ulaşmakta daha istekli olsa da Ekososyalist prensiplerle uzun vadede varılmak istenen ve küresel sistemin radikal değişiminin gerçekleşmesi için açık bir şekilde tanımlanmış aktörler ve yol haritasından yoksundur, argümanını getirmektedir. Bu bağlamda, Yeşil Yeni Düzen politikaları, Ekososyalist bakış açısını, uzun vadeli hedeflere ulaştırmakta yardımcı olabileceği söylenebilir. Dolayısıyla, bu noktadan bakıldığında, her iki yaklaşım birbirinin ikamesi olmaktansa tamamlayıcı olarak görülebilir.
v
ACKNOWLEDGEMENTS
It is a pleasure to thank the many people who made this thesis possible.
I would like to gratefully acknowledge the supervision of Asst. Prof. Dr. Ahmet Atıl Aşıcı, who has been abundantly helpful and has assisted me in numerous ways. I
specially thank him for his infinite patience. The discussions I had with him were invaluable.
This work would not be possible with the support of Prof. Dr. E.Ahmet Tonak and Asst. Prof. Ahmet Atıl Aşıcı under whose guidance, I chose this topic.
Also I would like to express my sincere gratitude to Hakan Arslan for his patience, motivation, enthusiasm, and immense knowledge during my graduate study.
I am grateful to all my friends, for their continued love and for the moral support support thereafter.
My final words go to my family. I want to thank my precious family, whose love and guidance is with me in whatever I pursue.
On a different note, many people have been a part of my graduate education and I am highly grateful to all of them.
vi
TERMINOLOGY & ABBREVATIONS
ARRA American Recovery and Reinvestment Act of 2009 (USA) CDM Clean Development Mechanism of United Nations Framework Convention on Climate Change
EEA European Environment Agency (Denmark)
FAO United Nations Food and Agriculture Organization (Italy) GDP Gross Domestic Product
GHG Green House Gas GND Green New Deal
IEA International Energy Agency ILO International Labour Organization IMF International Monetary Fund
KfW Kreditanstalt für Wiederaufbau Banking Group (Germany) LULUCF Land Use, Land-Use Change and Forestry
MDGs The eight Millennium Development Goals of United Nations NEF New Economics Foundation (United Kingdom)
OECD Organisation for Economic Co-operation and Development (France) SPO State Planning Office (Turkey)
UNEP United Nations Environment Programme
UN ESCAP United Nations Economic and Social Commission for Asia and Pacific UNESCO United Nations Educational, Scientific and Cultural Organization UNFCCC United Nations Framework Convention on Climate Change WB World Bank Group
WEF World Economic Forum
vii TABLE OF CONTENTS Page # ABSTRACT………..……...iii ÖZET………....iv ACKNOWLEDGEMENT……….…………v
LIST OF TABLES & FIGURES……….……….ix
TERMINOLOGY & ABBREVATIONS……….……….x
1. INTRODUCTION………..…..….1
2. ECONOMIC DIMENSIONS OF CRISIS……….………….……...2
3. SOCIAL DIMENSIONS OF CRISIS……….………...……4
4. ECOLOGICAL DIMENSIONS OF CRISIS ………...6
5. GREEN NEW DEAL………..…………..…9
5.1 Historical Roots of Green New Deal………...……..10
5.1.1. From New Deal to Green New Deal…..…….………..……10
5.2 Components of Green New Deal………...…………...……….12
5.3 Green Investments………...………14
5.4 Green Jobs………...………15
6. GREEN NEW DEAL IN LOCAL AND GLOBAL CONTEXT………..…..17
6.1. Key Economic Sectors………...……...…………26
6.1.1 Low Carbon Energy Sector………..………..……26
6.1.2 Transportation………...……..29
6.1.3 Buildings……….………...……….32
6.1.4 Basic Materials………...………..…………..35
7. GREEN NEW DEAL IN PRACTICE……….……….35
7.1 Green Practices in China………..……….…36
7.2 Green Stimulus in US………..………..…38
7.3 Green Recovery Practices in Germany………...………...42
viii
8. ECOSOCIALISM………..………...45
8.1. Historical Roots of Ecosocialism……….……...……...…..46
8.2 Components of Ecosocialism………..…..………49
9. COMPARATIVE ANALYSIS………...……….51
10. CONCLUSION………...……….……….56
BIBLIOGRAPHY………..………...………..…60
ix
LIST OF TABLES AND FIGURES
Tables Page # 4.1 Total GHG Emissions in 2007 (CO2) (excludes land use change), Top Ten………..7
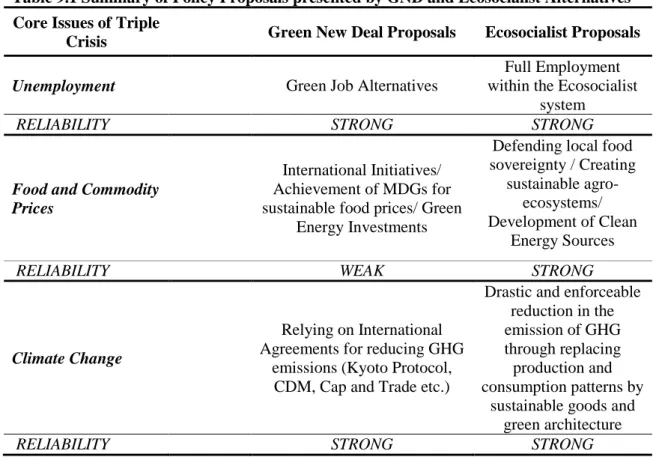
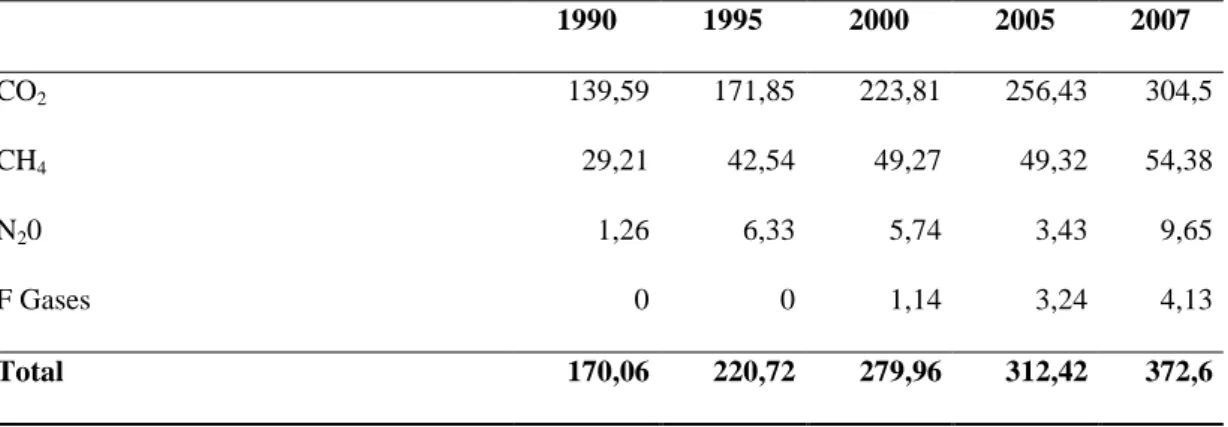
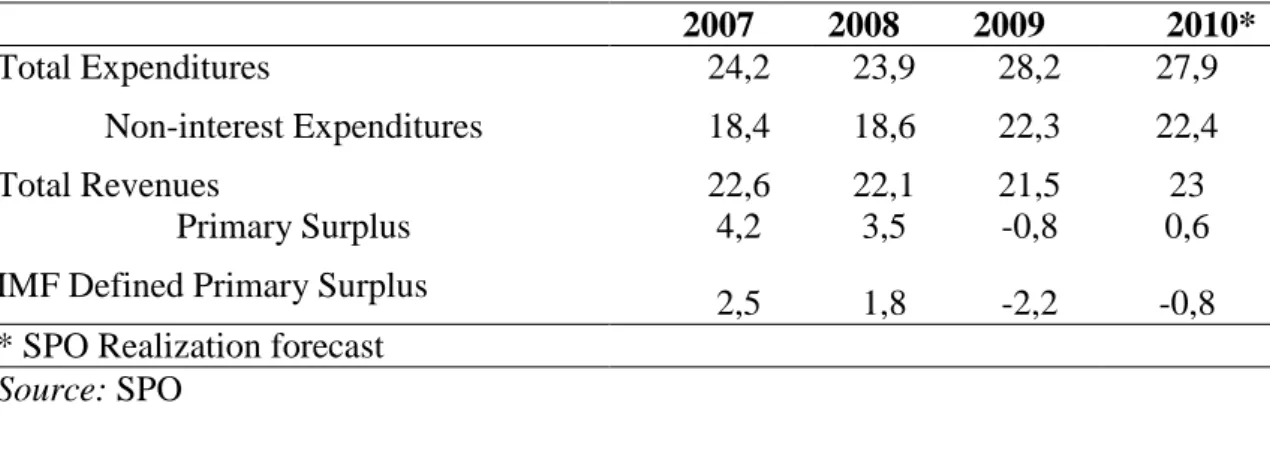
5.2 Estimated Green Collar Employment in Green Investments, Selected Countries and the World, (2006)………...…16 7.1 Environmental Spending Through the ARRA (Billions of US Dollars)…………...18 7.2 Congressional Budget Office Estimated Rate of ARRA Spending on Renewable Energy and Energy Efficiency in US………..39 6.1 Key Economic Sectors and Core Elements of Several GND Policy Proposals……39 9.1 Summary of Policy Proposals Presented by GND and Ecosocialist Alternatives...59 A.1 Total GHG Emissions of Turkey (million ton CO2 equivalent), 1990-1995-2000-20005-2007………..…69 A.1.1 Current Account (CA), Net Capital Inflows, Errors & Omissions and Change in Reserves (Billion $) in Turkey, (2008-2009)………...…72 A.1.2 Budget Performance of the Central Government of Turkey, (2007- 2010), as % of GDP……….…75 Figures
A.2 Environmental Expenditures of Governmental Organizations by Environmental Domains in Turkey (in TRY), (2007- 2009)………...78
1
1. INTRODUCTION
In 2008, the world economy confronted with a global crisis. Coupled with the intensified ecological disasters mainly triggered by the global climate change, and resulting social problems quickly turn the economic crisis into a multi-dimensional one. What made this crisis different than its predecessors were its multi-dimensional characteristics. Even in the early days of 2008, many people started to liken the current crisis to the 1929 Great Depression. And they were partially right in their description. During the Great Depression, world GDP fell dramatically as unemployment soared to unprecedented levels in many countries. Through 1933 to 1934 the overall unemployment rate in US economy was 25 per cent with another 25 per cent taking wage cuts or working part time (Feinstein 2006). GDP fell by almost 50 per cent. In the aftermath of the 2008 crisis, many countries were confronted with similar problems. But the world faced with another problem in 2008 which was absent in 1929; the ecological crisis often represented by food and energy insecurities and climate change.
Several proposals have been put forward by several groups to overcome the triple crisis; economic, social and ecological. GND, inspired by the Roosevelt’s New Deal policies in the 1930s, is one of the most popular of these proposals. But it is not the only one. Ecosocialists have long been ardent critics of the ongoing capitalist economic model and have developed several ideas that can also be considered as another set of alternatives to tackle the triple crisis.
2
those of Ecosocialists on the triple crisis.1 In this respect, the study will start by describing the different dimensions of the current crisis. After discussing why “green” recovery is crucial for overcoming triple crisis, this study will comparatively analyze these two alternative perspectives. The study will be concluded the study with an argument that both GND and Ecosocialist approaches can be seen as complementary rather than substitutes to overcome triple crisis.
2. ECONOMIC DIMENSIONS OF CRISIS
Today the world economy is still trying to recover from the negative effects of the current financial crisis which started in 2008. The starting point of the current global financial crisis is heavily related to the mispricing of credit-default swaps and the blowing up of the US subprime mortgage bubble (Murphy 2008).
United States subprime mortgages provided an opportunity for borrowers with poor credit histories and weak documentation of income to borrow loans with incentives such as easy initial terms and the promise of a long-term trend of rising housing prices. As a result, the share of subprime mortgages in the overall mortgage market increased from less than 10 per cent in 2001 to almost 21 per cent in 2006 (Harvard Report 2008). Therefore, they believed that they could easily refinance their debts. The problems were amplified by the advent of the financial operation called securitization. Traditionally, banks originate a loan to the borrower (homeowner) and retain the credit (default) risk. Securitization, however, led the banks to distribute credit risk to investors through financial tools known as mortgage-based securities (MBS) and collateralized debt obligations (CDO). This practice enables banks to replenish their funds, which are then
1
3
used to issue even more loans, since more loans mean more transaction fees earned. These MBS are valued according to mortgage payments and house prices.So, when the housing prices started to decline most of the financial institutions which had borrowed mostly from subprime MBS started to report significant losses. Just after these losses, several defaults and losses on other loan types also started to rise. In October 2008, the 10-City and 20-City Composites, posting annual declines of 19.1 per cent and 18.0 per cent, respectively (S&P/Case-Shiller U.S. Home Prices Indices 2009). The credit crisis forced households to increase their savings. Significant losses in the financial markets and mortgage bubble burst caused consumers to spend less, thus leading to global financial panic a la Kindleberger (2005).
The financial meltdown in US economy quickly transmitted to the real sector and then to the global economy through trade and financial linkages which have steadily intensified during the so-called second wave of globalization. Advanced economies were confronted with a 7.5 per cent decline in real GDP as emerging economies contracted 4 per cent during the fourth quarter of 2008 (IMF 2009).
Worried about the negative spillover effect of the financial instability over the real sector, the U.S. Government pushed the Federal Reserve (FED) to take action to stabilize financial markets. Also the U.S. Government bailed out key financial institutions like the American International Group (AIG) which was the largest U.S. insurance company at the time. These actions put enormous strain on the federal government budget. In US alone the cost of bailing out these institutions put a bill reaching to some $9.7 trillion on the shoulders of US taxpayers (Bloomberg 2009).
4
2008, global economic growth was 5.2 per cent in 2007 with a significant drop to 0.6 per cent in 2009. The forecast for 2011 global economic growth is only 4.3 per cent that is still less than the figure before the financial crisis (IMF 2010, p.155).
Expectedly, economic crisis has aggravated the social problems and carried it to the point of crisis in many countries represented by increasing poverty, income inequality, and unemployment. Moreover, food shortages due to the negative effects of the climate change represent another face of the social crisis. In the coming section, I will try to focus on the social dimensions of the current crises.
3. SOCIAL DIMENSIONS OF CRISIS
The economic and ecological crises have social consequences. Increase in food/commodities/energy prices; raise in unemployment rates increase the vulnerability of lower strata of societies in many countries. Contraction in the economy owing to recent financial turmoil has caused an increase in unemployment. The global unemployment rates are 6.2 per cent (preliminary estimates) in 2010, in comparison to 6.3 per cent in 2009, but still higher than the rate of 5.6 per cent in 2007 (ILO 2011).
Increasing rates of unemployment and reduction in economic growth due to recent financial crisis has an impact on vulnerable groups. Even though the recent financial crisis started in the US and UK economies, it spread rapidly all over the world, notably to emerging countries. After the financial turmoil, the reduced growth in 2009 due to global financial crisis will affect 390 million in sub-Saharan Africa living in extreme poverty (UNESCO 2009). According to the study, their income fell by $18 billion which corresponds to a 20 per cent drop of the per capita income of an average African.
5
continue to increase towards 2050 as a result of the population growing by an additional 2.7 billion people (UNEP 2009)2. Increasing food prices due to rising demands for food can be expected to lead to higher rates of infant and child mortality because of malnutrition and poverty. FAO annual real food price indices consisting of the average real prices of commodity groups, such as meat, dairy, cereal, oils and sugar depicted that for 2011, the index is at its highest level since being tracked in 1990 (FAO Food Price Index 2011). The highest increase occurred in sugar and oil prices. Furthermore, an additional 44 million people fell below the $1.25 poverty line as a result of higher food prices (WB 2011).
In order to prevent price volatility, and increase productivity, new regulations and the reorganizing market structures and institutions should be taken into consideration. These concepts will be examined in the context of GND and Ecosocialist perspectives in the proceeding sections.
In addition to the social dimension of the food crisis related to the current financial crisis, the problem of energy insecurity also has an effect on vulnerable groups resulting in an increase in poverty. IEA (2008) predicted that the price of oil may reach US$200 per barrel by 2030 due to rapidly increasing demand, in contrast to “increasingly constrained supply”, and at such levels many developing economies may no longer be able to afford oil imports.Due to the high crude oil prices, reliance on crops as biofuels is rising therewithal. This means the arable lands are increasingly devoted to the biofuel
2
Also, Under-Secretary-General and UNEP Executive Director Achim Steiner declared, "We need to deal with not only the way the world produces food but the way it is distributed, sold and consumed, and we need a revolution that can boost yields by working with rather than against nature".
6
crops which pose another threat to food insecurity.3 In this respect, volatility in energy prices also triggered the fluctuations in food prices that lead to social degradation through income inequality and poverty.
Recent financial crisis boosts social vulnerabilities. As briefly indicated above, the impact of the current financial crisis on poverty issues and vulnerable groups can be observed from rising unemployment rates, declining economic growth rates, rising food and energy prices. Another crucial concern which is related with both economic and social dimension of current financial crisis is that the ecological degradation. Both food crisis and energy insecurity issues have ecological dimensions related to global warming. In the next section, we will examine the ecological extent of current crisis.
4. ECOLOGICAL DIMENSION OF CRISIS
The third dimension of the triple crisis is the ecological crisis. One can define the ecological crisis in terms of the increasing pace of biodiversity loss, the extinction of species due to climate change, global warming due to high levels of greenhouse gas emissions, and air, soil and water pollution.
Climate change constitutes the primary challenge facing humanity today. The Stern Review on the Economics of Climate Change (2006) indicates that average global temperature increases of only 1-2°C (above pre-industrial levels) could commit 15-40 per cent of species to extinction. According to the review, global temperature rise will lead to melting glaciers, declining crop yields, rising sea levels and accordingly causes malnutrition and heat stress.
3 U.S. Department of Agriculture (USDA) (2011) reports that the use of corn for biofuels in the United
7
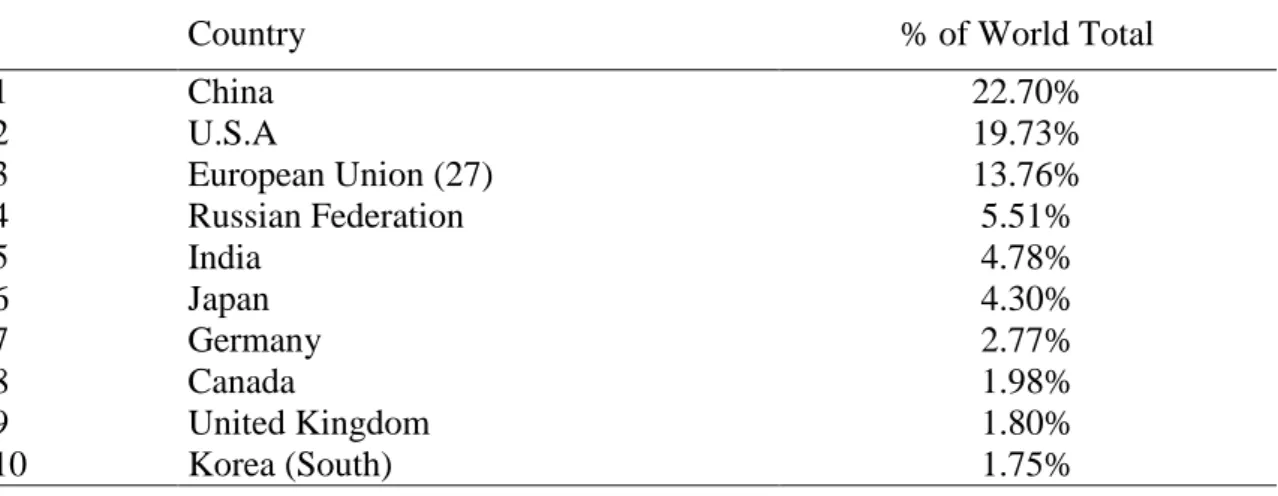
Total greenhouse gas (GHG) emissions (CO2) data, developed countries seem to be the major culprits for high levels of GHG emissions in the atmosphere. As seen in Table 4.1, 56 per cent of world’s CO2 emissions were shared by China, the USA and the European Union (27) in 2007 (WRI 2011).
TABLE 4.1 Total GHG Emissions in 2007 (CO2) (excludes land use change), Top Ten
Country % of World Total
1 China 22.70% 2 U.S.A 19.73% 3 European Union (27) 13.76% 4 Russian Federation 5.51% 5 India 4.78% 6 Japan 4.30% 7 Germany 2.77% 8 Canada 1.98% 9 United Kingdom 1.80% 10 Korea (South) 1.75%
Source: WWI Climate Analysis Indicators Tool (CAIT) Version 8.0, 2011
In order to reduce their GHG emissions to certain levels, parties of the 1992 United Nations Framework Convention on Climate Change (UNFCCC) adopted the Kyoto Protocol in December 1997 and which was entered into force on 16 February 2005. The target agreed upon was an average reduction of 5.2 per cent from 1990 levels by the year 2012. In order to present the current situation, one would analyze the Greenhouse Gas (GHGs) emissions without Land Use, Land-Use Change and Forestry (LULUCF) in Gigagrams (Gg) CO2 equivalent for selected countries (e.g. European Union, Germany, Turkey and US. For Germany, GHG emissions in 2008 increased about 7.2 percent on a year-on-year basis. On the other hand, Germany has decreased its GHG emissions by about 2.7 percent relative to 1990 levels and remains still below the Kyoto
8
target in 2008.4 EU emissions have been declining steadily since 2003. According to the European Environment Agency (2010), this reduction is a result of improvements in energy efficiency and increased use of renewable sources. In Turkey however, emissions have almost doubled since 1990. The increase has been driven by economic and demographic growths, which resulted both in increasing energy demand and energy production. Finally, US have the largest proportion of GHG emissions in the figure. From 2007 to 2008, there was a decline in US total GHG emissions. The US Energy Information Administration linked this drop to a decrease in CO2 emissions in 2008 rather than other GHGs such as water vapor (H2O), methane (CH4), and ozone (O3).
In short, an important cause of ecological degradation is formed by the effects of climate change. The Stern Review (2006) estimated that the total cost of ‘business as usual’ (BAU) climate change over the next two centuries equates to an average welfare loss equivalent to at least 5 per cent of the value of global per-capita consumption, now and forever. Also, it is predicted that stabilizing at or below 550ppm CO2 equivalent would cost, on average, around 2 per cent annual global GDP by 2050.
The above mentioned GHG emissions data depicted that although the values for 2008 seem to be relatively lower than previous years, this could not be the direct effect of the “green” policies for overcoming climate change but the result of a slowing down in industrial activities due to financial breakdown in mid-2007, and moderate climatic conditions.5
The preceeding sections briefly explained the economic, social and ecological
4 See
http://www.umweltbundesamt.de/uba-info-presse-e/2011/pe11020_greenhouse_gases_well_below_the_limit.htm
5 UBA (2011) declares that the rise in 2010 CO
2 emissions is the result of improvements in renewable
9
dimensions of current global financial crisis, namely the triple crunch. To overcome this triple crisis, this study will attempt to present and analyze comparatively the policy recommendations of the two alternative perspectives as mentioned in the previous sections. The first alternative I am going to evaluate is the GND.
5. GREEN NEW DEAL
In response to the growing concerns over ecological and social devastation along with the ongoing economic crisis, several institutions propose a set of policies to address economic, social and ecological problems at once.6
Reports published by several institutions on GND notion mainly argue that the world economy is confronted with a ‘multiple crisis’, called often as triple crisis or triple crunch (NEF 2009). In this context, GND targets UNEP established global GND policy brief in 2009 with the purpose of providing guideline for nations to confront current environmental and economic crisis, saving and creating jobs and protecting vulnerable groups, and ending extreme poverty by 2015. As can be understood from the latter objective, the global GND does not only focus on policy proposals at an international level, but also addresses the needs of local economies under the guidance of Millennium Development Goals (MDGs).7 Several proposals including maximizing energy efficiency systems, creating “green collar jobs”, establishing an Oil Legacy Fund, constructing a new financial system that is able to bring financial stability, social justice and environmental sustainability, and so on (UNEP 2009).
6 See, for example, Pollin, Robert, Heidi Garrett-Peltier, James Heintz, and Helen Scharber, 2008. Green
Recovery: A Programme to Create Good Jobs and Start Building a Low-Carbon Economy. Center for
American Progress, Washington D.C., Green New Deal Group,. 2008. A Green New Deal: Joined-up
policies to solve the triple crunch of the credit crisis, climate change and high oil prices. New Economics
Foundation, London.
7 In 2000, world leaders came together at the Millennium Summit and adopted the United Nations
Millennium Declaration consisting of eight Millennium Development Goals (MDGs). The seventh target set is about ensuring environmental sustainability.
10
Overall, the general proposition of GND reports (UNEP 2009; NEF 2008; Renner et al. 2009) would be described as re-regulating the financial system and taxation system so as to scale down the use of fossil fuels, reducing unemployment and declining demands caused by the credit crunch. Before assessing the policy proposals in depth, it would be useful to have a quick look at the historical background that helped to shape the GND concept.
5.1. Historical Roots of Green New Deal
5.1.1 From New Deal to Green New Deal
The historical roots of GND go back to the 1930s when US President Franklin Delano Roosevelt introduced a set of policies, known as New Deal (ND), in response to the Great Depression. The beliefs regarding the self-regulating markets and viewing crisis as a process of creative destruction have been tarnished following the unprecedented social and economic consequences of the 1929 crisis. This led to the development of theories giving state a bigger role in the economy. John Maynard Keynes’ earlier works had inspired many in the world in crisis, notably Roosevelt in shaping the New Deal program.8 Especially during 1937 recession, Roosevelt inspired make use of John Maynard Keynes’ (1936) arguments on governments had to use both monetary policy and fiscal policy instruments in order to protect the economy from crisis (Wallace 1977). Keynes rejects the self-regulating nature of the markets. Rather, he argues that during the crisis when the economy suffers from lack of demand, governments should stimulate the economy by increasing public investments. The boost to the aggregate
8 The New Deal was a series of Relief, Recovery and Reform programs for US economy and was
implemented in the US between 1933 and 1936. For additional information and critics of New Deal see Hannsgen et al. (2009).
11
demand in the economy would help to solve the unemployment problem.
Although both ND and GND propose public investments and regulation to tackle crisis, they are different both in the interpretation of the crisis and in the sectors to be intervened. In order to clearly determine the differences between ND and GND, first I should briefly mention the building blocks of the respective policy proposals. In general, ND programs focused on relief for unemployment, recovery of the economy, and a reforming of the financial system. In particular, the ND programs include several sets of stimulus measures and regulations in several industries and markets including the banking, transportation, construction, farming, and labor markets. The promotion of labor unions was the aim of the National Labor Relations Act of 1935 (also known as the Wagner Act); the Social Security Act of 1935 and the Fair Labor Standards Act of 1938 were enacted; and the Works Progress Administration of 1935 (WPA) relief program was introduced. New institutions were developed, such as the United States Housing Authority and Farm Security Administration in 1937. In agriculture, the Agricultural Adjustment Act of 1938 aimed to address the problems in the agriculture sector.
The priority of these measures and regulations of ND was to get the US economy on its feet again. But the New Deal is not exempt from criticism. One of the assertion is that it was not civilian government spending in ND which overcomes the Great Depression but it is the expansion of military spending in preparation to the impending Second World War that started in 1939 (Foster et al. 2009, p. 22). In addition, although New Deal mainly focused on the United States’ economic and social problems in the era of the Great Depression, perhaps expectedly, it had no concern over the environmental impact of stimulus plans and regulations. And many authors, including Kovel (2002)
12
see it as the major reason behind the start of the environmental movement in the US in the 1950s and ‘60s. Rapid industrialization during the 1960s, with the help of the import-substitution policies in developing as well as developed countries, led to increasing pressure on nature. And these developments add a new dimension to the crisis faced by humanity in 2008, known as the ecological crisis.
It is clear that New Deal type policies, which helped to revive the economies in the 1930s, cannot solve but can only aggravate the problems in today’s world. Hence it is the reason why policy proposals were packaged under the brand of Green New Deal rather than just New Deal.
5.2 Components of Green New Deal
UNEP (2009) argues that today’s triple crisis demands government leadership on a global scale and one that constitutes a comprehensive environmental vision. In this sense, global GND concept can be accepted as a manifestation of this kind of leadership and it addresses the three major objectives. The first objective is to represent a common desire to restore to health a disrupted financial system, an economy in recession, and severe job losses. The second objective is to ensure that the “post-crisis” economy follows a sustainable model and does not continue to add to the two most significant risks faced by society: ecological scarcity and climate instability. Finally, the third objective suggests inclusive growth, achievement of the MDGs, and an end to extreme poverty by 2015.
In order to achieve these objectives, GGND determined four key components. The first one is to reduce carbon dependency of the world economy to control the global average temperature increase. The second one is to reduce ecological scarcity and poverty by
13
improving the sustainability of primary production for creating sustainable resource-dependent economies. The third component is to eliminate the challenges, such as “capital gap” and “skills and technological gap”, faced by developing countries. For example, global GND proposes a new trade and financial mechanism in order to balance the capital gap in private and public financial investments. The last component is the national actions necessary for the implementation of GND, such as the assertion by UNEP (2009) that each country should spend at least 1 percent of their GDP within a two-year period on reducing carbon dependency, and increasing access to clean water and sanitation.
The main idea of green proposals is to improve the quality of life of all the beings on our planet. In order to solve the multiple crises simultaneously, adapting the economic system in accordance with environmental sensitivity is the crucial point. If countries wish to orient their economies toward an environmentally sustainable path in the long run, GND advices green job and green investment alternatives to transform the mainstream economic structure into a “green” one.
In line with the objectives and key components stated above, GND reports (UNEP 2009; Renner et al. 2009; NEF 2009; Pollin et al. 2008)indicate the key industries of a green new deal as energy, transportation, construction and basic materials including steel, aluminum, cement and paper. Regarding the implementations of these key industries, Renner et al. (2009) represents the core areas of GND. One of the core elements of GND is to build a green public infrastructure via smart grid technologies, green transportation through investing in rail, public transportation and electric cars, and also by establishing recycling markets. The second one is leapfrogging opportunities. These opportunities can be provided from implementing green technology, improving
14
efficiency, and restructuring management practices. The third element states that for green transition, high quality digital infrastructures reduce environmental impact. A fourth, additional element is the restructuring of prices and markets to promote a green economy.
The financing of green projects, supporting newly emerging industries and helping to achieve green employment is indispensable. Next section summarizes the green investments and green job alternatives to overcome triple crisis.
5.3 Green Investments
The current global financial crisis and ongoing threats of energy insecurity and climate change force governments to stimulate green investments particularly in clean energy sector. In 2009, World Economic Forum (WEF) published a report about green investment opportunities in smart grid architecture, energy storage systems, carbon capture and storage systems. The report indicates “eight emerging large scale clean energy sectors” as Onshore/Offshore Wind, Solar Photovoltaic (PV), Solar Thermal
Electricity Generation (STEG), Municipal Solid Waste-to-Energy Cellulosic and Next Generation Biofuels, Sugar based Ethanol, and Geothermal Power. For investing in these clean energy systems, WEF (2009) estimated that $500 billion per year of financing is required by 2020 to limit global warming to 2°C.However, only a half of the financing target has been achieved so far (the clean energy investment has been increasing by about US$ 250 billion per annum.) (WEF and Bloomberg 2011).
Along with renewable energy investments, transportation has been viewed as another key sector. In order to reduce the reliance on motor vehicles which use fossil fuels, green transport investments are advised by GND. For example, in Europe, remarkable
15
investments have been made for urban public transport and sustainable mobility programmes -which will represent in Section 6.1.2.
In addition, steel, aluminum and paper recycling markets are also a green investment component included in GND. Almost all the amounts of steel can be recycled in the automotive and construction industries (Renner et al. 2009).
The most important investment type that GND proposes is to invest in “Nature’s infrastructure” with an aim to protect the ecosystem. Along with government investments, GND proposes carbon markets, wetland banks, water banks, and conservation banks to protect biodiversity and the ecosystem (Renner et al. 2009, p.14).
In order to understand the contributions and components of different GND policy proposals, i.e. the local and global context, the following section will present the key economic sectors and core elements indicated in each of these GND reports.
5.3 Green Jobs
The Green Job Report by the Green Job Initiative9 describes green jobs as “work in agricultural, manufacturing, research and development (R&D), administrative, and service activities that contribute substantially to preserving or restoring environmental quality. Specifically, but not exclusively, this includes jobs that help to protect ecosystems and biodiversity; reduce energy, materials, and water consumption through high efficiency strategies; de-carbonize the economy; and minimize or altogether avoid the generation of all forms of waste and pollution” (2008, p.3).
9 The Green Job Initiative is a joint initiative by the United Nations Environment Programme (UNEP), the
International Labour Organization (ILO), the International Employers Organization (IOE) and the International Trade Union Confederation (ITUC)
16
The report attempts to emphasize in particular the green jobs that not only refer to the workers who are employed in the key sectors explained above. Also, there need to be decent working conditions besides being employed in “green” sectors. A combination of decent work and jobs in key sectors are what makes the definition of a green job. A worker in a renewable sector without occupational safety is not a good example of a green job. Rather, the ideal green workplace should provide occupational health and safety, adequate wages, job security, gender equality and worker’s rights.
Employment can be positively affected by shifting energy generation from fossil fuels to renewable and doing so, the number of people presently employed in the renewable energy sector runs to about 2.3 million as seen in (Table 5.2). Brazil, US, Germany, and China are targeting to achieve high levels of job creation via renewable energy sector. The number of people presently employed in the renewable energy sector is about 2.3 million along with expanding investment flows and growing production capacities (Table 5.2).
Table 5.2 Estimated Green Collar Employment in Green Investments, Selected Countries and World, (2006)
Investment World* Selected Countries
Wind 300.000 Germany, United States, Spain, China, Denmark, India
Solar PV 170.000** Germany, United States, Spain, China
Solar Thermal 624.000-plus Germany, United States, Spain, China
Biomass 1.174.000 Brazil, Germany, United States, Spain, China
Hydropower 39.000-plus Europe, United States
Geothermal 25.000 Germany, United States
Total Renewable Energy 2.332.000-plus World
*Countries for which information is available. **Under the assumption that Japan’s PV industry employs roughly as many.
17
Within selected countries as seen in the table, it is estimated that about 300,000 workers are employed in wind power, 170,000 in solar photovoltaic (PV), more than 600,000 workers are employed in the solar thermal sector, and more than 1.2 million people are employed in biomass, hydropower and geothermal energy production in total. In addition to the green job opportunities in the renewable energy sector, there are also green job alternatives such as building sector, recycling sector, organic agriculture and vehicle manufacturing sector.
In order to achieve sustainable green employment, Green Job Report (2008) proposes that the traditional industry and sector definitions may be forced to change so as to achieve low-carbon emissions and decent work place conditions. The creation of green and decent jobs through green investment is an important part of the green recovery. In this respect, types of green investments will be examined in the next section.
6. GREEN NEW DEAL IN THE GLOBAL AND LOCAL CONTEXT
GND was first proposed on the global scale just after the start of the economic crisis. UNEP (2009) and Renner et al. (2009) are the ones that evaluate the GND in a global context. On the other hand, NEF (2008) report specifically focuses on UK’s green recovery while Pollin et al. (2008) takes into consideration of American recovery and progress in particular. These reports differ in the scale of actions to be taken, in targeted sectors and in core elements they involve, but at the same time each shares some common grounds, which will be explained below.
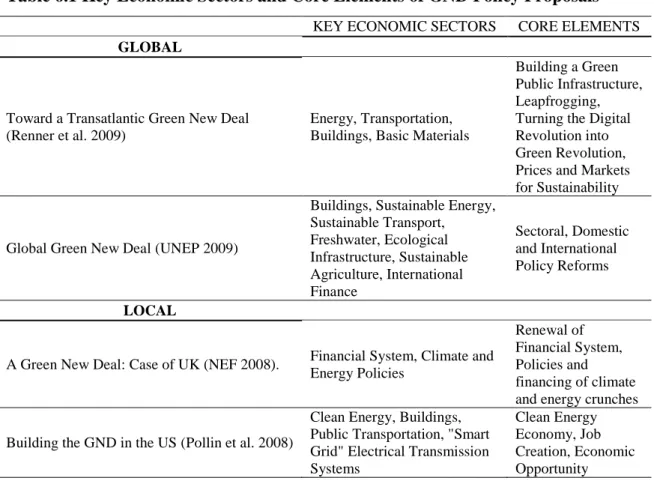
Table 6.1 presents the institutions that published GND reports in the segmentation of global and local policy recommendations. In respect to their policy proposals, UNEP (2009) and Renner et al. (2009) GND reports consist of global concepts and case
18
studies. Although reports have global and local specifications about key economic sectors and core elements, there are several common grounds in the meaning of supporting each other with their analysis.
Table 6.1 Key Economic Sectors and Core Elements of GND Policy Proposals
KEY ECONOMIC SECTORS CORE ELEMENTS
GLOBAL
Toward a Transatlantic Green New Deal (Renner et al. 2009)
Energy, Transportation, Buildings, Basic Materials
Building a Green Public Infrastructure, Leapfrogging, Turning the Digital Revolution into Green Revolution, Prices and Markets for Sustainability
Global Green New Deal (UNEP 2009)
Buildings, Sustainable Energy, Sustainable Transport, Freshwater, Ecological Infrastructure, Sustainable Agriculture, International Finance Sectoral, Domestic and International Policy Reforms LOCAL
A Green New Deal: Case of UK (NEF 2008). Financial System, Climate and Energy Policies
Renewal of Financial System, Policies and financing of climate and energy crunches
Building the GND in the US (Pollin et al. 2008)
Clean Energy, Buildings, Public Transportation, "Smart Grid" Electrical Transmission Systems
Clean Energy Economy, Job Creation, Economic Opportunity
Policy proposals including global level actions mainly focus on improving global governance and facilitating national governments for implementing GND strategies. With the help of global governance, these policy proposals seek to overcome the economic, and policy making challenges in order to implement GND.
UNEP (2009) presents the United Nations system and global policy forum like the G20 group of the world’s 20 largest rich and emerging economies are the suitable agents to take a role in promoting, developing and enhancing a GND. In this respect this agents
19
could guide several policy actions including immediate actions for responding the effects of economic, social and ecological crisis, reduction of carbon dependency, coordinating adoption of market-based instruments, and facilitating transboundary governance of water and other shared resources.
Achieving a sustainable financial structure, UNEP (2009) advices that international actor and agents should adopt reforms to increase transparency and improve the alignment of incentive structures, increase development assistance of bilateral and multilateral aid donors and these actions should comprise the key components of the global GND including the development and expansion of innovative financing mechanisms, such as the International Finance Facility, Climate Investment Funds and Global Clean Energy Cooperation.
In this respect GND at a global level recommends new financing facilities providing an expansion of trade finance focused on trade liberalization that provides opportunities for promoting several sectors, such as limiting fisheries subsidies, reducing tariff and non-tariff barriers on clean technology and services, and reducing agricultural protectionism.
At national level, UNEP emphasizes that countries like United States, the European Union and other high income OECD economies, remaining middle and high income economies of the Group of 20 (G20) should spend at least 1 per cent of their GDP over the next two years for reducing their carbon dependency, and adopting complementary carbon pricing policies. Besides for developing economies, the GND report of UNEP (2009) could not determine the exact amount of spending for implementing GND since current economic conditions are tough but whether the amount is not clear, the report indicated that they should develop national actions for improving clean water and
20
sanitation for the poor. They should also develop urgently comprehensive, well-targeted safety net programs and at least maintain educational and health services for the poor.
The report emphasizes that the international agents should agree on extending and reforming the CDM beyond 2012, as part of a global climate change agreement, and also including the coverage of developing economies, the sectors and technologies and the overall financing of global GHG emission reductions. In this direction, development and adoption of financial systems such as the International Finance Facility, Climate Investment Funds and Global Clean Energy Cooperation that formed with transparency and simplicity, and improve the alignment of incentive structures is expected by these agents. Also the report requests that bilateral and multilateral aid donors should increase their development assistance over the next few years in a way that targeting them to the sectors and actions that comprise the key components of the GND. Together with the financial system improvements; the report suggests reviewing currently used trade agreements in favor of GND proposals such as reaching successful conclusion of the Doha Round trade negotiations, especially on fishery subsidies, clean technology and services and reducing agricultural protectionism.
To sum up, GND policy proposal of UNEP recommends several international actions under the leadership of international community. These actions include development and implementation of global climate change agreements, financial systems, and trade agreements. Besides international actions, the report recommends national actions of implementing by governments through their fiscal and other policy instruments thus GND expects to accelerate economic recovery, create jobs, and reduce carbon dependency and extreme poverty. The report gave an approximate indication of what governments should spend in broad priority areas of the GND rather than estimating
21
precise amounts of costs of policy actions that the national governments expected implications.
One of the priority areas is described as a “green recovery” programs that involves immediate economic recovery and job creation that also promote the transition to a low-carbon economy through removal of fuel subsidies, clean energy investments and market-based incentives. Based on economic recovery priority area, the report suggests middle and high income economies that they should spend at least 1 per cent of their GDP on the national green recovery actions including reducing carbon dependency, including removing subsidies and other perverse incentives and adopting complementary carbon pricing policies. On the other hand it should be recommended that developing economies should also implement the national actions proposed for reducing carbon dependency according to their capability to spend under their current economic conditions.
The distinctive policy actions of UNEP report, along with other institutions’ policy proposals, are the emphasis on safety-net programs targeting to the poor and vulnerable groups, and the expected sustainability of the primary production activities of developing economies. The report addresses the importance of maintaining and expanding educational and health services, providing safe drinking water and sanitation for millions of the poor in developing regions, low and middle income economies and recommends to spend at least 1 per cent of their GDP for improved water and sanitation. The report also laid emphasis on the possible actions for improving the primary production activities such as generating sufficient investible funds for diversifying the economy, building up human capital, and investing in social safety nets and other investments targeted at the poor.
22
The GND reports prepared by several institutions depicted in Table 6.1 addresses key economic sectors as energy, transportation, buildings, and basic materials. International IEA (2011) indicated that shares of electricity consumption of these sectors in 2009 are as follows: 1.6 per cent for transportation, 40.2 per cent for industry and remaining 58.2 per cent for other activities such as agriculture, commercial and public services, residential, and non-specified other. In line with these key sectors demonstrated in Table 6.1, this study tries to determine core elements for each GND policy proposal.
On the basis of building a public infrastructure, with regarding growing energy use -including enhanced data transmission and storage needs of the IT-based systems- Renner et al. (2009) asserts that a smart grid can better balance supply and demand via smoothing out demand peaks and shifting loads to low-demand periods – and reduce line losses through the use of more local, distributed electricity generation. Energy management systems associated with smart grids can reduce electricity use by 10-15 per cent, and up to 43 per cent of peak loads Smart grid projects (Energy Future Coalition 2009).
In Europe, investments of up to €200 billion in transmission and distribution networks are being planned by 2020 – some €90 billion of which directly relates to smart grid technology (Renner et al. 2009). Private projects by companies like Iberdrola, EDP, ZigBee, Pepco, Gazprom, Siemens and eMeter; Ireland’s announcement that it will invest almost two thirds of its €12 billion budget for renewable energy and cleantech projects in smart meters and smart networks; and the Netherlands’ goal of a “base level” of smart metering and replacement of all 7 million household meters by the fall of 2012.(Setters, 2008) For the sake of spreading benefits of smart grid technology, in 2005, the European Technology Platform SmartGrids was set up, bringing together key
23
stakeholders to develop a shared vision, align various projects, and draw up a strategic agenda on the national and European levels. (European Technology Platform SmartGrids, 2007)Smart grids will also be part of an emerging new transportation system as electric vehicles become more conventional.
Another important green infrastructure is presented as electric vehicle charging stations. A California based company Project Better Place is an example for this sector, and in collaboration with Israel, European Union, Australia, California, Japan, and North America to build stations for recharging electric vehicles and exchanging batteries.10 Prospective urging demand for electric cars on a large scale thus also makes it essential that electricity production be switched from fossil fuel plants toward renewables. Broader green transport policy that reduces the dependence on motor vehicles provides substantial and long-term investments in public transport and rail also with walking and biking.
In the case of US, the quality and extent of urban public transportation is highly uneven across the country because the ARRA stimulus program offers some money, but represents no more than a first down payment. The report proposes that US may think about ways to convert and reorient applicable portions of its productive capacities toward both light and heavy rail.
Another crucial aspect for green public infrastructure that the report asserted is that compared with producing materials like steel, aluminum, and paper from scratch, using scrap materials saves substantial amounts of energy. International Iron and Steel Institute (2007) indicated that in the steel industry, for instance, savings run between 40
10
24
and 75 per cent. Worldwide, slightly more than 40 per cent of total steel production is based on recycled steel. The share has been stagnant for some years, but the absolute amounts are increasing. Further expansion of the recycled share is problematic due to because overall demand is rising rapidly, and the time span within which old steel becomes available for recycling can stretch to decades.
The report demonstrated that the global recycling rate for aluminum averages 63 percent. These rates vary for each country. For example, Scandinavia and Germany have strong government regulations and high recycling rates, whereas Greece, Portugal, the United Kingdom, and Eastern Europe fare far less well.
Another green public infrastructure that the report presents is “natural infrastructures”. The Ecological Society of America explained that 'ecosystem services', "refers to a wide range of conditions and processes through which natural ecosystems, and the species that are part of them, help sustain and fulfill human life." (Daily et al. 1997). Moreover ecosystem services that consist of flows of materials, energy, and information from natural capital stocks which combine with manufactured and human capital services to produce human welfare (Costanza et al. 1997).
Another core element that Renner et al. (2009) classifies the leapfrogging opportunities in three areas: the development and introduction of green technologies, advances in efficiency, and changes in management practices. The green technologies include transportation, renewable energy, heating and cooling. Although the report cannot find Europe’s efforts on sustainable transportation sufficient, there are global initiatives such as Global Fuel Economy Initiative, aiming for a reduction in fuel consumption per
25 kilometer of 50 percent by 2050.11
Improvements in propulsions systems are suggested in this GND policy proposal. These are supposed to be used for gasoline-electric hybrids, diesel hybrids, electric hybrids, plug-in hybrid electric vehicles.
Transformation of conventional energy system to renewable energy is also taken into consideration in the proposal. Investing to wind power, solar photo-voltaic cells, and biodiesel production is suggested for leapfrogging. Further leapfrogging opportunity is the advances in efficiency of buildings, water, and steel industry. The new technologies for energy efficient buildings are presented as passive solar orientation for heating and day lighting; efficient lighting and appliances; super insulation and ultra-tight air barriers on doors and windows; and heat recovery ventilators. Besides energy efficiency, the importance water efficiency is pointed out. The option of water harvesting via capture of rain water is suggested. Also the steel industry has to become energy efficient to properly tackle with high CO2 emissions. GND proposed that there needs to be a growing recognition of governments for supporting the initiatives for advancing and developing cutting-edge strategies for reducing CO2 emissions of steel industry.
Along with technological advances and efficiency issues, GND defended that governments can support the shift to a service economy. In this respect, the report suggests car sharing, the subscription-based transportation service that allows people to substitute short trips in their own car with trips made in a vehicle rented by the hour. Bike sharing is also supported by the report.
Even more, digitizing economic activity and “dematerializing” several services via
11 See
26
advancing IT infrastructure can help to minimize environmental impacts of those activities is expressed as a core element for Renner et al. (2009). In this respect, this report suggests some prototypes such as matching people, via web site, who need rides with people who have open seats in their vehicles, reducing trips overall and the pollution this represents. Also teleconferencing reduces need for travelling thus reducing CO2 emissions. Another example is smart energy meters that help to match energy demand and supply and letting consumers know the price and availability of energy. For reducing printed materials like books and CDs/DVDs, GND offers an online e-book and downloading facilities for reducing paper and materials consumption.
Within the context of core elements described above paragraphs, proceeded section is trying to describe and analyze the key economic sectors of GND policy proposals addresses and policy recommendations for tackling triple crisis.
6.1 Key Economic Sectors
6.1.1 Low-Carbon Energy Sector
New renewable energy technologies, with the combination of energy-efficiency advances, will allow global energy needs to be met without fossil fuels and by adding only minimally to the cost of energy services. The more robust carbon-free energy option is accepted as a renewable energy that includes solar, wind, biomass, and geothermal energy. In the longer run, ocean energy—from tides, waves, currents, and thermal convection—is another strong possibility (Worldwatch Institute 2008).
UNEP (2008) indicated that globally around US$300 billion annually -or 0.7 per cent of world GNP- is spent on fossil fuel subsidies, which are employed mainly to lower the prices of coal, electricity, natural gas and oil products. In order to eliminate the
27
dependency on usage of fossil fuel, GND proposes to remove such subsidies eliminates perverse incentives in energy markets and provides an immediate source of financing for low-carbon strategies.
Markets and prices are viewed as a powerful driver of individual and institutional behavior to help the effort to green economic activities (Renner 2009). In this direction the report suggested governments to use taxes and subsidies to influence prices directly such that using eco-tax revenues to fund national health or social security programs rather than payroll taxes so that can support lowering indirect labor costs and boost job creation without hurting workers’ interests. According to subsidy reform, GND offers cheap energy policies that promote over-consumption of fossil energy, or transfer risks or costs from private entities to taxpayers.
In the case of US for instance, for creating an additional source of funding for the green recovery to be performed over the next two years, US$6 billion fossil fuel subsidies could be removed by the United States (UNEP 2009). Moreover global figures indicated that energy subsidies in high income OECD economies amount to about US$80 billion annually; 20 non-OECD countries account for US$220 billion; Russia has US$40 billion in energy subsidies annually; Iran’s energy subsidies are around US$37 billion; China, Saudi Arabia, India, Indonesia, Ukraine and Egypt have subsidies in excess of US$10 billion per year. To inhibit the negative effects of fossil fuel subsidies on tackling triple crisis UNEP (2009) offers complementary pricing policies for providing the correct incentives for reducing carbon dependency and ecological scarcity. These policies are introduced as including both additional taxes, tradable permits and other market-based instruments. In this respect, it is suggested that the resulting financial savings of US$80 billion in OECD economies and US$220 annually in developing
28
countries could be spent for investments in clean energy R&D, renewable energy development and energy conservation through the complementary pricing incentives that could be including energy and carbon taxes, carbon and other tradable permit schemes and temporary subsidies to initiate clean energy R&D. It is expected that these actions would contribute to less economic waste, reduce pollution and congestion, foster greater transport choice and facilitate sustainable transport strategies that would boost economic recovery and employment. In the case of low and middle income countries, UN ESCAP (2008) depicted that every US$1 invested to improve the energy efficiency of electricity generation can save more than US$3 in investment costs in these economies. As indicated in the GND thinking of 25 million households depend on biogas for cooking and lighting, and 2.5 million household use solar lighting systems, spending on energy efficient sectors will not only increase the availability of affordable and sustainable energy services for the world’s poor but also provide much needed employment opportunities in developing economies.
The Climate Network (2011) pointed out that regional success stories in the area of low-carbon growth of Europe and United States. Although certain regions of these countries remain bound to carbon-intensive electricity production and manufacturing, the report indicated that, with the right set of policies, ease of both the economic and the climate crisis, and lay solid foundations for futuresustainable growth could be real as shown in the case of Germany where the so-called clean contracts—known there as “feed-in tariffs”12—have spurred investment in renewable energies and the country can now
12
US National Renewable Energy Laboratory Policymaker’s Guide (2010) defines feed-in tarif as an energy supply policy focused on supporting the development of new renewable energy projects by offering long-term purchase agreements for the sale of RE electricity. Klein (2008) and Lipp (2007) indicates that these purchase agreements are typically offered within contracts ranging from 10-25 years and are extended for every kilowatt-hour of electricity produced.
29
reached to emissions reductions of 28 per cent since 1990, more than 370,000 new jobs, and slow but stable growth despite the economic crisis.
The report continues with the cases energy transformations of two German states, Schleswig-Holstein, and North Rhine-Westphalia in the west. Schleswig-Holstein is indicated that a rural state in the north where more than 40 per cent of power consumed is produced from renewable -primarily wind. In this state, three nuclear power plants are to go offline, and will require the installation of 9 Gigawatts (GW) of wind-turbine capacity to replace them, as well as major new power lines to carry the renewable electricity to high-use states. North Rhine-Westphalia in the west is shown as a major industrial hub and a leading supplier for the renewables industry, particularly the wind industry. In the Germany, feed-in tariffs has an opportunity for local residents and farmers to having found cooperative businesses that own and run entire “citizens’ wind parks”, so-called Bürgerwindparks so this type of community investments generate local wealth, jobs and hence public support for renewable energy.
6.1.2 Transportation
The transportation sector accounts for over a quarter of total world energy use and 14 per cent of total GHG emissions so that world transportation energy use is expected to grow at 2 per cent per year, with energy use and GHG emissions about 80 per cent above 2002 levels by 2030 (Barket et al. 2007).
Common transportation preferences have several undesirable outcomes for urban development, land use planning and employment opportunities. Baum (2007) exemplified that in the US, the rapid expansion of the highway system between 1950 and 1990 contributed significantly to the population decline of major cities. But, this
30
model caused automobile use increases as per capita income rises so that this highway system urban structure, rather than improving the accessibility of jobs, may have worsened it. This adopted transport system leads to greater motorized vehicle use, road transport and increased energy use is further exacerbated by sizable transportation market distortions, including the “under pricing” of motorized travel, current urban and
land use planning practices that encourage automobile use, and distortions in public investment in favor of road transport over other modes of travel (UNEP 2009). In addition in Mumbai, India, over 44 per cent of all commuters walk to work, and 63 per cent of the poor walk to work and the poor who rely on transport generally use public transit; 21 per cent of the poor in the urban center take the bus to work and 25 per cent of the poor in the suburbs take rail to work. This figures shows the importance of access to public transit has a significant factor on rates of labor participation and employment of inner-city residents (Baker 2005).
In order to transform current transportation preferences, UNEP (2009) suggests multiple goals such as developing next generation of fuel-efficient cars, low carbon biofuels and the delivery system infrastructure for the new fuels and cars; encouraging rail and public transit; improving the accessibility to affordable transport by the poor; and implementing market-based instruments and regulations to improve the sustainability of transport systems.
Travelling and commuting preferences of individuals have impacts on global warming, peak oil and energy security on a global level. In this direction, Grünig et al. (2009) depicted the linkages between public transportation, car and bike with sharing programs with eliminating side effects of pollution and global warming. In order to assure commuters to end their dependency on private automobiles, the paper argues that
31
municipalities should revise current public transportation systems involving bus, subways, and commuter rail. Instead of this, innovative solutions like new light rail systems and bus rapid transit is offered. Also new innovations in car and bicycle sharing are offered to bridge the gap between communal and individual transport modes.
Integrated transportation planning is depicted as involving of public transportation, bicycles, walking, and cars. Integrating car sharing and bicycle sharing systems into transportation plans and combining them with public transportation is explored in the paper.
This composition is viewed as a key element to provide mobility while eliminating the problems of energy usage, greenhouse gas emissions, and noise and air pollution. The paper continues with the case studies of the US and European countries’ transportation systems practices which depend largely on private passenger cars for personal transportation. In the US, the modal share of passenger cars is 87 per cent of passenger kilometers traveled, while in the EU-15 it was 76 per cent in 2005 (OECD 2006). At the same time, the trend towards urbanization continues unstopped both in the US and in the EU. Some 80 per cent of the US population now lives in metropolitan areas, although density levels continue to decline at the urban fringe. In the EU, approximately 75 per cent of the population lives in urban areas (EEA 2006).
Due to the urban population expansion and acceleration of road networks over the decade extends road congestion, air pollution, noise, and road accidents as well. In order to overcome negative impacts of current transportation habits the report proposes several approaches to urban transport that work with the infrastructure that exists today. These approaches are not an ultimate mode of transport systems but especially for an
32
optimal mix of modes. These combine approaches are set as: “1. Improve system efficiency by fostering the use of more energy efficient modes of transport; 2. Change the profile of fuels used; and 3. Reduce transportation demand. These strategies are not mutually exclusive.” (French et al. 2009, p.11)
Integration of existing transportation network to bicycle and car sharing programs is the main argument of the paper. Two types of car sharing programs are taken into account. One of them is integration of station-based car sharing systems. This type suggested that rental stations can be located at major transport hubs: railway stations, metro stops, bus terminals etc. The Liselec stations in La Rochelle is an example for all linked to other transportation modes that includes bus, ferry boat, train, Liselec car sharing, taxi, and park and ride. On the other hand, station-based bicycle sharing is suggested for linking closely with existing transportation networks. The SmartBike system is an example located in Washington, DC and all its 10 stations are within walking distance of a subway stop and these stops chosen for the stations are in the central business district. Next section will try to explain another key economic sector that both GND proposals focus which are the energy efficient buildings
6.1.3 Buildings
Another key economic sector proposition of both GND reports are considering is energy efficient buildings. Taking into account that the buildings are responsible for 30- 40 per cent of all energy usage, greenhouse gases and waste generation, UNEP (2009) asserted that the retrofitting of the existing building stock could create large investment opportunities and jobs in the immediate term. In this sense the paper suggested that governments could begin with direct spending on retrofitting all public buildings,