See discussions, stats, and author profiles for this publication at: https://www.researchgate.net/publication/257055077
The Effect of an Example-Based Dynamic Program Visualization Environment
on Students’ Programming Skills
Article · September 2013 CITATIONS 0 READS 165 1 author:
Some of the authors of this publication are also working on these related projects:
Scientific Research Projects Unit of Çukurova University, Adana, Turkey (Project code: SBA-2018-9355)View project
Scientific Research Projects Unit of Çukurova University, Adana, Turkey (Project code: EF2013BAP9)View project Mehmet Tekdal
Cukurova University
30PUBLICATIONS 206CITATIONS
SEE PROFILE
Tekdal, M. (2013). The Effect of an Example-Based Dynamic Program Visualization Environment on Students’ Programming Skills. Educational Technology & Society, 16 (3), 400–410.
The Effect of an Example-Based Dynamic Program Visualization
Environment on Students’ Programming Skills
Mehmet Tekdal
Department of Computer Education & Instructional Technologies, Faculty of Education, Çukurova University, 01330 Sarıçam, Adana, Turkey // [email protected]
(Submitted April 19, 2012; Revised November 02, 2012; Accepted January 14, 2013)
ABSTRACT
The purpose of this study was to investigate and compare the effect of the two computer-assisted learning systems named the Based Dynamic Program Visualization Environment (EDPVE) and the Example-Based Static Program Visualization Environment (ESPVE) on undergraduate students’ programming skills in an introductory programming course. The study was conducted using a quasi-experimental, non-equivalent control group design with 81 pre-service teachers in a Turkish university. Two classes were randomly assigned to use EDPVE(experimental group) and ESPVE(control group) system. The results of the experiments showed that: (1) there were a significant difference between EDPVE and ESPVE groups in favour of the EDPVE group; and (2) there were no significant difference between male and female students in EDPVE and ESPVE groups respectively. The findings of this study suggest that teaching and learning programming can be improved through the use of dynamic program visualization techniques.
Keywords
Interactive learning environments, Programming and programming languages, Gender studies, Program visualization, Computer-assisted learning
Introduction
Learning of programming can be a difficult and complicated process. One of the main reasons is (Miyadera, Kurasawa, Nakamura, Yonezawa, & Yokoyama, 2007) that students have difficulty in understanding what a computer is actually doing when executing a program lines and what is simultaneously happening in memory. Program visualization and animation tools have been developed in order to present the execution of program lines using graphical effects. These tools are used to help students to better understand program codes and how the execution of a program works.
Program visualization (PV) is “a research area that studies ways of visually assisting learners in understanding behaviour of programs” (Rajala, Laakso, Kaila, & Salakoski, 2008). Diehl (2007) divided PV into dynamic program visualization (DPV) and static program visualization (SPV), in reference to the behavior and the structure of the program respectively. DPV tools show the dynamic execution of programs for debugging, profiling, and also for understanding program run-time behavior. On the other hand, SPV tools are useful for producing textual representations such as pretty-printing in order to increase users’ understanding of program code (Storey, Wong, & Müller, 2000).
A considerable amount of literature has been published on program visualization and animation tools developed for use in programming education environments (LaFollette, Korsh, & Sangwan, 2000; Ben-Bassat Levy, Ben-Ari, & Uronen, 2003; Moreno & Joy, 2007).
Byrne, Catrambone and Stasko (1999) conducted two experiments in order to examine whether animations of algorithms would help students to learn them more effectively. The results showed that one-way animations may aid learning as they encourage learners to predict the behavior of algorithms. These researchers concluded that instead of animation, prediction was the key factor for learning in their study.
Another study (Hundhausen & Brown, 2007) implemented an algorithm development and visualization model named “What You See Is What You Code” for novice learners, which taught programming using an imperative paradigm. An analysis of its usability and field study shows that their model helps novices to quickly identify and correct programming errors and to develop semantically corrected code.
400
ISSN 1436-4522 (online) and 1176-3647 (print). © International Forum of Educational Technology & Society (IFETS). The authors and the forum jointly retain the copyright of the articles. Permission to make digital or hard copies of part or all of this work for personal or classroom use is granted without fee provided that copies are not made or distributed for profit or commercial advantage and that copies bear the full citation on the first page. Copyrights for components of this work owned by others than IFETS must be honoured. Abstracting with credit is permitted. To copy otherwise, to republish, to post on servers, or to redistribute to lists, requires prior
Naps et al. (2003) surveyed the role of visualization and engagement in computer science education and found their respondents agreed that using visualization can help students.
Although Empirica Control (EC) is a visual programming platform designed primarily for technology education, it can be used to teach programming. Students can use it to produce graphical representations of programs on flowcharts. The results of a teaching experiment with 34 eighth-grade students indicated that EC is a useful tool for learning the principal elements of programming with minimal teaching effort (Lavonen, Meisalo, Lattu, & Sutinen, 2003).
Many studies were conducted using the Jeliot series (Eliot, Jeliot I, Jeliot 2000 and Jeliot 3) of program visualization applications (http://cs.joensuu.fi/jeliot/description.php). Ben-Bassat Levy, Ben-Ari and Uronen (2003) carried out an experiment with Jeliot 2000 in a year-long course. The results of the experiment show that the animation program helps students who have difficulty in learning the abstract concepts of computer science. Another experiment was conducted by Moreno and Joy (2007) using the Jeliot 3 animation tool that Jeliot 3 animations are hard for novice students but helped them to debug their programs and that using the program was easy. The findings of another qualitative case study with Jeliot 3 showed that animation programs can help students to learn programming basics and may increase their motivation (Sivula, 2005). Still, in another research by Hongwarittorrn and Krairit (2010), Jeliot 3 was used as a learning tool. The experimental results showed that the use of Jeliot 3 could help students improve their learning performance in Java programming and obtain higher scores than those who did not use Jeliot3, but also it was found that the use of tool did not affect students’ long-term attitudes toward programming. A study by Lee and Wu (1999) was conducted in order to investigate the effects of debugging practices on programming skills. They developed a system called DebugIt:Loop for debugging errors in loop programs. The results of two experiments conducted with 26 college and 46 senior high school students enrolled in an introductory Pascal course showed that their model was effective in improving novice programmers’ programming skills.
An online tutorial called VINCE, was developed by Rowe and Thorburn (2000) to teach C programming by showing program graphically. VINCE provides students with a step-by-step visualization of the execution of the program, shows the memory map and provides comments at every step. An evaluation study showed that VINCE improves students’ learning of programming and that students also find it to be well-designed.
Many PV tools have been developed and used to teach programming recently, but vary widely in features and capabilities. Gomez-Albarran (2005) conducted an in-depth analysis of nearly 20 tools, selected those which were outstanding and classified them into four categories as follows: (1) tools that include a simple and reduced development environment (THETIS, AnimPascal, BlueJ and DrJava); (2) example-based environments (ELM-PE, ELM-ART, WebEx and Javy); (3) tools based on visualization and animation (ANIMAL, LEONARDO, XTANGO, POLKA, JHAVE, The Teaching Machine of C++ and the Jeliot family); and (4) simulation environments (the Karel family, JkarelRobot and Alice).
Using carefully prepared visual examples can help students to understand even more complicated and abstract concepts (Lee & Owens, 2000; Clark & Mayer, 2003). A number of example-based tools have been developed in order to teach programming using examples. These tools include ELM-PE, ELM-ART, WebEx and Javy. ELM-PE is an example-based intelligent programming environment for learning the LISP programming language (Brusilovsky & Weber, 1996). ELM-ART, which was based on ELM-PE, is an adaptive web-based tool for learning LISP (Weber & Brusilovsky 2001). WebEx is a web-based tool to enable teachers to teach programming using an example-based approach in heterogeneous classes (Brusilovsky, 2001). Javy is a teaching tool designed to simulate the structure of a Java Virtual Machine (JVM) and allows users to learn JVM and the Java language compilation process (Gomez-Martin, Gomez-(Gomez-Martin, & Gonzalez-Calero, 2003).
Some of the other most widely used PV tools are summarized below:
• Bradman is a low-level Program Visualization tool. Smith and Webb (2000) conducted an experiment using Bradman to tests the efficacy of tool in assisting novice programmers learn programming concepts using C in an introductory programming course. The results of the experiment showed that students who studied with this tool achieved more understanding of some programming concepts than those without access it.
• DrJava (http://drjava.sourceforge.net/) is a lightweight programming development environment for writing Java programs. It is designed primarily for students, providing an intuitive interface and the ability to interactively evaluate Java code and also includes powerful features for more advanced users. Moreover it is a pedagogic programming environment that enables students to focus on designing programs, rather than learning how to use the environment (Allen, Cartwright, & Stoler, 2002).
• JIVE (http://www.cse.buffalo.edu/jive/) is an interactive execution environment and provides a rich visualization of the execution of Java programs. JIVE can be used both as a debugger for incorrect programs as well as for gaining a deeper insight into the behavior of correct programs. It also serves as a pedagogic tool for teaching object-oriented programming, and has been successfully used in undergraduate and graduate programming courses (Lessa, Jayaraman, & Czyz, 2010).
• VILLE is a language-independent program visualization tool for teaching novice programming. Some key features of the tool are defining and adding new languages, visualization row by row, flexible control of the visualization both forwards and backwards, breakpoints, code line explanation, the parallel view shows the program code execution simultaneously in two different programming languages, call stack, and publish examples. Rajala, Laakso, Kaila, and Salakoski (2008) conducted an experiment to evaluate ViLLE’s effectiveness in learning basic programming concepts. In this experiment, while the control group used only a textual programming tutorial, the treatment group used the same material and in addition could execute the examples with ViLLE. They argue that program visualization, more specifically the ViLLE tool, enhances students’ learning regardless of previous programming experience. In other words the tool benefits novice learners more than learners with some previous experience.
• EduVisor is a program visualization tool developed based on the four high-level design principles from theories of learning and the theory of perception (Moons & Backer, 2009). Findings of the experiment by Moons, and Backer (2012) showed that the students and teachers see the environment and the way it is used as an invaluable part of their education and the environment can help with understanding programming concepts that most students consider very difficult.
• OGRE (Object-oriented GRaphical Environment) – a program visualization tool that has been developed to specifically address these memory related issues by providing three-dimensional, interactive visualizations that aid higher-level understanding of a program’s execution in memory. The most important difference between OGRE and the above tools are its 3D environment, in which all the main features of a running program can be visualized. The experiments by developer of the tool showed significant improvements in students’ understanding of C++’s memory-related topics (Milne & Rowe, 2004).
Although there are many studies which have evaluated SPV and DPV tools separately in the literature, this is the first study to compare the effect of DPV and SPV on learning programming. In this study, two computer-assisted learning systems (EDPVE and ESPVE) developed to teach introductory programming. The purpose of this study was to investigate the effectiveness of instruction with EDPVE system in terms of students’ achievement, retention and gender differences in comparison to ESPVE system. So, the research questions that guide this study were formulated as follows:
• Is there a significant difference between the mean scores of the students in the EDPVE and those in ESPVE group?
• Is there a significant difference between the mean scores of the male and female students in the EDPVE and those in ESPVE group respectively?
Method
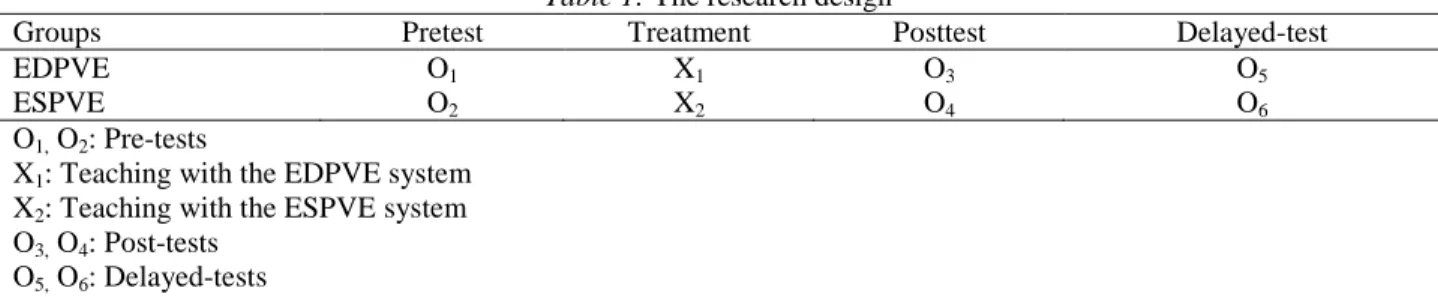
Research designThis study was conducted using a quasi-experimental, non-equivalent group design with pretest and posttest control groups. The research design is shown in Table 1.
Table 1: The research design
Groups Pretest Treatment Posttest Delayed-test
EDPVE O1 X1 O3 O5
ESPVE O2 X2 O4 O6
O1, O2: Pre-tests
X1: Teaching with the EDPVE system
X2: Teaching with the ESPVE system
O3, O4: Post-tests
O5, O6: Delayed-tests
Participants
The participants were 81 undergraduate second-year students of the Faculty of Education, Computer and Instructional Technologies at the Department of Education of Cukurova University in Adana, Turkey. The study was conducted during “Programming Languages I” course.
Sampling
The convenience sampling technique was adapted and used to select participants for the study. Two classes were selected and randomly assigned to the EDPVE and ESPVE groups. The EDPVE group included 41 (22 males, 19 females) students and the ESPVE group included 40 (23 males, 17 females) students.
Instruments
In order to assess the students’ achievement in the EDPVE and ESPVE groups, a Programming Achievement Test (PAT) was constructed using three experts in the subject area. The scope of the PAT includes: variables, control statements, loops and arrays. The PAT consists of 25 multiple-choice items. Each item had five alternative answers. Before using the PAT in this study, the test was administrated to a group of students (N = 77) in order to test the reliability of the test instrument. An analysis of the items showed that two of the items were too easy. These items were slightly revised and 25 items were used. The inter-item consistency was calculated using the Kuder-Richardson formula 20 reliability coefficient (KR-20) and a reliability coefficient of 0.83 was obtained.
Materials
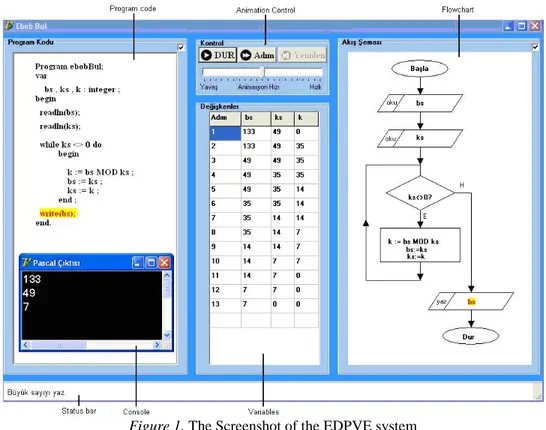
Two computer-assisted learning systems (EDPVE and ESPVE) have been developed and are used to teach programming. The ESPVE group used the ESPVE teaching system with static visualization examples, whereas the EDPVE group used the EDPVE teaching system with dynamic visualization examples. Both systems used the same number of examples. A screenshot of the EDPVE system is shown in Figure 1.
The EDPVE system interface has six windows. These windows include Animation Control, Program Code, Flowchart, Variables, Console and Status Bar. With the Animation Control window, the user can start/stop/restart the program execution, run the program lines step-by-step or continuously and adjust the program execution speed. When the program execution starts, visualizations of the program line in the Program Code and the Flowchart windows are highlighted at the same time. Although both the Program Code and the Flowchart windows are active concurrently, the students have the option to close one window and observe the program execution in another. During program execution, comments about the current line are shown in the Status Bar and the values of variables are listed in the Variables window. The Console window appears on the screen during the execution of the input and output commands to interact with the user. In addition, the Console window simulates the console of programming language and provides a way to experiment with the execution of the program, as in a real programming language environment.
Figure 1. The Screenshot of the EDPVE system
The interface of the ESPVE system is similar to that of the EDPVE system, but it only has the Program Code, Variables and Flowchart windows. In this system, students can only inspect the program code and the related flowchart of static textual examples. A screenshot of the ESPVE system is shown in Figure 2.
Procedure
The study was conducted during the students’ normal lessons over 14 weeks. First, a pretest assessment was conducted with both groups before beginning the experiment. Second, the ESPVE group studied using traditional methods supported by the ESPVE system, while the EDPVE group was taught using traditional methods supported by the EDPVE system. Third, both groups completed their posttest assessment at the end of the experiment. Finally, three weeks after the posttest, both groups completed delayed-test assessments.
Results
Descriptive results
The sample sizes, means and standard deviations for the students’ mean PAT scores were calculated. These values are listed in Table 2. A significance level of 0.05 was used throughout this study. Levene’s test of homogeneity of variance was used in order to test the t-test assumption and showed that the variance between the groups was homogeneous. Non-parametric tests were conducted in order to test non-normally distributed data (Field, 2005).
Table 2. Sample sizes (N), means (Mean) and standard deviations (SD) of the students’ PAT mean scores
Learning results
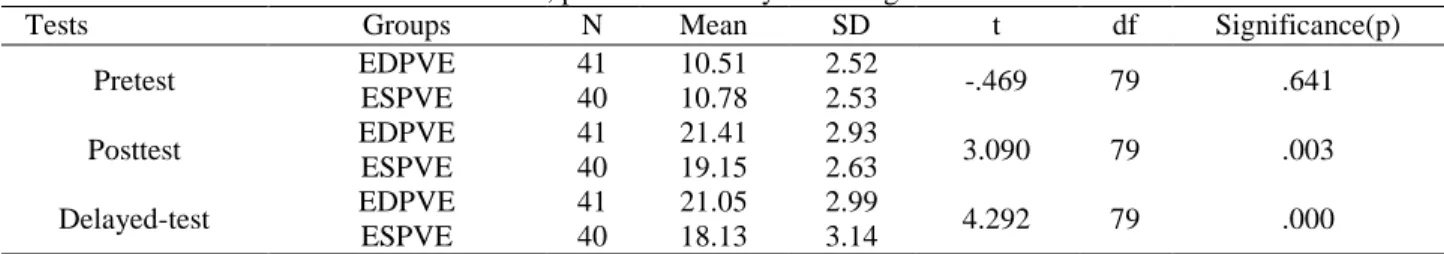
Pretest, posttest and delayed-test significance levels are shown in Table 3. The results of the independent samples t-test analysis indicated that: (1) there was a non-significant difference between the pret-test mean scores of the students in the EDPVE group (M = 10.51, SD = 2.52) and the ESPVE group (M = 10.78, SD = 2.53), t(79) = -.47, p = .641; (2) there was a significant difference between the posttest mean scores of the students in the EDPVE group (M = 21.41, SD = 2.93) and the ESPVE group (M = 19.15, SD = 3.63), t(79) = 3.09, p = .003; and (3) there was a significant difference between the delayed-test mean scores of the students in the EDPVE group (M = 21.05, SD = 2.99) and the ESPVE group (M = 18.13, SD = 3.14), t(79) = 4.29, p = .000. In brief, pretest results indicate the EDPVE and ESPVE groups were equivalent and posttest and delayed-test results show significant differences favoring the EDPVE group.
Table 3. Pretest, posttest and delayed-test significance levels
Tests Groups N Mean SD t df Significance(p)
Pretest EDPVE 41 10.51 2.52 -.469 79 .641 ESPVE 40 10.78 2.53 Posttest EDPVE 41 21.41 2.93 3.090 79 .003 ESPVE 40 19.15 2.63 Delayed-test EDPVE 41 21.05 2.99 4.292 79 .000 ESPVE 40 18.13 3.14 Retention results
Paired samples t-test results of pretest, posttest and delayed-test are shown in Table 4. The results of the paired samples t-test analysis indicated that: (1) there was a significant difference between the EDPVE group’s pretest (M = 10.51, SD = 2.52) and posttest scores (M = 21.41, SD = 2.93), t(40) = -37.10, p = .000; (2) there was a significant difference between the ESPVE group’s pretest (M = 10.78, SD = 2.53) and posttest scores (M = 19.15, SD = 3.63), t(39) = -30.53, p = .000; (3) there was a non-significant difference between the EDPVE group’s posttest (M = 21.41, SD = 2.93) and delayed-test scores (M = 21.05, SD = 2.99), t(40) = .87, p = .392; and (4) there was a non-significant
Pretest Posttest Delayed-test
Groups N Mean SD Mean SD Mean SD
EDPVE 41 10.51 2.52 21.41 2.93 21.05 2.99
difference between the ESPVE group’s posttest (M = 19.15, SD = 3.63) and delayed-test scores (M = 18.13, SD = 3.14), t(39) = 1.29, p = .204. In brief, the results indicated that there was not a significant difference between the posttest and delayed-test mean scores of both the EDPVE and ESPVE groups.
Table 4. Paired samples t-test results of pretest, posttest and delayed-test significance levels
Group Test N Mean SD t df Significance(p)
EDPVE Pretest 41 10.51 2.52 -37.10 40 0.000 Posttest 41 21.41 2.93 ESPVE Pretest 40 10.78 2.53 -30.53 39 0.003 Posttest 40 19.15 3.63 EDPVE Posttest 41 21.41 2.93 0.865 40 0.392 Delayed-test 41 21.05 2.99 ESPVE Posttest 40 19.15 3.63 1.291 39 0.204 Delayed-test 40 18.13 3.14 Gender results
The result of the independent samples t-test analysis indicated that: (1) there was a non-significant difference between the pretest mean scores of the male (M = 10.91, SD = 2.31) and female (M = 10.05, SD = 2.74) students in the EDPVE group, t(39) = 1.087, p = .284; (2) there was a non-significant difference between the posttest mean scores of the male (M = 22.05, SD = 2.97) and female (M = 20.68, SD = 2.79) students in the EDPVE group, t(39) = 1.506, p = .140; and (3) there was a non-significant difference between the delayed-test mean scores of the male (M = 21.27, SD=2.93) and female (M = 20.79, SD = 3.12) students in the EDPVE group, t(39) = .511, p = .612. The results are listed in Table 5.
The results of the independent samples t-test analysis indicated that: (1) there was a non-significant difference between the pretest mean scores of the male (M = 10.65, SD = 2.65) and female (M = 10.94, SD = 2.41) students in the ESPVE group, t(38) = -.354, p = .726; (2) there was a non-significant difference between the posttest mean scores of the male (M = 18.70, SD = 3.61) and female (M = 19.76, SD = 3.68) students in the ESPVE group, t(38)= -.918, p = .364; and (3) there was a non-significant difference between the delayed-test mean scores of the male (M = 18.22, SD = 3.18) and female (M = 18.00, SD = 3.18) students in the ESPVE group, t(38) = .214, p = .832. The results are listed in Table 5.
In brief, the results indicated that there were no significant differences between males and females in both the EDPVE and ESPVE groups.
Table 5. Results of pretest, posttest and delayed-test mean scores of males and females
Groups Tests Gender N Mean SD t df Significance(p)
EDPVE Pretest Male 22 10.91 2.31 1.087 39 .284 Female 19 10.05 2.74 Posttest Male 22 22.05 2.97 1.506 39 .140 Female 19 20.68 2.79 Delayed-test Male 22 21.27 2.93 .511 39 .612 Female 19 20.79 3.12 ESPVE Pretest Male 23 10.65 2.65 -.354 38 .726 Female 17 10.94 2.41 Posttest Male 23 18.70 3.61 -.918 38 .364 Female 17 19.76 3.68 Delayed-test Male 23 18.22 3.17 .214 38 .832 Female 17 18.00 3.18 Subtest results
For further analysis, in addition to a comparison of the two groups’ PAT mean scores for the overall test items, the study also divided the PAT items into three subcategories: the Control Statements Test (CST)(7 items); the Loop
Statements Test (LST) (11 items); and the Array Statements Test (AST) (7 items), according to programming context subtopics. In this case, because the data could not meet the assumption of normality, the Mann-Whitney U-test was used instead of an independent samples t-test.
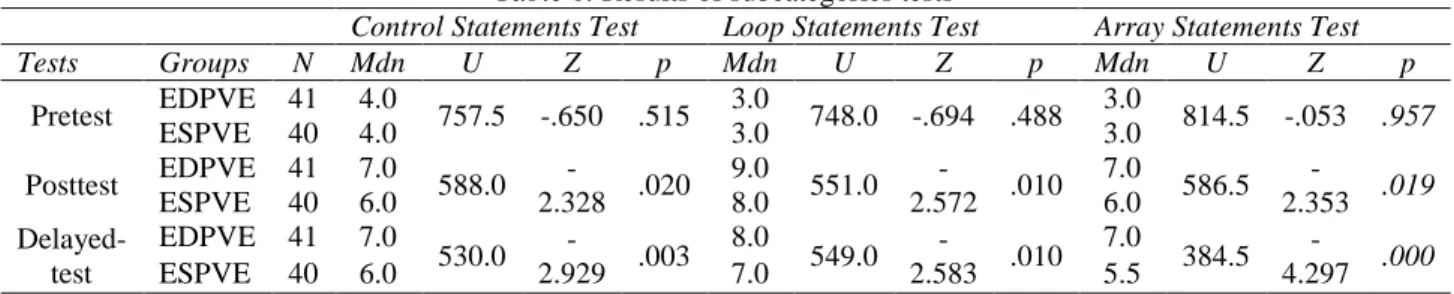
The results of the Mann-Whitney U-test analysis showed that: (1) there was a non-significant difference between the CST pretest mean scores of the students in the EDPVE group (Mdn = 4.00) and the ESPVE group (Mdn = 4.00), U = 757.50, p = .515; (2) there was a non-significant difference between the LST pretest mean scores of the students in the EDPVE group (Mdn=3.00) and the ESPVE group (Mdn = 3.00), U= 748.50, p = .488; and (3) there was a non-significant difference between the AST pretest mean scores of the students in the EDPVE group (Mdn = 3.00) and the ESPVE group (Mdn = 3.00), U= 814.50, p = .957. The results are listed in Table 6.
The result of Mann-Whitney U test analysis showed that (1) there was a significant difference between the CST posttest mean scores of the students in EDPVE group (Mdn = 7.00) and ESPVE group (Mdn = 6.00), U = 588.00, p = .020; (2) there was a significant difference between the LST posttest mean scores of the students in EDPVE group (Mdn = 9.00) and ESPVE group (Mdn = 8.00), U = 551.00, p = .010; and (3) there was a significant difference between the AST posttest mean scores of the students in EDPVE group (Mdn = 7.00) and ESPVE group (Mdn = 6.00), U = 586.50, p = .019. Results are listed in Table 6.
The results of the Mann-Whitney U-test analysis showed that: (1) there was a significant difference between the CST delayed-test mean scores of the students in the EDPVE group (Mdn = 7.00) and the ESPVE group (Mdn = 6.00), U = 530.00, p = .003; (2) there was a significant difference between the LST delayed-test mean scores of the students in the EDPVE group (Mdn = 8.00) and the ESPVE group (Mdn = 7.00), U= 549.00, p = .010; and (3) there was a significant difference between the AST delayed-test mean scores of the students in the EDPVE group (Mdn = 7.00) and the ESPVE group (Mdn = 5.50), U = 384.50, p = .000. The results are listed in Table 6.
In brief, the results show pretest performance to be the same on each subcategory and significant differences in all subcategories on the posttest and delayed-test favoring the EDPVE group.
Table 6. Results of subcategories tests
Control Statements Test Loop Statements Test Array Statements Test
Tests Groups N Mdn U Z p Mdn U Z p Mdn U Z p Pretest EDPVE 41 4.0 757.5 -.650 .515 3.0 748.0 -.694 .488 3.0 814.5 -.053 .957 ESPVE 40 4.0 3.0 3.0 Posttest EDPVE 41 7.0 588.0 -2.328 .020 9.0 551.0 -2.572 .010 7.0 586.5 -2.353 .019 ESPVE 40 6.0 8.0 6.0 Delayed-test EDPVE 41 7.0 530.0 -2.929 .003 8.0 549.0 -2.583 .010 7.0 384.5 -4.297 .000 ESPVE 40 6.0 7.0 5.5
Discussion and implications
The aim of this study was to investigate the effect of teaching/learning using the EDPVE system on students’ programming skills. First, there was a significant difference between the posttest mean scores of the EDPVE and ESPVE groups in favour of the EDPVE group. This result in the achievement test suggests that the students in the EDPVE group had higher mean scores than the students in the ESPVE group, meaning that the learning effect of studying using the EDPVE system is superior to the effect of studying using the ESPVE system. The finding of the current study is consistent with a number of similar previous empirical researches (Hongwarittorrn & Krairit, 2010; Lee & Wu, 1999; Smith & Webb, 2000; Rajala, Laakso, Kaila, & Salakoski, 2008; Milne & Rowe, 2004; Moons & Backer, 2009) on the use of PV techniques that improves the students learning performances. Although this study has provided a significant result, the findings of similar studies reported in the literature present both significant and non-significant results. The meta-study conducted by Hundhausen, Douglas, and Stasko (2002), which comprised an analysis of experimental studies of the effectiveness of algorithm visualization, showed that only 11 out of 24 experiments gave significant results regarding the effect of visualization on learning programming. Another meta-analysis conducted by Baker and Dwyer (2000) showed that visualization has a positive effect on students’ achievement. One of the advantages of program visualization is that it provides a way to interact with programs and
to animate the execution of program code. Mayer and Moreno (2002) argue that animation has great potential to improve human learning by promoting a deeper understanding.
Second, there was a significant difference between the delayed-test mean scores of the EDPVE and ESPVE groups in favour of the EDPVE group. On the other hand, an analysis of the paired-sample t-test showed that there was not a significant difference between the posttest and delayed-test mean scores of both the EDPVE and ESPVE groups. This result indicates that studying under either the EDPVE system or the ESPVE system will have a retaining effect. Third, the test results of CST, LST and AST showed that there was a significant difference between both the posttest and delayed-test mean scores of the EDPVE and ESPVE groups in favour of the EDPVE group. The result of the subtests are consistent with those of the overall test, and, once again, we can reasonably argue that learning effect of teaching/learning control, loop and array subtopics with the EDPVE system is better than the effect of using the ESPVE system. These findings of the current study are consistent with those of Ben-Bassat Levy, Ben-Ari, and Uronen (2003). In the case of ‘if and when’ statements, they found a significant improvement in the performance of the animation group, but no significant improvement with assignment or input/output statements. The present findings also seem to be similar to other research which has found that basic program structures, such as if, trigger and loop, were mastered (Lavonen, Meisalo, Lattu, & Sutinen, 2003).
Finally, no significant gender differences were found in this study. Although the posttest mean score of the male students (22.05) in the EDPVE group was better than that of the female students (20.68), and the posttest mean score of the female students (19.76) in the ESPVE group was better than that of the male students (18.70), neither the EDPVE nor the ESPVE group revealed significant differences. The findings of most of the previous studies have shown gender differences in programming achievement (Hess & Miura, 1983; Lieberman, 1985; Becker, 1986; Collis et al., 1988). However, the findings of the current study and a number of newer studies (Byrne & Lyons, 2001; Rountree, Rountree, & Robins, 2002; Bergin & Reilly, 2005; Lau & Yuen, 2009) have not found the expected gender differences. It is difficult to explain this result, but it may be related to the different learning environment which is provided for new generations. The students of today are different from those in earlier studies. Today’s students have grown up in a rich technology-based teaching and learning environment, which incorporates information and communication technologies, meaning that they think, learn and visualize differently.
Although the findings of the present study indicate that EDPVE is effective for under-graduate students, further research is required in order to test whether it is effective for high school students. In addition, this study used a sample of students with no technical background. Therefore, further studies are being carried out in order to test whether similar results can be obtained with students who have scientific and engineering backgrounds.
The findings of this study have shown that the effect of dynamic program visualization has important implications for the future design and development of tools for teaching programming, and that it may be valuable to use dynamic program visualization techniques. This is an important issue for educators wishing to integrate dynamic program visualization techniques into their courseware.
Limitations and future works
Due to limitations of the current system, students were used only a restricted number of pre-written examples of programming. For future studies, new versions of the learning system can be developed to help students not only use ready-to-use examples but also write and use her/his own examples. Based on the results of this study, other recommendations for future researches are (1) only quantitative research methods were used to compare the effect of learning systems on students’ learning. In order to further explain why dynamic program visualization is more effective, it would be valuable to use both quantitative and qualitative research methods together depending on the opinions of students and teachers; (2) this study compared the two computer-assisted learning systems. It would be convenience to compare these systems with traditional teaching methods; and (3) this study also show that program visualization techniques can improve learning of programming. This potential can be adapted in new development teaching/learning environments.
Acknowledgements
The author would like to thank to the editors and anonymous reviewers for their valuable comments on this manuscript.
References
Allen, E., Cartwright, R., & Stoler, B. (2002). DrJava: a lightweight pedagogic environment for Java. Proceedings of the 33rd SIGCSE technical symposium on computer science education (pp. 137–141). New York, NY: ACM. doi: 10.1145/563340.563395 Baker, R. & Dwyer, F. (2000). A meta-analytic assessment of the effect of visualized instruction. International Journal of Instructional Media, 27(4), 417-426.
Becker, H. (1986). Our national report card: Preliminary results from the new John Hopkins survey. Classroom Computer Learning, 6(4), 30-33.
Bergin, S., & Reilly, R. (2005). Programming: Factors that influence success. SIGCSE Bulletin. 37(1), 411–415.
Brusilovsky, P. (2001). WebEx: Learning from examples in a programming course. In W. Fowler, & J. Hasebrook (Eds), Proceedings of WebNet'2001, World Conference of the WWW and Internet (pp. 124-129). Retrieved from http://www2.sis.pitt.edu/~peterb/papers/WebNet01.html
Brusilovsky, P., & Weber, G. (1996). Collaborative example selection in an intelligent example-based programming environment. In D. C. Edelson & E. A. Domeshek (Eds), Proceedings of International Conference on Learning Sciences (pp. 357-362). Retrieved May, 7, 2010 from http://www2.sis.pitt.edu/~peterb/papers/icls96.html
Byrne, M. D., Catrambone, R., & Stasko, J. T. (1999). Evaluating animations as student aids in learning computer algorithms. Computers & Education. 33(4), 253-278.
Byrne, P., & Lyons, G. (2001). The effect of student attributes on success in programming. Proceedings of the 6th Annual Conference on Innovation and Technology in Computer Science Education (pp. 49–52). New York, NY: ACM Press. doi: 10.1145/377435.377467
Clark, R. C. & Mayer, R. E. (2003). E-learning and the science of instruction. San Francisco, CA: Jossey-Bass
Collis, B., Therrien, D., Kass, H., Kieren, T., & Wood, P. (1988, June). Gender differences in Canadian grade 11 students interactions with computers: Results of a national study. Paper presented at the Annual Meeting of the Canadian Society for Studies in Education, Windsor, Ontario, Canada.
Diehl, S. (2007). Software visualization: Visualizing the structure, behaviour, and evolution of software. Berlin, German: Springer.
Field, A. (2005). Discovering statistics using SPSS (and sex, drugs and rock’n’roll) (2nd ed). London, UK: Sage.
Gomez-Albarran, M. (2005). The teaching and learning of programming: A survey of supporting software tools. The Computer Journal. 48(2) 130-144.
Gomez-Martin, P. P, Gomez-Martin, M. A., & Gonzalez-Calero, P. A. (2003). Javy:Virtual environment for case-based teaching of Java virtual machine. Lecture Notes on Computer Science, 2773, 906–913.
Hess, R., & Miura, I. (1983). Gender and socioeconomic differences in enrollment in computer camps and classes. (Unpublished manuscript). Stanford University, Stanford, CA, USA.
Hongwarittorrn, N. & Krairit, D. (2010, April). Effects of program visualization (Jeliot3) on students' performance and attitudes towards Java programming. Paper presented at the spring 8th International conference on Computing, Communication and
Control Technologies, Orlando, Florida, USA. Retrieved April 23, 2010, from
http://www.iiis.org/CDs2010/CD2010IMC/CCCT_2010/PapersPdf/TA750PM.pdf
Hundhausen, C. D., Douglas, S. A., & Stasko, J. D. (2002). A meta-study of algorithm visualization effectiveness. Journal of Visual Languages and Computing. 13(3), 259-290.
Hundhausen, C. D., & Brown, J. L. (2007). What you see is what you code: A “live” algorithm development and visualization environment for novice learners. Journal of Visual Languages and Computing, 18(1), 22-47.
LaFollette, P., Korsh, J., & Sangwan, R. (2000). A visual interface for effortless animation of C/C++ programs. Journal of Visual Languages and Programming, 11(1), 27-48.
Lavonen, J. M., Meisalo, V. P., Lattu, M., & Sutinen, E. (2003). Concretising the programming task: A case study in a secondary school. Computers & Education, 40(2), 115-135.
Lau, W. W. F., & Yuen, A. H. K. (2009). Exploring the effects of gender and learning styles on computer programming performance: Implications for programming pedagogy. British Journal of Educational Technology, 40(4), 696-712.
Lee, G. C., & Wu, J. C. (1999). Debug it: A debugging practicing system. Computers & Education, 32(2), 165-179.
Lee, W. W., & Owens, D. L. (2000). Multimedia-based instructional design: Computer-based training, web-based training, distance broadcast training. San Francisco, CA: Jossey-Bass.
Lessa, D., Jayaraman, B., & Czyz, J. K. (2010). JIVE: A Pedagogic Tool for Visualizing the Execution of Java Programs. (Technical Report 2010-13). Retrieved May 15, 2010, from http://www.cse.buffalo.edu/tech-reports/2010-13.pdf Ben-Bassat Levy, R., Ben-Ari, M., & Uronen, P. A. (2003). The Jeliot 2000 program animation system. Computers & Education, 40(1), 1-15.
Lieberman, D. (1985). Research on children and microcomputers: A review of utilization and effects studies. In M. Chen & W. Paisley (Eds.), Children and microcomputers: Research on the newest medium (pp. 59-83). Beverly Hills, CA: Sage Publications. Mayer, R. E., & Moreno, R. (2002). Animation as an aid to multimedia learning. Educational Psychology Review, 14(1), 87-99. Milne, I., & Rowe, G. (2004). OGRE: Three-dimensional program visualization for novice programmers. Education and Information Technologies, 9(3), 219-237.
Miyadera, Y., Kurasawa, K., Nakamura, S., Yonezawa, N., & Yokoyama, S. (2007). A real-time monitoring system for programming education using a generator of program animation systems. Journal of Computers, 2(3), 12-20.
Moons, J., & Backer C. D. (2012). The design and pilot evaluation of an interactive learning environment for introductory programming influenced by cognitive load theory and constructivism. Computers & Education, 60(1), 368–384.
Moons, J., & Backer C. D. (2009). Rationale behind the design of the EduVisor software visualization component. Electronic Notes in Theoretical Computer Science, 224, 57-65.
Moreno, A., & Joy, M. S. (2007). Jeliot 3 in a demanding educational setting. Electronic Notes in Theoretical Computer Science, 178, 51-59.
Naps, T.L., Rößling, G., Almstrum, V., Dann, W., Fleischer, R., Hundhausen, C., … Velázquez-Iturbide, J.A. (2003). Exploring the role of visualization and engagement in computer science education. ACM SIGCSE Bulletin, 35(2), 131-152.
Rajala, T., Laakso, M.-J., Kaila, E., & Salakoski, T. (2008). Effectiveness of program visualization: A case study with the ViLLE tool. Journal of Information Technology Education: Innovations in Practice, 7, 15-32.
Rountree, N., Rountree, J., & Robins, A. (2002). Predictors of success and failure in a CS1 course. SIGCSE Bulletin, 34(4), 121– 124.
Rowe, G., & Thorburn, G. (2000). VINCE – an on-line tutorial tool for teaching introductory programming. British Journal of Educational Technology, 31(4), 359-369.
Sivula, K. (2005). A qualitative case study on the use of Jeliot 3. (Unpublished master’s thesis). University of Joensuu,
Department of Computer Science, Finland. Retrieved May 13, 2010, from
ftp.cs.joensuu.fi/pub/Theses/2005_MSc_Sivula_Kimmo.pdf
Smith, P. A., & Webb, G. I. (2000). The Efficacy of a Low-Level program visualisation tool for teaching programming concepts to novice C programmers. Journal of Educational Computing Research, 22(2), 187-215.
Storey, M.-A. D., Wong, K., & Müller, H. A. (2000). How do program understanding tools affect how programmers understand programs? Science of Computer Programming, 36, 183-207.
Weber, G., & Brusilovsky P. (2001). ELM-ART: An adaptive versatile system for web-based instruction. International Journal of Artificial Intelligence in Education, 12, 351-384.