286
(34)
Dr. Öğr. Üyesi İlknur SAYAN116
SERVQUAL MODEL IN EVALUATION OF HEALTHCARE SERVICE QUALITY; APPLICATION OF A RESEARCH and TRAINING HOSPITAL
SAĞLIK HİZMET KALİTESİNİN DEĞERLENDİRİLMESİNDE HİZMET MODELİ; ARAŞTIRMA ve EĞİTİM HASTANESİ BAŞVURUSU
ABSTRACT
Hospitals are service institutions that perform a large part of health services and undertake important tasks for a healthy society. This study aims to measure and evaluate the quality of healthcare services using the Servqual model, which reveals the views of inpatients. Research data were collected from 213 randomly selected participants in a Training Hospital in Istanbul using the "SERVQUAL scale" adapted for hospitals by Carmen (2000). According to the data obtained, the SERVQUAL scores of the perceived and expected service quality levels and service quality dimensions from a training and research hospital were calculated. When the expectations and perceptions about the dimensions of service quality are evaluated it was observed that the expected service quality average score was (6,584) and expectations were positive.
However, the perceived service average score was (-6,584), the nursing services score was (-0.35), the planning of discharge procedures score was (-0.24), tangible assets score was (-0.65) and the reliability score was (-0.16) so it has been determined that the service quality of health services is lower than expected. As a result, it was found that the service quality perceived by the patients was above the expected service quality.
Keywords: Servqual Model, Service Quality, Service Quality Measurement, Training and Research Hospital.
ÖZ
Hastaneler, sağlık hizmetlerinin büyük bir bölümünü gerçekleştiren ve sağlıklı bir toplum için önemli görevler üstlenen hizmet kurumlarıdır. Bu çalışma, hastanede yatan hastaların görüşlerini ortaya koyan Servqual modeli ile sağlık hizmetlerinin kalitesini ölçmeyi ve değerlendirmeyi amaçlamaktadır. Araştırma verileri, Carmen (2000) tarafından hastaneler için uyarlanan "SERVQUAL ölçeği" kullanılarak İstanbul'daki bir Eğitim Hastanesinde rastgele seçilen 213 katılımcıdan toplanmıştır. Elde edilen verilere göre bir eğitim ve araştırma hastanesinden algılanan ve beklenen hizmet kalitesi düzeyleri ile hizmet kalitesi boyutlarının SERVQUAL puanları hesaplanmıştır. Hizmet kalitesinin boyutları ile ilgili beklenti ve algılar değerlendirildiğinde, beklenen hizmet kalitesi ortalama puanının (6.584) ve beklentilerin olumlu olduğu görülmüştür.
Ancak algılanan hizmet ortalama puanı (-6,584), hemşirelik hizmetleri puanı (-0,35), taburculuk işlemleri planlama puanı (-0,24), maddi varlık puanı (-0,65) ve güvenirlik puanı (- 0.16) dolayısıyla sağlık hizmetlerinin hizmet kalitesinin beklenenden düşük olduğu tespit edilmiştir. Sonuç olarak hastaların algıladıkları hizmet kalitesinin beklenen hizmet kalitesinin üzerinde olduğu görüldü.
Anahtar Kelimeler: Servqual Modeli, Hizmet Kalitesi, Hizmet Kalitesi Ölçümü, Eğitim ve Araştırma Hastanesi.
116 Dr. İlknur SAYAN, Istanbul Kent Üniversitesi, Sağlık Bilimleri Fakültesi, İstanbul/TÜRKİYE; ORCID:
INTRODUCTION
The health sector undertakes one of the indispensable roles of social life among the service sectors in our country (Vural, 2017). Health institutions have a special position in protecting, maintaining, treating and increasing the quality of human life. Healthcare organizations should provide equal, fair, timely, accessible, adequate, productive, effective quality services that respects patient and human rights (Sargutan, 2005). In the health sector, rapidly changing technology, increasing costs, increasing patient complaints and the increase in demand for quality patient care necessitated the change and development of health services (Zerenler and Öğüt, 2007). Health institutions should meet the expectations and needs of patients. Policies that will ensure the satisfaction of patients should be developed in planning health services (Şahinli and Tarım, 2020). Today, a very rapid change process is experienced in the field of health as in every field. The quality of health services is also an indicator of the socio-economic development level of the countries. Achieving a competitive advantage in the health sector depends on the quality of the service provided and customer satisfaction. The effects of service quality on current and future potential customers are enormous (Kayhan and Özmen, 2015). In addition, service quality has a critical importance for ensuring the standards of service systems to increase competitiveness (Savaş and Kesmez, 2014; Yurtsever, 2015: 24) and customer satisfaction (Altuntas, Dereli and Kaya, 2020). This situation makes it necessary to prioritize efficiency and service quality in production and presentation. For health institutions 'own performance evaluations, it is important to measure patients' satisfaction and perceptions of service quality (Vural, 2017). Therefore, the interest in service quality has increased in the last decade. Many studies have been conducted on measuring the quality of healthcare services, which have a complex structure, and are still being conducted (Vural, 2017; Volkan and Südaş, 2017). The SERVQUAL model is commonly used to evaluate the quality expected by patients and the quality of services actually provided.
Curative health services are a type of service provided to people with poor health. As it is known, curative health services require more cost, more comprehensive device and hardware, equipment and qualified personnel compared to preventive health services (Çelikay and Gümüş, 2011; Devebakan, 2001). A classification has been made as primary, secondary and tertiary health services. Tertiary health services are healthcare services with the highest cost, where high technology is used, information-requiring treatment services are provided by health institutions such as training-research hospitals, university hospitals and special branch hospitals (Döşkaya, 2019: 9). The quality of tertiary health care services should be measured and evaluated with the perception of the customer and used as a data source in all kinds of planning related to health. For this purpose, in this study, it was tried to reveal the importance levels of the dimensions showing the perceived and expected health service quality, to measure the service quality accordingly and to evaluate the perceived service quality level of the hospital in terms of socio-demographic characteristics.
2.THEORICAL FRAMEWORK
2.1. Quality Concept in Healthcare Services
The origin of the word quality comes from Latin, "how it came about", that is "qualis". Quality, which is used for goods and services, aims to define and express what that good or service actually is (Arısoy, 2017). Quality is suitability for wishes and expectations (Yurtsever, 2015: 24). Therefore, it includes subjective values, not objective values. The subjective values of quality change according to the conditions of the time, social structure and transformations in living standards. Consequently, customers' expectations for quality are constantly changing (Arısoy, 2017). Businesses, which realized that quality is an important factor in competition, started to attach importance to quality (Taşlıyan and Sibel, 2012). With the development of the understanding of quality, the activities of measuring and improving quality have become widespread in the service sector (Tarım and Zaim, 2010).
288
all activities, fair and efficient use of the resources used, and the satisfaction of those who receive the service in and after the health service (Yazgan, 2009: 43).
Quality healthcare is one of the most basic needs for individuals, organizations and society. These services are also necessary for healthcare workers (Butt, Mohsin and Run, 2010). There are some specific differences in the measurement of service quality of the health sector. In addition to the diagnosis, treatment and care services in accordance with the quality standards, healthcare services are also meeting the expectations and needs of patients in all service processes (Kıraç, 2015: 16). Meeting the healthcare expectations of patients is an indicator of quality service. The approach, interest and effort of healthcare professionals towards the patient are directly related to the quality level of the hospital. In health institutions, employee satisfaction and motivation is a priority factor that also ensures patient satisfaction.
2.2. Service Quality and SERVQUAL Model
A service is an intangible (Bulgan and Gürdal, 2005), heterogeneous and non-physical activity or benefits offered by a person or organization, with simultaneous production and consumption (Savaş and Kesmez, 2014). Services are an activity and / or benefit that cannot be touched and does not result in ownership of anything (Parasuraman, Zeithaml and Berry, 1985). In addition, services can be defined as all economic activities that provide benefits in terms of place, time, form and psychology (Papatya, Papatya and Hamşıoğlu 2012).
In the service area, quality is very subjective and therefore it is difficult to evaluate or control the service precisely (Lee and Yom, 2007). Services are intangible, labor-intensive and directly related to the employee's performance. Due to this feature of the services, the service quality may not always be at the same level. However, organizations that care about customer loyalty have to provide consistent and superior service (Volkan and Südaş, 2017). Service quality is difficult to measure.
One of the methods of measuring service quality is to measure the difference between expectation and performance (Lee & Yom, 2007). Service quality is a function of perceived quality and expected quality. Accordingly, a patient has certain expectations before receiving the service. Certain perceptions are formed as a result of the experience of the service (Parasuraman, Zeithaml and Berry, 1985). Therefore, the customer sets expectations about what the business should offer before use. For this reason, the term "perceived service quality" is used instead of service quality (Papatya, Papatya and Hamşioğlu, 2012). Perceived quality is the difference between customers' expectations before receiving the service and their perceptions after receiving the service (Şahin, Azize and Şen, 2017).
The expected quality is what kind of quality customers imagine in their minds before they get the service regarding the services they will receive. The concept of expected quality can be defined as the customers' expectations from the current service process (Korkmaz and Çuhadar, 2017).
If the expected performance is higher than the perceived performance, customers will not be satisfied. On the other hand, when perceived performance is equal to expected, customers are in a neutral position, neither satisfied nor dissatisfied (Peprah, 2014). In order for the perceived service quality to be satisfactory, the service provided must meet the expectations of the customers. Perceived quality equal or higher than expectations is the desired situation (Parasuraman, Zeithaml and Berry, 1985).
Subjectively perceived service quality plays an increasingly important role as an element of competitive advantage in the healthcare sector (Parasuraman, Zeithaml and Berry, 1985). Many of the recent research has been influenced by the pioneering work of Parasuraman, Berry and Zeithalm. One of the scales commonly used in measuring service quality is the model developed by Parasuman et al., abbreviated as SERVQUAL. SERVQUAL model is used to determine high quality factors and measure customer satisfaction. It is one of the most commonly used comprehensive methods of assessing expected and perceived service quality. It is also crucial to the quality improvement process and thus allows the identification of "weak points". The SERVQUAL model is an increasingly popular model as a tool used to evaluate the quality offered by healthcare organizations (Manulik, Rosińczuk and Karniej, 2016).
Carmen (2000) treated service quality as an attitude. Carmen (2000) adapted the SERVQUAL scale to hospitals and conducted various studies on this subject (Tarım and Zaim, 2010). Based on the definition of Gronroos (1990), Carmen (2000) examined the importance of functional and technical features of service quality in the assessment of service quality and, if any, their interactions (Yağcı and Duman, 2006) and sought an answer to the “Does a successful service delivery affects the patients' opinions about correct treatment?" question. Carmen (2000) used a scale consisting of five dimensions: nursing services, reliability, planning of discharge procedures, tangible assets, explanation and assurance (Tarım, 2002). The findings showed that technical features are more important than functional features in patients' perception of service quality. In addition, it has been revealed that the technical features are not affected by functional features. Therefore, it has been observed that the way the service is provided in a hospital does not affect the opinions of patients about technical features (Devebakan and Aksaraylı, 2003).
When the literature on this subject is examined, it is possible to see that there are many studies on the measurement of service quality in the health sector. In a study conducted with the SERVQUAL model in Korean hospitals, it was concluded that both patients and nurses performed poorly in providing service quality (Lee and Yom, 2007). In a study conducted in our country, in a study comparing public and private hospitals, it was seen that outpatients and inpatients attach the greatest importance to the reliability dimension (Demirer and Bülbül, 2014).
2. METHOD
2.1. Purpose of the research
The main purpose of this study is to calculate the expected and perceived service quality scores of inpatients using the SERVQUAL model. In addition, to determine the satisfaction level of inpatients with the service quality and to present some suggestions to the managers by revealing what dimensions should be paid attention to in order to increase the service quality.
2.2. Research Main Universe, Sampling and Data Collection Tool
The universe of the research consists of inpatients in a training and research hospital in Istanbul. The research took place between June and July 2020. Participation in the study is voluntary and one of the inclusion criteria is the consent of the patients to participate in the study. 250 patients answered the research questionnaire. The convenience sampling method was used to create the sample of the study. Easy sampling is a non-random sampling method determined by the researcher in the selection of samples from the universe. However, as a result of the examination, it was noticed that 37 questionnaires were not filled properly and they were excluded from the evaluation. The number of researches was carried out with data collected from 213 participants.
In the study, Carmen (2000)'s SERVQUAL scale consisting of 34 questions adapted to hospitals was used. Its scale was adapted to Turkish with the study published by Tarım (2002). The scale consists of five dimensions: nursing services, reliability, planning of discharge procedures, tangible assets, disclosure and assurance. In order to measure the expectations and perceptions of the participants, the questions were prepared as a 5-point Likert scale, meaning "1" means strongly disagree, "5" means absolutely agree ".
2.3. Research Model and Hypothesis
The dimensions of the Servqual scale, adapted by Carmen for hospitals, constitute the model of the study.
290
Model 1: Model of the Research
2.3.1. Hypotheses
H1: Perceived service
quality in nursing services is higher than expected service quality.
H2: Perceived service quality in terms of explanation and assurance is higher than the expected service quality.
H3: The perceived service quality in the planning of discharge procedures is higher than the expected service quality.
H4: The perceived service quality in terms of reliability is higher than the expected service quality.
H5: Perceived service quality in terms of tangible assets is higher than the expected service quality.
H6: The perceived service quality is higher than the expected service quality. 2.4 Statistical Techniques Used in the Analysis
SPSS 22.0 and AMOS 24 programs were used in the analysis of the data. Confirmatory factor analysis was applied for the SERVQUAL scale used in the study. Cronbach's Alpha, Average Variance Explained (AVE) and Composite Reliability (CR) values of the SERVQUAL scale sub-dimensions were calculated and it was revealed that the divergence validity and convergence validity were provided. The change of SERVQUAL scale sub-dimensions according to demographic characteristics was analyzed by One-Way Analysis of Variance (ANOVA) and independent sample t test.
3. FINDINGS
3.1 Demographic Characteristics of the Participants
Socio-demographic information of the participants is given below in Table.1. Table1. Demographic Characteristics of Participants
n % Gen der Male 16 5 77,5% Female 48 22,5% Age Groups 20-29 12 9 60,6% 30-39 11 5,2% 40-49 13 6,1% 50 + 60 28,2% Prof ession Private 99 46,5% Govern ment 3 1,4% Unempl oyed 49 23,0% Public Personnel 15 7,0% Student 3 1,4% Retired 18 8,5%
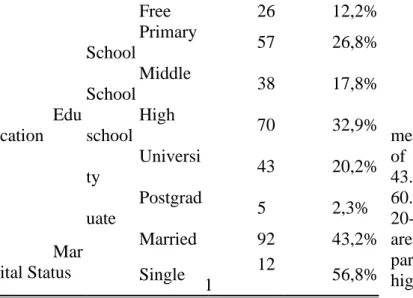
While 77.5% of the participants are men, 22.5% are women. The marital status of the participants is 56.8% single and 43.2% are married. Among the age groups, 60.6% of the participants are younger than 20-29 years old. 46.5% of the participants are private sector employees. 32.9% of the participants stated that they graduated from high school and 2.3% were graduated from postgraduate programs.
3.2. Confirmatory Factor Analysis
As the sample size increases, especially in samples larger than 200, the Chi-Square (x2) value is also high and the statistical significance level of the Chi-Square (x2) test is low. In the evaluation of the confirmatory factor analysis of the scales used for the research and the suitability of the general tested models, chi-square (x2) value corrected with degrees of freedom (Chi-Square value / Degrees of freedom), other goodness of accord indices and standardized residual covariance matrix were decided as a result of the examination of the values (Bayram, 2013).
Table 2. Good of Accord Indices and Accord Values Used in Confirmatory Factor Analysis (Cem and Meydan, 2011).
Indices Good Accord Acceptable Accord χ2 / df 0 ≤ χ2/df ≤ 2 2 < χ2/df ≤ 3 GFI ≥ 0,90 0,85-0,89 CFI ≥ 0,97 ,≥ 0,95 SRMR ≤0,05 ,06 ≤ SRMR ≤ ,08 RMSEA ≤ 0,05 ,06 ≤ RMSEA ≤ ,08 Free 26 12,2% Edu cation Primary School 57 26,8% Middle School 38 17,8% High school 70 32,9% Universi ty 43 20,2% Postgrad uate 5 2,3% Mar ital Status Married 92 43,2% Single 12 1 56,8%
292
Figure 1. SERVQUAL Scale Confirmatory Factor Analysis Graphical Structure
SERVQUAL scale standard factor load values; for the nursing services (HH) dimension is in the range (.54 - .78), for the planning of discharge procedures (TYPE) is in the range (.70 - .84), for the tangible assets (ETV) dimension is in the range (.69 - .81), for the explanation and assurance (AG) dimension is in the range (.75 -, 89) and for the reliability dimension is in the range. (,70-, 95). Since the factor loading value (FL> 0.50), the items eliminated from the analysis; as the explanation and assurance (AG) dimension Article 21, "The staff of this hospital make all the necessary explanations to the patient in case of questions about any procedure." and as the planning of discharge procedures (TIP), Article 33, "This hospital has employees who give personal importance to discharged patients".
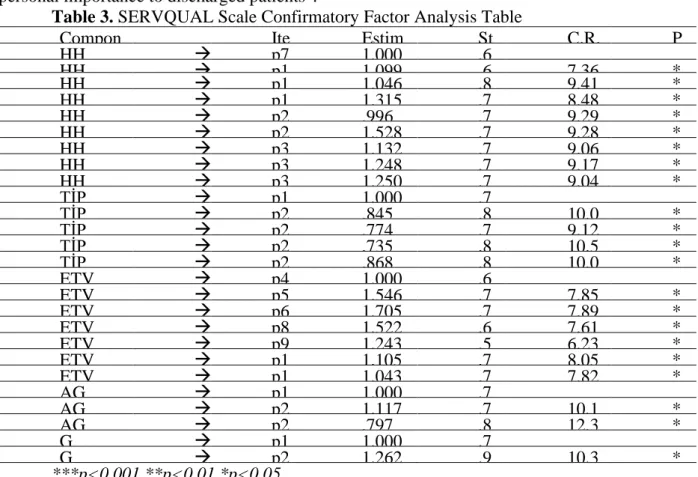
Table 3. SERVQUAL Scale Confirmatory Factor Analysis Table
***p<0.001 **p<0.01 *p<0.05
In the confirmatory analysis, it is understood that the analysis about the model test, including (P <0.05), about x2 (823,68), x2 / df (2,860) is significant. The accord indices of the model GFI (, 865) and CFI (, 921) are close to the sample acceptance limits. It can be said that there is an explanatory analysis that you are sure that SRMR (.0733), RMSEA (.0790) fall within acceptable limits.
3.3 Reliability and Validity Analysis
As is known, the Cronbach's Alpha value shows the total reliability level of the questions under the factor. The scale is considered to be reliable when the Cronbach's Alpha value is 0.70 and above. Combined reliability (CR) values are calculated from factor loadings which are calculated from confirmatory factor analysis. When the combined reliability value is (CR≥0.70), it can be said that the combined reliability requirement is fulfilled (Raykov, 1997). The indicator of convergence validity is the average variance (AVE) value explained. The average variance explained (AVE≥0.50) is required to confirm the convergent validity. However, if the combined reliability values were in all dimensions (CR≥0.70), it was considered sufficient to have AVE values (AVE≥0.40) (Fornell and Larcker, 1981: 39).
Table 4. Reliability and Validity Values of the Scales Used in the Study Compon ent Ite m Estim ate St d. Estimate C.R. P HH → p7 1,000 ,6 93 HH → p1 1 1,099 ,6 26 7,36 5 * ** HH → p1 6 1,046 ,8 09 9,41 6 * ** HH → p1 8 1,315 ,7 25 8,48 4 * ** HH → p2 3 ,996 ,7 98 9,29 6 * ** HH → p2 8 1,528 ,7 97 9,28 4 * ** HH → p3 0 1,132 ,7 78 9,06 7 * ** HH → p3 1 1,248 ,7 87 9,17 2 * ** HH → p3 2 1,250 ,7 76 9,04 6 * ** TİP → p1 5 1,000 ,7 02 TİP → p2 2 ,845 ,8 40 10,0 97 * ** TİP → p2 4 ,774 ,7 57 9,12 0 * ** TİP → p2 7 ,735 ,8 74 10,5 00 * ** TİP → p2 9 ,868 ,8 36 10,0 49 * ** ETV → p4 1,000 ,6 88 ETV → p5 1,546 ,7 16 7,85 1 * ** ETV → p6 1,705 ,7 21 7,89 6 * ** ETV → p8 1,522 ,6 93 7,61 8 * ** ETV → p9 1,243 ,5 58 6,23 3 * ** ETV → p1 0 1,105 ,7 37 8,05 2 * ** ETV → p1 2 1,043 ,7 13 7,82 1 * ** AG → p1 9 1,000 ,7 57 AG → p2 0 1,117 ,7 52 10,1 91 * ** AG → p2 6 ,797 ,8 87 12,3 97 * ** G → p1 3 1,000 ,7 04 G → p2 5 1,262 ,9 51 10,3 48 * **
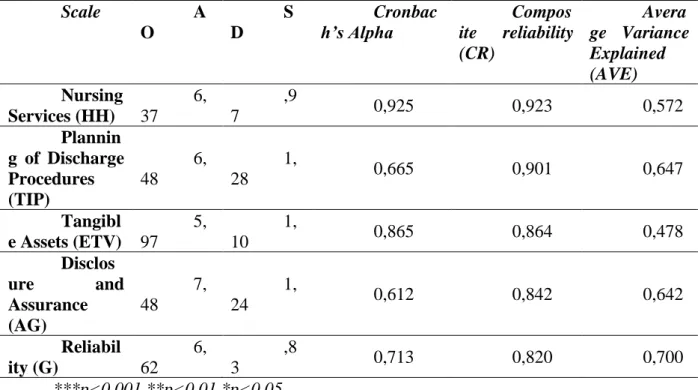
Scale A O S D Cronbac h’s Alpha Compos ite reliability (CR) Avera ge Variance Explained (AVE) Nursing Services (HH) 6, 37 ,9 7 0,925 0,923 0,572 Plannin g of Discharge Procedures (TIP) 6, 48 1, 28 0,665 0,901 0,647 Tangibl e Assets (ETV) 5, 97 1, 10 0,865 0,864 0,478 Disclos ure and Assurance (AG) 7, 48 1, 24 0,612 0,842 0,642 Reliabil ity (G) 6, 62 ,8 3 0,713 0,820 0,700 ***p<0.001 **p<0.01 *p<0.05
Alpha values for the Planning of Discharge Procedures (TYPE), Explanation and Assurance (AG) and Reliability (G) dimensions, which are sub-dimensions of the SERVQUAL scale, are at the "quiet reliable" level. Alpha values in Nursing Services (HH) and Tangible Assets (ETV) dimensions are at "high reliability" level. In Composite Reliability values, since it is the coefficient (CR> 0.70) calculated for all dimensions, it can be stated that the combined reliability requirement is met. Since the average explained variance values for all variables were found as (AVE> 0.40), the necessary condition for convergence validity was met.
3.4. Calculation of the SERVQUAL Service Quality Score
It is possible to see the expected, perceived and service quality SERVQUAL scores in Table 5 below.
Table 5. Expected, Perceived and Service Quality SERVQUAL Scores
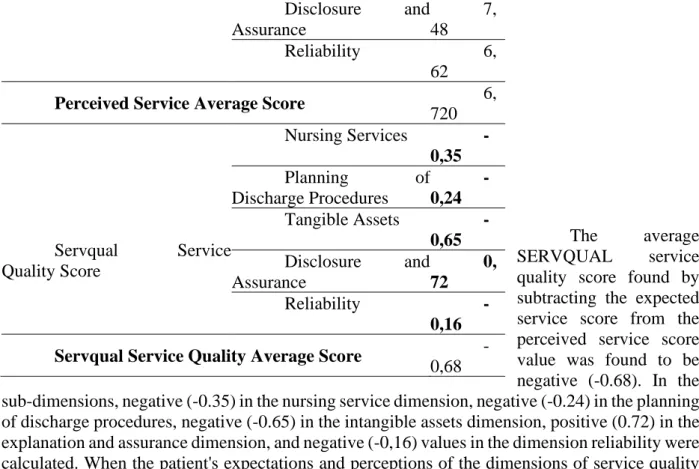
Scale Dimensions A O Expected Service Nursing Services 6, 72 Planning of Discharge Procedures 6, 72 Tangible Assets 6, 62 Disclosure and Assurance 6, 76 Reliability 6, 78
Expected Service Average Score 6,
584 Perceived Service Nursing Services 6, 37 Planning of Discharge Procedures 6, 48 Tangible Assets 5,
294
The average
SERVQUAL service
quality score found by subtracting the expected service score from the perceived service score value was found to be negative (-0.68). In the sub-dimensions, negative (-0.35) in the nursing service dimension, negative (-0.24) in the planning of discharge procedures, negative (-0.65) in the intangible assets dimension, positive (0.72) in the explanation and assurance dimension, and negative (-0,16) values in the dimension reliability were calculated. When the patient's expectations and perceptions of the dimensions of service quality are evaluated, the expected service average score (6,584) is positive but the perceived service average score (-6,584) and four of the five dimensions are negative [nursing services (-0,35), planning discharge procedures (-0,24), tangible assets (-0.65) and reliability (-0.16)] and it revealed that patients did not receive the expected service. The positive dimension of SERVQUAL service quality is the explanation and assurance (0,72) dimension. Apart from the “explanation and assurance” dimension, it is understood that the service quality perceived by the patients is below the service quality they expect in other service quality dimensions.
3.5. Comparison of the SERVQUAL Service Quality Score by Demographic Features It is possible to see the comparison of the participants' SERVQUAL service quality score by gender in Table 6 below.
Table 6. Comparison of SERVQUAL Service Quality Score by Gender Dimension G ender N A O SS t p Nursing Services M ale 1 65 -,378 ,82 36 -1,259 ,210 F emale 4 8 -,218 ,60 03 Planning of Discharge Procedures M ale 1 65 -,211 1,2 426 -,089 ,929 F emale 4 8 -,194 ,63 33 Tangible Assets M ale 1 65 -,623 ,98 36 ,615 ,540 F emale 4 8 -,723 1,0 150 Disclosure and Assurance M ale 1 65 1 ,592 18, 4944 ,685 ,494 Disclosure and Assurance 7, 48 Reliability 6, 62
Perceived Service Average Score 6,
720 Servqual Service Quality Score Nursing Services -0,35 Planning of Discharge Procedures -0,24 Tangible Assets -0,65 Disclosure and Assurance 0, 72 Reliability -0,16 Servqual Service Quality Average Score
F emale 4 8 -,240 ,63 57 Reliability M ale 1 65 -,127 ,72 55 ,386 ,700 F emale 4 8 -,177 ,97 02
In the comparison made by gender, no significant difference was found in all of the SERVQUAL service quality dimensions (p> 0.05). Service quality scores of female and male participants did not differ in all dimensions.
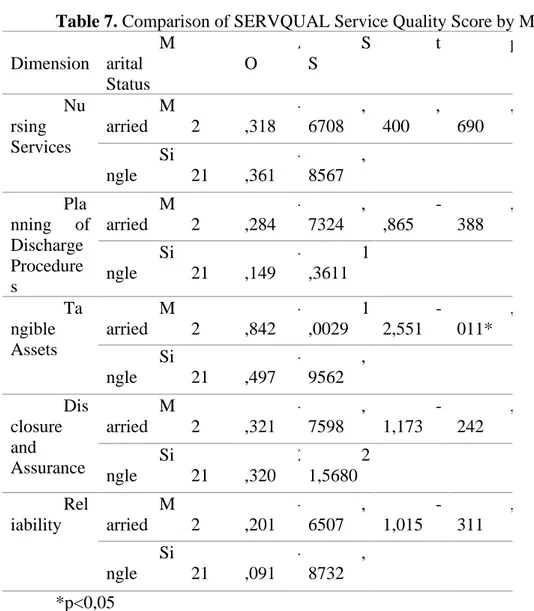
It is possible to see the comparison of the SERVQUAL service quality score of the participants according to their marital status in Table 7 below.
Table 7. Comparison of SERVQUAL Service Quality Score by Marital Status Dimension M arital Status N A O S S t p Nu rsing Services M arried 9 2 -,318 , 6708 , 400 , 690 Si ngle 1 21 -,361 , 8567 Pla nning of Discharge Procedure s M arried 9 2 -,284 , 7324 -,865 , 388 Si ngle 1 21 -,149 1 ,3611 Ta ngible Assets M arried 9 2 -,842 1 ,0029 -2,551 , 011* Si ngle 1 21 -,497 , 9562 Dis closure and Assurance M arried 9 2 -,321 , 7598 -1,173 , 242 Si ngle 1 21 2 ,320 2 1,5680 Rel iability M arried 9 2 -,201 , 6507 -1,015 , 311 Si ngle 1 21 -,091 , 8732 *p<0,05
In the comparison made according to marital status, there was no significant difference in SERVQUAL service quality dimensions (P> 0.05), except for the "Tangible Assets" dimension. For these dimensions, the service quality scores of married and single participants did not differ. There is a significant difference since it is found in the Tangible Assets Dimension (p <0.05). The average of married participants (-, 842) was lower than the average of single participants (-, 497).
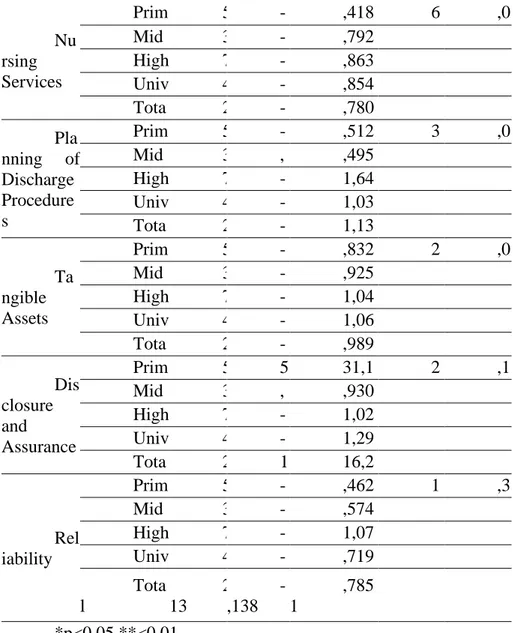
It is possible to see the comparison of SERVQUAL service quality score according to the education level of the participants in Table 8.
296 Nu rsing Services Prim ary School 5 7 -,144 ,418 4 6 ,091 ,0 01** Mid dle School 3 8 -,035 ,792 1 High School 7 0 -,513 ,863 0 Univ ersity 4 8 -,572 ,854 8 Tota l 2 13 -,342 ,780 5 Pla nning of Discharge Procedure s Prim ary School 5 7 -,044 ,512 3 3 ,082 ,0 28* Mid dle School 3 8 , 013 ,495 3 High School 7 0 -,179 1,64 56 Univ ersity 4 8 -,618 1,03 08 Tota l 2 13 -,207 1,13 29 Ta ngible Assets Prim ary School 5 7 -,434 ,832 5 2 ,547 ,0 57 Mid dle School 3 8 -,470 ,925 8 High School 7 0 -,747 1,04 93 Univ ersity 4 8 -,890 1,06 83 Tota l 2 13 -,646 ,989 2 Dis closure and Assurance Prim ary School 5 7 5 ,768 31,1 674 2 ,114 ,1 00 Mid dle School 3 8 , 053 ,930 3 High School 7 0 -,550 1,02 91 Univ ersity 4 8 -,854 1,29 53 Tota l 2 13 1 ,180 16,2 873 Rel iability Prim ary School 5 7 -,149 ,462 6 1 ,203 ,3 10 Mid dle School 3 8 -,039 ,574 0 High School 7 0 -,064 1,07 65 Univ ersity 4 8 -,313 ,719 2 Tota l 2 13 -,138 ,785 1 *p<0,05 **<0,01
There is a significant difference in the comparison made according to educational status, as it is found in the dimensions of planning discharge procedures and nursing services (p <0.05). No significant difference was found in the dimensions of tangible assets, disclosure and assurance and reliability (P> 0.05).
• In the Nursing Services dimension, the average of middle school (-, 035) and primary school (-, 144) graduates is higher than the average of high school (-, 513) and university (-, 572) graduates.
• In the Planning of Discharge Procedures dimension, the average of middle school (-, 013) and primary school (-, 044) graduates is higher than the average of high school (-, 179) and university (-, 618) graduates. In addition, the average of university graduates (--.618) is higher than the average of high school (-, 179) graduates.
It is possible to see the comparison of the SERVQUAL service quality score according to the occupational status of the participants in Table 9 below.
Table 9. Comparison of SERVQUAL Service Quality Score According to Occupational Status N A O SS F p Nu rsing Services Priv ate 9 9 -,447 ,927 3 1 ,316 ,2 65 Une mployed 4 9 -,288 ,732 8 Gov ernment 1 5 -,341 ,564 2
Reti red 2 4 -,319 ,689 1 Free 2 6 -,068 ,144 3 Tota l 2 13 -,342 ,780 5 Pla nning of Discharge Procedures Priv ate 9 9 -,187 1,50 31 , 239 ,9 16 Une mployed 4 9 -,248 ,714 5 Gov ernment 1 5 -,400 ,773 6 Reti red 2 4 -,243 ,835 5 Free 2 6 -,064 ,142 0 Tota l 2 13 -,207 1,13 29 Ta ngible Assets Priv ate 9 9 -,613 1,07 16 1 ,892 ,1 13 Une mployed 4 9 -,741 1,03 00 Gov ernment 1 5 -,886 ,724 8 Reti red 2 4 -,887 1,07 73 Free 2 6 -,231 ,326 0 Tota l 2 13 -,646 ,989 2 Dis closure and Assurance Priv ate 9 9 2 ,831 23,8 341 , 473 ,7 55 Une mployed 4 9 -,337 ,854 8 Gov ernment 1 5 -,283 ,812 1 Reti red 2 4 -,385 ,776 6 Free 2 6 , 038 ,329 3 Tota l 2 13 1 ,180 16,2 873 Rel iability Priv ate 9 9 -,131 ,761 3 2 ,176 ,0 73 Une mployed 4 9 -,378 ,875 2 Governmen t 1 5 , 200 ,774 6 Reti red 2 4 -,042 1,00 99 Free 2 6 , 000 ,000 0 Tota l 2 13 -,138 ,785 1
In the comparison made according to occupational status, no significant difference was found in all of the SERVQUAL service quality dimensions (p> 0.05). The service quality scores of the participants in different professions in all dimensions do not differ.
CONCLUSION
Institutions providing health services have to organize financial and human resources in order to achieve their goals according to their plans and programs, determine how to benefit from these resources in the best way, and measure performance by controlling the results to be achieved. Thus, the continuity of the harmony between the goals and activities will be ensured and success will be achieved.
The SERVQUAL scale confirmatory factor analysis applied in a training and research hospital was found to be within meaningful and acceptable limits. As a result of the factor analysis, the dimensions determined in accordance with the SERVQUAL scale are nursing services, planning of discharge procedures, tangible assets, reliability, explanation and assurance. As a result of the research, the satisfaction level of the dimensions except the explanation and assurance dimension among the service quality dimensions was found to be low. According to the SERVQUAL service quality dimensions, it is understood that the service quality perceived by the patients is below the service quality they expect, except for the "explanation and assurance"
298
examined. There is a significant difference in the quality of healthcare services of the patients according to the marital status in the "tangible assets dimension". In addition, there is a significant difference in the dimensions of "planning discharge procedures" and "nursing services" according to education level. However, there is no significant difference between the service quality according to other socio-demographic characteristics (gender, age groups and profession).
In order to increase the service quality, the processes where patient satisfaction is low should be reviewed by the managers and the necessary improvement and correction activities should be done quickly. Accordingly, health institutions should determine the demands and expectations of their customers and carry out studies accordingly.
All employees, especially managers, should participate in quality activities in health care. Effective implementation of corrective and preventive activities in hospitals will increase the service quality. This study was conducted in a training and research hospital in Istanbul province with the participation of patients. However, SERQUAL service quality studies are recommended in hospitals in Istanbul and other provinces.
REFERENCES
1. Altuntas, S., Dereli, T. and Kaya, İ. (2020). Monitoring patient dissatisfaction: A
methodology based on SERVQUAL scale and statistical process control charts. Total Quality Management & Business Excellence, 31(9-10), 978-1008.
2. Arısoy, D.Ş. (2017), Sağlık hizmetlerine hizmet kalitesi ve hizmet kalitesinin servqual
yöntemi ile ölçülmesine yönelik bir uygulama. Gazi Üniversitesi İİBF Dergisi, 19, 3, 1079.
3. Bayram, N. (2013). Yapısal eşitlik modellemesine giriş AMOS uygulamaları. Ezgi
Yayınevi.
4. Bulgan, U. and Gürdal, G. (2005). Hizmet kalitesi ölçülebilir mi?, ÜNAK’05, Bilgi
Hizmetlerinin Organizasyonu ve Pazarlanması, 22 - 24 Eylül.
5. Butt, M. M. and de Run, E. C. (2010). Private healthcare quality: Applying a SERVQUAL
model. International Journal Of Health Care Quality Assurance, 23,7.
6. Çelikay, F. and Gumus, E. (2011). Sağlıkta dönüşümün ampirik analizi. Journal of the
Faculty of Political Science, 66(3), 55-92.
7. Çetin, S. and Kuzucu, H. (2019). SERVQUAL ölçeği ile yaşlı bakim evlerinde hizmet
kalitesinin ölçümü. Selçuk Üniversitesi Mühendislik, Bilim ve Teknoloji Dergisi, 7(2), 509-523.
8. Chalise, G. D., Bharati, M., Niraula, G. D. and Adhikari, B. (2018). How the patient
perceives about nursing care: Patient satisfaction study using SERVQUAL model. Galore International Journal of Health Sciences and Research, 3(2), 23-29.
9. Christoglou, K., Vassiliadis, C. and Sigalas, I. (2006). Using SERVQUAL and Kano
research techniques in a patient service quality survey. World hospitals and health services: the official journal of the International Hospital Federation, 42(2), 21-26.
10. Devebakan, N. (2001). Sağlık İşletmelerinde Kalite ve Algılanan Hizmet Kalitesinin
Ölçülmesi. DEÜ Sosyal Bilimler Enstitüsü, Yayınlanmamış Yüksek Lisans Tezi.
11. Devebakan, N. and Aksarayli, M. (2003). Sağlık işletmelerinde algılanan hizmet
kalitesinin ölçümünde SERVQUAL skorlarının kullanımı ve Özel Altınordu Hastanesi uygulaması. Dokuz Eylül Üniversitesi Sosyal Bilimler Enstitüsü Dergisi, 5, 1, 38-54.
12. Fisk, R. P., Stephen W. B. and Bitner, M. J. (1993). Tracking the evolution of the services
marketing literature, Journal of Retailing, 69,1, 61-103.
13. Fornell, C. and Larcker, F.D., (1981), Evaluating structural equation models with
unobservable variables and measurement error. Journal of Marketing Research, 18,1, 39-50.
14. Halil, Z. and Tarım, M. (2011). Hasta memnuniyeti: Kamu hastaneleri üzerine bir alan
araştırması, Sosyal Siyaset Konferansları Dergisi, 59, 1-24.
15. Kayhan, C. and Özmen, D. (2015). Hizmeti sunan ve alan taraflar açısından sağlık hizmet
kalitesinin değerlendirilmesi. Sağlıkta Performans ve Kalite Dergisi, 10 (2),
16. Korkmaz, S. and Çuhadar, U. (2017). Sağlık hizmet kalitesi ve sağlık kurumunu tekrar
tercih etme niyeti arasındaki ilişki: Eğitim ve araştırma hastanesi örneği. Uluslararası Sağlık Yönetimi ve Stratejileri Araştırma Dergisi, 3(1), 72-87.
17. Kuzu, A. (2010). Yaşlı bakım kurumlarında hizmet kalitesi kavramı ve kavramsal hizmet kalitesi modeli: SERVQUAL uygulaması. Yayımlanmamış Doktora Tezi. Sakarya Üniversitesi/Sosyal Bilimler Enstitüsü, Sakarya.
18. Lee, M. A. and Yom, Y. H. (2007). A comparative study of patients’ and nurses’
perceptions of the quality of nursing services, satisfaction and intent to revisit the hospital: A questionnaire survey. International Journal Of Nursing Studies, 44(4), 545-555.
19. Lee, M. A. and Yom, Y. H. (2007). A comparative study of patients’ and nurses’
perceptions of the quality of nursing services, satisfaction and intent to revisit the hospital: A questionnaire survey. International Journal Of Nursing Studies, 44(4), 545-555.
20. Manulik, S., Rosińczuk, J. and Karniej, P. (2016). Evaluation of health care service quality
in Poland with the use of SERVQUAL method at the specialist ambulatory health care center. Patient Preference and Adherence, 10, 14.
21. Meydan, C.H. and Şeşen, H. (2011). Yapısal Eşitlik Modellenmesi Amos Uygulamaları.
Birinci Baskı. Ankara: Detay Yayıncılık.
22. Öter, V. and Südaş, H. D. (2017). Algılanan hizmet kalitesinin hasta bağlılığı üzerine
etkisi: Devlet hastanesi üzerine bir inceleme. Çukurova Üniversitesi İİBF Dergisi, 21(2), 43-57.
23. Papatya, G., Papatya, N. and Hamşıoğlu, A. B. (2012). Sağlık işletmelerinde algılanan
hizmet kalitesi ve hasta memnuniyeti: İki özel hastanede karşılaştırmalı bir araştırma. Kırıkkale Üniversitesi Sosyal Bilimler Dergisi, 2 (1), 87-108.
24. Parasuraman, A., Zeithaml, V. A. and Berry, L. L. (1985). Quality counts in service, too.
Business Horizons, 28(3), 47-52.
25. Peprah, A. A. and Bede A. A. (2014), Assessing patient’s satisfaction using servqual
model: A case of sunyani regional hospital. Ghana: International Journal of Business and Social Research (IJBSR) 4,2, 133-143.
26. Raykov, T. (1997). Estimation of composite reliability for congeneric measures. Applied
Psychological Measurement, 21, 173-184.
27. Şahin, A. and Şen, S. (2017). Hizmet kalitesinin müşteri memnuniyeti üzerine etkisi.
Journal of International Social Research, 10(52).
28. Şahinli, S. and Tarım, M. Sağlık sektöründe hizmet kalitesi ölçümü: Sistematik bir derleme
çalışması. Journal of Healthcare Management and Leadership, (1), 1-14.
29. Sargutan, A. E. (2005). Sağlık sektörü ve sağlık sistemlerinin yapısı. Hacettepe Sağlık
İdaresi Dergisi, 8(3), 400-428.
30. Savaş, H. and Kesmez, A. G. (2014). Hizmet kalitesinin SERVQUAL modeli ile
çlçülmesi: Aile sağlığı merkezleri üzerine bir araştırma. Pamukkale Üniversitesi Sosyal Bilimler Enstitüsü Dergisi, 17, 1-13.
31. Tarım, M. (2002). Sağlık sektöründe hizmet kalitesinin ölçülmesi: SERVQUAL modeli ve
bir hastane uygulaması. İstanbul Üniversitesi İktisat Fakültesi Mecmuası, 52(2), 15.
32. Taşlıyan, M. and Gök, S. (2012). Kamu ve özel hastanelerde hasta memnuniyeti:
Kahramanmaraş’ta bir alan çalışması. Kahramanmaraş Sütçü İmam Üniversitesi İİBF Dergisi, 2(1), 69-94.
33. Yağcı, M. and Duman, T. (2006). Hizmet kalitesi, müşteri memnuniyeti ilişkisinin hastane
türlerine göre karşılaştırılması: Devlet, özel ve üniversite hastaneleri uygulaması. Doğuş Üniversitesi Dergisi, 7, 2, 218-238.
34. Yağcı, M. İ. and Duman, T. (2006). Hizmet kalitesi-müşteri memnuniyeti ilişkisinin
hastane türlerine göre karşılaştırılması: Devlet, özel ve üniversite hastaneleri uygulaması. Doğuş Üniversitesi Dergisi, 7, 2, 218-238.
35. Zerenler, M. and Öğüt, A. (2007). Kriz algılaması ve örgütsel bağlılık: Bankacılık