https://doi.org/10.1007/s11255-020-02430-0
NEPHROLOGY - ORIGINAL PAPER
Echocardiographic predictors of interatrial block in patients
with severe chronic kidney disease
Macit Kalçık1 · Mucahit Yetim1 · Tolga Doğan1 · Barış Eser2 · İbrahim Doğan2 · Lütfü Bekar1 · Oğuzhan Çelik3 ·
Yusuf Karavelioğlu1
Received: 29 September 2019 / Accepted: 23 February 2020 / Published online: 10 March 2020 © Springer Nature B.V. 2020
Abstract
Background Interatrial block (IAB), defined as a conduction delay between the right and left atrium, is manifested on the electrocardiogram as a prolonged P-wave duration. Large number of studies recently have been published regarding the prevalence of IAB and its associations with the risk of atrial fibrillation and ischemic stroke. Cardiovascular diseases are the leading causes of mortality in chronic kidney disease (CKD). In this study, we aimed to investigate echocardiographic predictors of IAB in patients with severe CKD.
Methods This study enrolled a total of 155 patients [male: 95 (61.3%), mean age: 56.3 ± 12.8 years] with severe CKD (glo-merular filtration rate < 30 mL/min). All patients were evaluated by electrocardiography and transthoracic echocardiography. IAB was defined as P wave duration of ≥ 120 ms on electrocardiography.
Results Electrocardiography revealed IAB in 54 patients. The baseline demographic characteristics of the patients were similar in both groups with and without IAB. Left atrial diameter (LAD), left ventricular end-systolic and end-diastolic diameters, interventricular septal thickness, posterior wall thickness, left ventricular mass, left ventricular mass index (LVMI), and the prevalence of left ventricular hypertrophy were found to be significantly increased in patients with IAB. Increased LAD (OR = 1.119; 95% CI 1.019–1.228; p = 0.019) and LVMI (OR = 1.036; 95% CI 1.003–1.070; p = 0.031) were found to be independent predictors of IAB.
Conclusion A significant association exists between the presence of IAB and echocardiographic parameters related to left ventricular hypertrophy and left atrial dilatation. Presence of IAB may be an additional and easy diagnostic marker for risk stratification of patients with severe CKD.
Keywords Chronic kidney disease · Echocardiography · Electrocardiography · Interatrial block
Introduction
Cardiovascular complications have been reported to be the main cause of mortality in patients with chronic kidney dis-ease (CKD) [1]. The pathogenesis of cardiovascular com-plications in these patients is complex and multifactorial
including vascular changes, degeneration of cardiomyocytes, left ventricle hypertrophy, and arrhythmia as well as tradi-tional risk factors such as hypertension, dyslipidemia, and diabetes mellitus [2–4]. The most common clinical presenta-tion of cardiac impairments in the course of CKD is prob-ably the left ventricle hypertrophy [1]. However, it should be noted that in patients with CKD cardiovascular complica-tions may also include disturbances of the conduction sys-tem. Electrolyte disturbance including hypocalcemia can lead to disturbed transmission of electrical impulses in car-diomyocytes [2]. These conduction problems in the uremic heart may lead to delayed atrial and ventricular depolariza-tion and subsequently prolonged P wave and QRS complex durations on surface electrocardiography (ECG).
Interatrial block (IAB) is defined as a delayed or blocked electrical conduction between the right and left atrium
* Macit Kalçık
macitkalcik@yahoo.com
1 Department of Cardiology, Faculty of Medicine, Hitit
University, Buharaevler Mah. Buhara 25. Sok. No:1/A Daire:22, Çorum, Turkey
2 Department of Nephrology, Faculty of Medicine, Hitit
University, Çorum, Turkey
3 Department of Cardiology, Muğla Sıtkı Koçman University
and is manifested as a P wave duration of ≥ 120 ms on the surface ECG [5]. The interest in this topic has increased in recent years, and a large number of studies have been recently published regarding the prevalence of IAB and its associations with ischemic stroke and supraventricular arrhythmias including atrial fibrillation [6–10]. Atrial dila-tation and fibrosis are considered as the major contributors to the underlying pathophysiological mechanisms of IAB through altering the structural and electrical properties of cardiac myocytes [11, 12]. Left ventricular hypertrophy, myocardial ischemia, and conduction system disturbances have been reported to be common cardiovascular complica-tions in patients with CKD [13, 14]. Previously, increased P wave duration and IAB were reported in patients with CKD as compared to healthy controls [15]. However, echocardio-graphic predictors of IAB in CKD patients have not been investigated yet.
In this study, we hypothesized that the presence of IAB may be related with echocardiographic parameters in patients with CKD. Thus, we aimed to investigate echocar-diographic predictors of IAB in patients with severe CKD.
Methods
Study population
This single-center study enrolled a total of 155 patients (male: 95, mean age: 56.3 ± 12.8 years) with severe CKD (glomerular filtration rate < 30 mL/min). Patients who were diagnosed with coronary artery disease, history of myocar-dial infarction, left ventricular dysfunction (left ventricu-lar ejection fraction < 50%), moderate to severe heart valve disease, cardiomyopathy, arrhythmia, high degree atrioven-tricular block, complete bundle branch block, active infec-tion, connective tissue disease and liver or thyroid dysfunc-tion were excluded from the study. All patients underwent transthoracic echocardiography (TTE) and 12-lead high-resolution surface ECG. The study population was divided into two groups according the presence of IAB on ECG. All demographic, electrocardiographic, and echocardiographic parameters were recorded into a dataset and compared between CKD patients with and without IAB. All patients provided a written informed consent and the study protocol was approved by the local ethics committee of the hospital in accordance with the Declaration of Helsinki and Good Clinical Practice guidelines.
Echocardiography
All patients underwent TTE performed by two experienced cardiologists using Vivid 5 echocardiography device (GE Vingmed Ultrasound AS, Horten, Norway), and 3.2 mHz
adult probe with the patient in the left lateral decubitus position. In all patients, left atrial diameter (LAD), inter-ventricular septal thickness (IVST), posterior wall thick-ness (PWT), left ventricular end-systolic (LVESD), and end-diastolic diameters (LVEDD) were measured on the parasternal long-axis view. Left ventricular ejection frac-tions (LVEF) of the patients were calculated using biplane Simpson’s method. Left ventricular mass (LVM) was cal-culated based on Devereux formula [LVM = 0.8 (1.04 (IV ST + LVEDD + PWT)3 − (LVEDD)3) + 0.6], and body
sur-face area was estimated using Mosteller formula [body surface area = (height (cm) × body weight (kg)/3600)1/2].
Left ventricular mass was divided by body surface area to estimate left ventricular mass index (LVMI).
Electrocardiographic analysis
A 12-lead high-resolution ECG, which was recorded at a speed of 25 mm/s and a voltage of 10 mm/mV, was obtained from all patients after a 10-min rest (Nihon Kohden Cardiofax ECG-9132). Patients were allowed to breathe freely but not to speak or cough during recordings. All ECG papers were scanned, loaded to a computer, mag-nified sufficiently, and analyzed with a digital image pro-cessing software (imagej. nih.gov/ij/). Measurements were calibrated on the underlying standard ECG graph paper. All measurements were calculated by two independent car-diologists blinded to other patients’ clinical information. The onset and the end of the P-waves were marked with the cursor on a high-resolution computer screen to calcu-late P-wave duration in all leads. The beginning of the P wave was defined as the point where the initial deflection of the P wave crossed the isoelectric line, and the end of the P wave was defined as the point where the final deflec-tion of the P wave crossed the isoelectric line. Presence of IAB was defined as P wave duration of ≥ 120 ms on ECG. P wave dispersion was defined as the difference between the widest and the narrowest P wave duration recorded from the 12 ECG leads. The PR interval was defined as the period that extends from the beginning of the P wave until the beginning of the QRS complex. The QRS dura-tion was defined as the interval from the start of the QRS complex until J point. QT interval was defined as the inter-val from the onset of the QRS complex to the end of the T wave. The R-R interval was measured and used to compute the heart rate and to correct QT interval (QTc) with the Bazett’s Formula. (QTc = QT/√R-R interval in seconds). All durations were calculated in milliseconds and the mean values were calculated from 12 ECG leads. In patients on hemodialysis, ECG was recorded just before a midweek hemodialysis.
Laboratory analysis
To perform complete blood count and blood chemistry panel, venous blood samples were collected after 12-h of fasting by a clean puncture of an antecubital vein from all patients. Complete blood countings were measured on Sys-mex XT2000i analyzer (SysSys-mex Corporation, Kobe, Japan). Fasting blood glucose, blood urea nitrogen, creatinine, sodium, potassium, calcium, phosphorus, uric acid, total protein, alanine aminotransferase, aspartate aminotrans-ferase, total cholesterol (TC), high-density lipoprotein (HDL), and triglyceride (TG) levels were also measured on an autoanalyzer (Siemens Advia 2400 Chemistry System, Siemens Diagnostic, Tarrytown, USA). Low-density lipo-protein (LDL), was calculated using the Friedewald formula [LDL (mg/dL) = TC − (HDL + TG/5)] [16]. The glomerular filtration rate was calculated as a function of age, serum creatinine, and race using the simplified modified diet in renal disease (MDRD) equation [17].
Statistical analysis
Statistical analyses were performed using IBM SPSS Statis-tics for Windows, Version 19.0. (IBM Corp. Armonk, NY). Descriptive statistics were reported as mean ± standard devi-ation for continuous variables with normal distribution or median (25th–75th percentiles) values for continuous vari-ables without normal distribution and as frequency with per-centages for the categorical variables. The Shapiro–Wilk and Kolmogorov–Smirnov tests were used to test the normality of the distribution of continuous variables. Categorical vari-ables were compared with chi-square or Fisher exact tests. Student t test or Mann–Whitney U test was used to compare continuous variables as appropriate. The significance level was accepted as p < 0.05 in all statistical analyses. A logistic regression analysis was performed to identify any independ-ent echocardiographic associates of IAB. A receiver oper-ating characteristic (ROC) curve analysis was performed to evaluate the sensitivity, specificity, area under the curve (AUC), and confidence interval (CI) of parameters for pre-dicting IAB. Bland Altman analysis (MedCalc software for Windows) was used to compare ROC curve analysis results for LAD and LVMI. Intra and inter observer agreement was assessed using Cohen’s kappa test. The mean inter and intra observer agreement was 91% and 94% respectively.
Results
The ECG revealed IAB in 54 patients and the study popula-tion was divided into two groups as patients with IAB (mean age: 57.7 ± 14.1 years, male: 36) and patients without IAB (mean age: 55.6 ± 12.1 years, male: 59). Comparison of
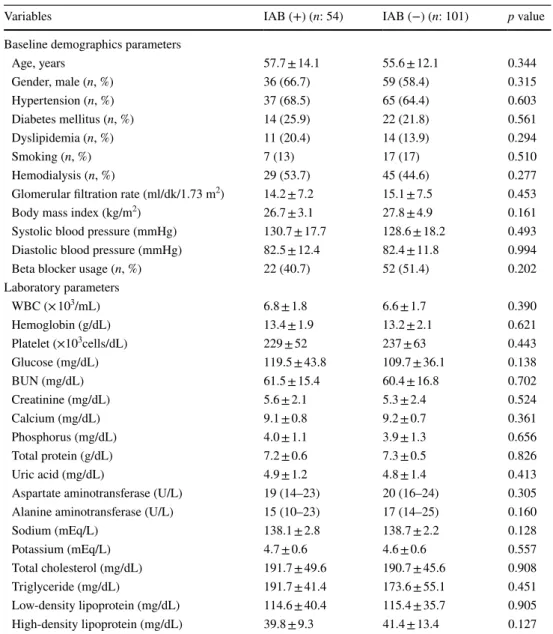
the clinical, demographical, and laboratory characteristics between CKD patients with and without IAB was presented in Table 1. Age and gender distribution were similar between groups. There was also no significant difference in terms of body mass index, systolic and diastolic blood pressures, glo-merular filtration rate, the frequencies of diabetes mellitus, hypertension, dyslipidemia, smoking, hemodialysis status, and beta blocker usage (Table 1).
Upon comparison of laboratory parameters between CKD patients with and without IAB, there was no significant dif-ference in terms of routine serum biomarkers such as fast-ing blood glucose, blood urea nitrogen, creatinine, sodium, potassium, calcium, phosphorus, uric acid, total protein, alanine aminotransferase, aspartate aminotransferase, total cholesterol, HDL, LDL, triglyceride, and complete blood count parameters including white blood cells, hemoglobin, and platelets (Table 1).
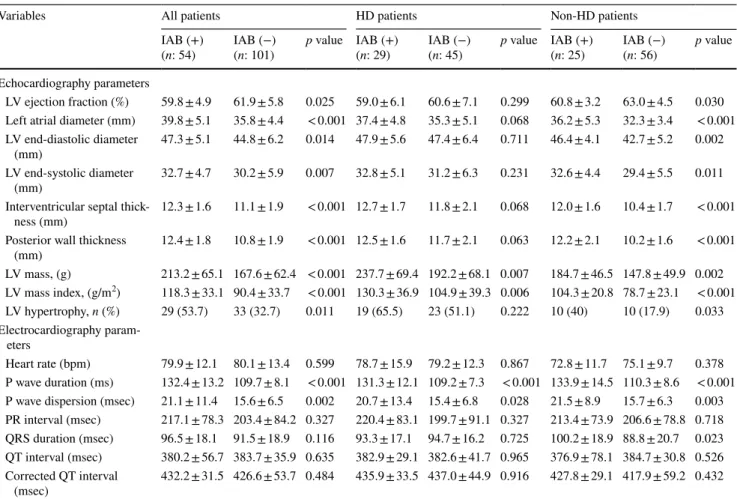
Comparison of the echocardiographic and electrocar-diographic parameters between CKD patients with and without IAB was presented in Table 2. Among echo-cardiographic parameters, only LVEF (59.8 ± 4.9 vs 61.9 ± 5.8%, p = 0.025) was significantly lower in patients with IAB. All other echocardiographic parameters includ-ing LVESD (32.7 ± 4.7 vs 30.2 ± 5.9 mm, p = 0.007), LVEDD (47.3 ± 5.1 vs 44.8 ± 6.2 mm, p = 0.014), LAD (39.8 ± 5.1 vs 35.8 ± 4.4 mm, p < 0.001) (Fig. 1a), IVST (12.3 ± 1.6 vs 11.1 ± 1.9 mm, p < 0.001), PWT (12.4 ± 1.8 vs 10.8 ± 1.9 mm, p < 0.001), LVM (213.2 ± 65.1 vs 167.6 ± 62.4 g, p < 0.001), LVMI (118.3 ± 33.1 vs 90.4 ± 33.7 g/m2, p < 0.001) (Fig. 2a) and the prevalence of
LVH (53.7 vs 32.7%, p = 0.011) were significantly higher in patients with IAB (Table 2).
Comparison of electrocardiographic parameters yielded that there was no significant difference in terms of heart rate (79.9 ± 12.1 vs 80.1 ± 13.4 bpm, p = 0.599), PR inter-val (217.1 ± 78.3 vs 203.4 ± 84.2 ms, p = 0.327), QRS duration (96.5 ± 18.1 vs 91.5 ± 18.9 ms, p = 0.116), QT interval (380.2 ± 56.7 vs 383.7 ± 35.9 ms, p = 0.635) and calculated QTc (432.2 ± 31.5 vs 426.6 ± 53.7 ms, p = 0.484) between the groups. However, P wave duration (132.4 ± 13.2 vs 109.7 ± 8.1 ms, p < 0.001) and P wave dispersion (21.1 ± 11.4 vs 15.6 ± 6.5 ms, p = 0.002) were significantly higher in patients with IAB (Table 2). Since hemodialysis may effect electrocardiographic parameters via factors such as volume overload, rapid changes in electrolytes, patients were divided into two groups as “hemodialysis patients” and “non-hemodialysis patients”. All comparisons were repeated in these separate groups and the results were presented in Table 2.
The univariate associates of IAB were taken into multi-ple logistic regression analysis. Increased LAD (OR = 1.119; 95% CI 1.019–1.228; p = 0.019) and LVMI (OR = 1.036; 95% CI 1.003–1.070; p = 0.031) were identified as
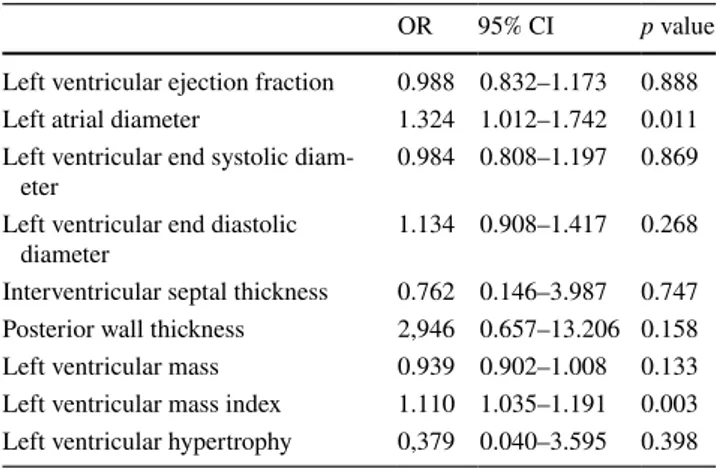
independent predictors of IAB (Table 3). Among hemodi-alysis patients, multiple logistic regression anhemodi-alysis could not determine an independent predictor for IAB (Table 4). Whereas, in non-hemodialysis patient group, LAD (OR = 1.324; 95% CI 1.012–1.742; p = 0.011) and LVMI (OR = 1.110; 95% CI 1.035–1.191; p = 0.003) were again identified as independent predictors of IAB (Table 5).
In the ROC curve analysis, LAD higher than 35 mm pre-dicted the presence of IAB with a sensitivity of 75% and a specificity of 65% (AUC: 0.750; 95% CI 0.669–0.831;
p < 0.001) (Fig. 1b), LVMI higher than 104.5 g/m2 predicted
the presence of IAB with a sensitivity of 74% and a specific-ity of 72% (AUC: 0.741; 95% CI 0.662–0.819; p < 0.001) (Fig. 2b). When compared with Bland–Altman analysis, there was no significant difference between the AUCs of
ROC curves for LAD and LVMI (z = 1.32; p = 0.146) (Fig. 3).
Correlation analyses were performed between electrocar-diographic and echocarelectrocar-diographic parameters. There was a significant and moderate positive correlation between P wave duration and LAD (r = 0.567, p < 0.001) (Fig. 4a) and also a significant and moderate positive correlation between P wave duration and LVMI (r = 0.517, p < 0.001) (Fig. 4b).
Discussion
In this case–control study, we have focused on the relation-ship between the presence of IAB and echocardiographic parameters in patients with severe CKD. Echocardiographic
Table 1 Comparison of the clinical, demographic, and laboratory characteristics of the patients with and without interatrial block
BUN blood urea nitrogen, IAB interatrial block, WBC white blood cell [continuous variables with normal distribution were expressed as mean ± standard deviation and continuous variables without normal distribu-tion were expressed as median (25th–75th percentiles)]
Variables IAB (+) (n: 54) IAB (−) (n: 101) p value
Baseline demographics parameters
Age, years 57.7 ± 14.1 55.6 ± 12.1 0.344 Gender, male (n, %) 36 (66.7) 59 (58.4) 0.315 Hypertension (n, %) 37 (68.5) 65 (64.4) 0.603 Diabetes mellitus (n, %) 14 (25.9) 22 (21.8) 0.561 Dyslipidemia (n, %) 11 (20.4) 14 (13.9) 0.294 Smoking (n, %) 7 (13) 17 (17) 0.510 Hemodialysis (n, %) 29 (53.7) 45 (44.6) 0.277
Glomerular filtration rate (ml/dk/1.73 m2) 14.2 ± 7.2 15.1 ± 7.5 0.453
Body mass index (kg/m2) 26.7 ± 3.1 27.8 ± 4.9 0.161
Systolic blood pressure (mmHg) 130.7 ± 17.7 128.6 ± 18.2 0.493
Diastolic blood pressure (mmHg) 82.5 ± 12.4 82.4 ± 11.8 0.994
Beta blocker usage (n, %) 22 (40.7) 52 (51.4) 0.202
Laboratory parameters WBC (× 103/mL) 6.8 ± 1.8 6.6 ± 1.7 0.390 Hemoglobin (g/dL) 13.4 ± 1.9 13.2 ± 2.1 0.621 Platelet (×103cells/dL) 229 ± 52 237 ± 63 0.443 Glucose (mg/dL) 119.5 ± 43.8 109.7 ± 36.1 0.138 BUN (mg/dL) 61.5 ± 15.4 60.4 ± 16.8 0.702 Creatinine (mg/dL) 5.6 ± 2.1 5.3 ± 2.4 0.524 Calcium (mg/dL) 9.1 ± 0.8 9.2 ± 0.7 0.361 Phosphorus (mg/dL) 4.0 ± 1.1 3.9 ± 1.3 0.656 Total protein (g/dL) 7.2 ± 0.6 7.3 ± 0.5 0.826 Uric acid (mg/dL) 4.9 ± 1.2 4.8 ± 1.4 0.413
Aspartate aminotransferase (U/L) 19 (14–23) 20 (16–24) 0.305
Alanine aminotransferase (U/L) 15 (10–23) 17 (14–25) 0.160
Sodium (mEq/L) 138.1 ± 2.8 138.7 ± 2.2 0.128 Potassium (mEq/L) 4.7 ± 0.6 4.6 ± 0.6 0.557 Total cholesterol (mg/dL) 191.7 ± 49.6 190.7 ± 45.6 0.908 Triglyceride (mg/dL) 191.7 ± 41.4 173.6 ± 55.1 0.451 Low-density lipoprotein (mg/dL) 114.6 ± 40.4 115.4 ± 35.7 0.905 High-density lipoprotein (mg/dL) 39.8 ± 9.3 41.4 ± 13.4 0.127
Table 2 Comparison of the echocardiographic and electrocardiographic parameters of the patients with and without interatrial block
BUN blood urea nitrogen, IAB interatrial block, HD hemodialysis, LV left ventricle, WBC white blood cell [continuous variables with normal distribution were expressed as mean ± standard deviation and continuous variables without normal distribution were expressed as median (25th– 75th percentiles)]
Variables All patients HD patients Non-HD patients
IAB (+)
(n: 54) IAB (−)(n: 101) p value IAB (+)(n: 29) IAB (−)(n: 45) p value IAB (+)(n: 25) IAB (−)(n: 56) p value Echocardiography parameters
LV ejection fraction (%) 59.8 ± 4.9 61.9 ± 5.8 0.025 59.0 ± 6.1 60.6 ± 7.1 0.299 60.8 ± 3.2 63.0 ± 4.5 0.030 Left atrial diameter (mm) 39.8 ± 5.1 35.8 ± 4.4 < 0.001 37.4 ± 4.8 35.3 ± 5.1 0.068 36.2 ± 5.3 32.3 ± 3.4 < 0.001 LV end-diastolic diameter
(mm) 47.3 ± 5.1 44.8 ± 6.2 0.014 47.9 ± 5.6 47.4 ± 6.4 0.711 46.4 ± 4.1 42.7 ± 5.2 0.002 LV end-systolic diameter
(mm) 32.7 ± 4.7 30.2 ± 5.9 0.007 32.8 ± 5.1 31.2 ± 6.3 0.231 32.6 ± 4.4 29.4 ± 5.5 0.011 Interventricular septal
thick-ness (mm) 12.3 ± 1.6 11.1 ± 1.9 < 0.001 12.7 ± 1.7 11.8 ± 2.1 0.068 12.0 ± 1.6 10.4 ± 1.7 < 0.001 Posterior wall thickness
(mm) 12.4 ± 1.8 10.8 ± 1.9 < 0.001 12.5 ± 1.6 11.7 ± 2.1 0.063 12.2 ± 2.1 10.2 ± 1.6 < 0.001 LV mass, (g) 213.2 ± 65.1 167.6 ± 62.4 < 0.001 237.7 ± 69.4 192.2 ± 68.1 0.007 184.7 ± 46.5 147.8 ± 49.9 0.002 LV mass index, (g/m2) 118.3 ± 33.1 90.4 ± 33.7 < 0.001 130.3 ± 36.9 104.9 ± 39.3 0.006 104.3 ± 20.8 78.7 ± 23.1 < 0.001 LV hypertrophy, n (%) 29 (53.7) 33 (32.7) 0.011 19 (65.5) 23 (51.1) 0.222 10 (40) 10 (17.9) 0.033 Electrocardiography param-eters Heart rate (bpm) 79.9 ± 12.1 80.1 ± 13.4 0.599 78.7 ± 15.9 79.2 ± 12.3 0.867 72.8 ± 11.7 75.1 ± 9.7 0.378 P wave duration (ms) 132.4 ± 13.2 109.7 ± 8.1 < 0.001 131.3 ± 12.1 109.2 ± 7.3 < 0.001 133.9 ± 14.5 110.3 ± 8.6 < 0.001 P wave dispersion (msec) 21.1 ± 11.4 15.6 ± 6.5 0.002 20.7 ± 13.4 15.4 ± 6.8 0.028 21.5 ± 8.9 15.7 ± 6.3 0.003 PR interval (msec) 217.1 ± 78.3 203.4 ± 84.2 0.327 220.4 ± 83.1 199.7 ± 91.1 0.327 213.4 ± 73.9 206.6 ± 78.8 0.718 QRS duration (msec) 96.5 ± 18.1 91.5 ± 18.9 0.116 93.3 ± 17.1 94.7 ± 16.2 0.725 100.2 ± 18.9 88.8 ± 20.7 0.023 QT interval (msec) 380.2 ± 56.7 383.7 ± 35.9 0.635 382.9 ± 29.1 382.6 ± 41.7 0.965 376.9 ± 78.1 384.7 ± 30.8 0.526 Corrected QT interval
(msec) 432.2 ± 31.5 426.6 ± 53.7 0.484 435.9 ± 33.5 437.0 ± 44.9 0.916 427.8 ± 29.1 417.9 ± 59.2 0.432
Fig. 1 The box-plot graph comparing the left atrial diameters between patients with and without IAB (a). Receiver operating char-acteristic curve revealing the AUC for left atrial diameter to predict
the presence of IAB (AUC area under the curve, CI confidence inter-val, IAB interatrial block)
parameters related to left ventricular hypertrophy and left atrial dilatation have been found to be significantly increased in CKD patients with IAB. Furthermore, increased LAD and LVMI were identified as independent predictors of IAB in these patients.
The incidence of cardiovascular diseases and deaths from cardiovascular events have been reported to be increased in CKD patients as compared to the general population [18]. It was reported previously that, majority of adult patients have cardiovascular diseases diagnosed at the time of CKD onset, and approximately half of deaths are attributed to cardiovas-cular events [19]. In addition to the traditional risk factors such as hypertension, dyslipidemia, and diabetes mellitus, non-traditional risk factors such as anemia [20], overhydra-tion [21], endothelial dysfunction [22], hypocalcemia [23] and hyperparathyroidism [24] have been accused in the pathophysiological mechanisms of cardiovascular compli-cations in these patients.
Left ventricular hypertrophy is a common pathology in patients with CKD. Cardiac hypertrophy is a response of the myocardium to increased workload. Initial cardiac
Fig. 2 The box-plot graph comparing the left ventricular mass index values between patients with and without IAB (a). Receiver operating characteristic curve revealing the AUC for left ventricular mass index
to predict the presence of IAB (AUC area under the curve, CI confi-dence interval, IAB interatrial block)
Table 3 Multivariate regression analysis showing independent pre-dictors of interatrial block
CI confidence interval; OR odds ratio
OR 95% CI p value
Left ventricular ejection fraction 0.983 0.912–1.060 0.657 Left atrial diameter 1.119 1.019–1.228 0.019 Left ventricular end systolic diameter 1.036 0.939–1.143 0.477 Left ventricular end diastolic diameter 0.977 0.877–1.089 0.674 Interventricular septal thickness 0.731 0.328–1.629 0.444 Posterior wall thickness 1.769 0.825–3.792 0.143 Left ventricular mass 0.988 0.970–1.006 0.198 Left ventricular mass index 1.036 1.003–1.070 0.031 Left ventricular hypertrophy 1.359 0.448–4.124 0.589
Table 4 Multivariate regression analysis results in hemodialysis patients
CI confidence interval; OR odds ratio
OR 95% CI p value
Left atrial diameter 1.035 0.926–1.158 0.543 Interventricular septal thickness 1.078 0.450–2.582 0.867 Posterior wall thickness 0.963 0.382–2.426 0.936 Left ventricular mass 1.004 0.984–1.023 0.719 Left ventricular mass index 1.008 0.977–1.041 0.605
Table 5 Multivariate regression analysis results in non-hemodialysis patients
CI confidence interval; OR odds ratio
OR 95% CI p value
Left ventricular ejection fraction 0.988 0.832–1.173 0.888 Left atrial diameter 1.324 1.012–1.742 0.011 Left ventricular end systolic
diam-eter 0.984 0.808–1.197 0.869
Left ventricular end diastolic
diameter 1.134 0.908–1.417 0.268
Interventricular septal thickness 0.762 0.146–3.987 0.747 Posterior wall thickness 2,946 0.657–13.206 0.158 Left ventricular mass 0.939 0.902–1.008 0.133 Left ventricular mass index 1.110 1.035–1.191 0.003 Left ventricular hypertrophy 0,379 0.040–3.595 0.398
hypertrophy constitutes an adaptive mechanism, but pro-longed and severe hypertrophy is a risk factor for arrhyth-mias, sudden death, and heart failure [25]. CKD patients with left ventricular hypertrophy have an increased risk of cardiovascular events and, specifically, an increased risk of sudden cardiac death [26–28]. There is also evidence for that concentric remodeling of the left ventricle may increase
cardiovascular risk [29]. Increased accumulation of collagen due to left ventricular hypertrophy may result in myocardial fibrosis and decreased cardiac reserve. Thus, cardiac con-duction disorders may occur [30].
ECG is a simple, non-invasive, and readily available tool in daily routine practice. IAB, which is a newly introduced ECG parameter, is defined as the prolongation of the conduc-tion time between the right and left atrium due to an impulse delay or blockage most often in the Bachmann’s bundle. Several previous studies reported that IAB is related with the development of new-onset atrial fibrillation in patients with coronary artery disease and peripheral vascular disease [31, 32]. Moreover, a significant relationship has been reported between the presence of IAB and ischemic stroke [9, 10]. In a previous study, high prevalence of IAB was reported in patients with end-stage renal disease [15]. However, echo-cardiographic determinants of IAB have never been investi-gated in these patients.
In this study, presence of IAB has been associated with increased LVMI which is an objective measure of left ven-tricular hypertrophy. Left venven-tricular hypertrophy may cause a decrease in left ventricular compliance with increased left ventricular end-diastolic pressure and left atrial pressure, thus, may increase the duration of the P wave in patients with CKD [33]. Since left ventricular hypertrophy has been associated with increased morbidity and mortality in these patients, presence of IAB on surface ECG may be an additional and easy diagnostic tool for risk stratification of patients with CKD. Those with IAB may be particularly at risk for cardiovascular complications. ECG is a cheap and easy assessable diagnostic tool and can be also interpreted
Fig. 3 Comparison of receiver operating characteristic curves of left atrial diameter and left ventricular mass index for predicting the pres-ence of interatrial block
Fig. 4 The scatter plot graphs revealing the moderate positive correlation between P wave duration and left atrial diameter (a), and also between P wave duration and left ventricular mass index (b)
by nephrologists. Since the presence of IAB has been associ-ated with increased LVMI which is a well-known marker of cardiovascular risk, the nephrologists may refer the patient to the cardiologists for echocardiographic evaluation when they detected IAB on ECG.
The presence of IAB has been also associated with increased LAD in the present study. Volume overload and coronary artery disease causing ischemia may be etiologi-cal factors for left atrial dilatation in patients with CKD. Myocardial ischemia may cause a decrease in left ventricu-lar compliance, resulting in an increase in left ventricuventricu-lar end-diastolic pressure and left atrial pressure. The increase in left atrial pressure leads to an increase in left atrial size. The increase in the size of the left atrium also prolongs the P wave duration [34]. During atrial remodeling, atrial dilata-tion, and fibrosis alters the structural and electrical proper-ties of cardiac myocytes and may be considered as the major contributors to the underlying pathophysiological mecha-nisms of IAB [11, 12].
Secondary hyperparathyroidism is an inevitable compo-nent of CKD and serves as a significant causative factor for both structural changes in the heart and conduction prob-lems in transmitting electrical impulses [35]. Serum cal-cium–phosphate imbalance in patients with CKD may affect the metabolism of individual tissues and cells. Considerable intracellular calcium ion accumulation in various organs may lead to different clinical dysfunctions in the course of CKD [36]. It is commonly accepted that hypocalcemia can lead to defective muscle contractions and disturbed trans-mission of electrical impulses in cardiomyocytes [37]. The reason for that conduction failure is probably related to the fact that calcium depletion compromises the membrane cal-cium channel activity and the inward flow of calcal-cium ions to cardiomyocytes, which is necessary for action potential and proper depolarization progress in the heart [38]. The above-mentioned calcium-phosphate metabolism disorders could be considered as the pathomechanisms underlying the presence of IAB in patients with CKD. However, there was no significant difference in terms of electrolyte levels between CKD patients with and without IAB in our study. Furthermore, many patients, especially those who are more vulnerable to cardiovascular diseases such as the elderly and the diabetics, frequently suffer from adynamic bone disease [39].
Study limitations
The primary limitation was that our study was a nonrand-omized and single-center study with a relatively small num-ber of patients. Unfortunately, the design of this case–control study was not prospective and therefore lacks data regarding
the follow up of the patients. Also, pre-study ECG charac-teristics of the study population were unknown.
Conclusion
The present study demonstrated that there was a significant relationship between the presence of IAB and echocardio-graphic parameters related to left ventricular hypertrophy and left atrial dilatation in patients with severe CKD. Espe-cially, increased LAD and LVMI were strongly associated with the presence of IAB in these patients. Since left ven-tricular hypertrophy has been associated with increased morbidity and mortality, the presence of IAB may be an additional and easy diagnostic marker for risk stratification of patients with severe CKD. Those with IAB on ECG may be particularly at risk for cardiovascular complications.
Author contributions All of the authors contributed planning, conduct,
and reporting of the work. All authors had full access to all data in the study and take responsibility for the integrity of the data and the accuracy of the data analysis.
Funding No financial funding was received for this study. Compliance with ethical standards
Conflict of interest All of the authors have no conflict of interest.
References
1. Parekh RS, Carroll CE, Wolfe RA, Port FK (2002) Cardiovascu-lar mortality in children and young adults with end-stage kidney disease. J Pediatr 141:191–197
2. Saeed F, Arrigain S, Schold JD, Nally JV Jr, Navaneethan SD (2019) What are the risk factors for one-year mortality in older patients with chronic kidney disease? An analysis of the cleveland clinic CKD registry. Nephron 141(2):98–104
3. Wang AY (2007) Cardiovascular risk factors in peritoneal dialysis patients revisited. Perit Dial Int 27(Suppl 2):S223–S227 4. García-López E, Carrero JJ, Suliman ME, Lindholm B, Stenvinkel
P (2007) Risk factors for cardiovascular disease in patients under-going peritoneal dialysis. Perit Dial Int 27(Suppl 2):S205–S209 5. Bayés de Luna A, Platonov P, Cosio FG et al (2012) Interatrial
blocks. A separate entity from left atrial enlargement: a consensus report. J Electrocardiol 45:445–451
6. Conde D, Seoane L, Gysel M et al (2015) Bayés’ syndrome: the association between interatrial block and supraventricular arrhyth-mias. Expert Rev Cardiovasc Ther 13:541–550
7. Nielsen JB, Kühl JT, Pietersen A et al (2015) P-wave duration and the risk of atrial fibrillation: results from the Copenhagen ECG study. Heart Rhythm 12:1887–1895
8. O’Neal WT, Zhang ZM, Loehr LR et al (2016) Electrocardio-graphic advanced inter-atrial block and atrial fibrillation risk in the general population. Am J Cardiol 117:1755–1759
9. Martínez-Sellés M, Robledo LA, Baranchuk A (2017) Intera-trial block and the risk of ischemic stroke. J Atheroscler Thromb 24(2):185–186
10. O’Neal WT, Kamel H, Zhang ZM et al (2016) Advanced intera-trial block and ischemic stroke: the atherosclerosis risk in com-munities study. Neurology 87:352–356
11. Ariyarajah V, Kranis M, Apiyasawat S, Spodick DH (2007) Poten-tial factors that affect electrocardiographic progression of intera-trial block. Ann Noninvasive Electrocardiol 12(1):21–26 12. Pang H, Ronderos R, Pérez-Riera AR, Femenía F, Baranchuk A
(2011) Reverse atrial electrical remodeling: a systematic review. Cardiol J 18(6):625–631
13. Scharer K, Schmidt KG, Soergel M (1999) Cardiac function and structure in patients with chronic renal failure. Pediatr Nephrol 13:951–965
14. McCullough PA, Assad H (2012) Diagnosis of cardiovascular disease in patients with chronic kidney disease. Blood Purif 33:112–118
15. Solak Y, Gul EE, Kayrak M et al (2013) Electrocardiographic P-wave characteristics in patients with end-stage renal disease: P-index and interatrial block. Int Urol Nephrol 45(2):511–517 16. Friedewald WT, Levy RI, Fredrickson DS (1972) Estimation
of the concentration of low-density lipoprotein cholesterol in plasma, without use of the preparative ultracentrifuge. Clin Chem 18(6):499–502
17. Levey AS, Bosch JP, Lewis JB, Greene T, Rogers N, Roth D (1999) A more accurate method to estimate glomerular filtration rate from serum creatinine: a new prediction equation. Modi-fication of diet in renal disease study group. Ann Intern Med 130(6):461–470
18. Go AS, Chertow GM, Fan D, McCulloch CE, Hsu CY (2004) Chronic kidney disease and the risks of death, cardiovascular events, and hospitalization. N Engl J Med 351:1296–1305 19. Saran R, Robinson B, Abbott KC et al (2017) US Renal Data
System 2016 annual data report: epidemiology of kidney disease in the United States. Am J Kidney Dis 69(3 Suppl 1):A7–A8 20. Eckardt KU (1999) Cardiovascular consequences of renal
anaemia and erythropoietin therapy. Nephrol Dial Transplant 14:1317–1323
21. Juan-Garcia I, Puchades MJ, Sanjuan R et al (2012) Echocardio-graphic impact of hydration status in dialysis patients. Nefrologia 32:94–102
22. Poulikakos D, Ross L, Recio-Mayoral A et al (2014) Left ven-tricular hypertrophy and endothelial dysfunction in chronic kidney disease. Eur Heart J Cardiovasc Imaging 15:56–61
23. Ky B, Shults J, Keane MG et al (2013) FGF23 modifies the rela-tionship between vitamin D and cardiac remodeling. Circ Heart Fail 6:817–824
24. London GM, Fabiani F, Marchais SJ et al (1987) Uremic cardio-myopathy: an inadequate left ventricular hypertrophy. Kidney Int 31:973–980
25. Berk BC, Fujiwara K, Lehoux S (2007) ECM remodeling in hypertensive heart disease. J Clin Invest 117:568–575
26. Paoletti E, De Nicola L, Gabbai FB et al (2016) Associations of left ventricular hypertrophy and geometry with adverse outcomes in patients with CKD and hypertension. Clin J Am Soc Nephrol 11:271–279
27. Eckardt KU, Scherhag A, Macdougall IC et al (2009) Left ven-tricular geometry predicts cardiovascular outcomes associated with anemia correction in CKD. J Am Soc Nephrol 20:2651–2660 28. Paoletti E, Specchia C, Di Maio G et al (2004) The worsening of left ventricular hypertrophy is the strongest predictor of sudden cardiac death in haemodialysis patients: a 10 year survey. Nephrol Dial Transplant 19:1829–1834
29. Tsao CW, Gona PN, Salton CJ et al (2015) Left ventricular struc-ture and risk of cardiovascular events: a Framingham Heart Study cardiac magnetic resonance study. J Am Heart Assoc 4:e002188 30. Kahan T, Bergfeldt L (2005) Left ventricular hypertrophy in
hypertension: its arrhythmogenic potential. Heart 91:250–256 31. Alexander B, Baranchuk A, Haseeb S et al (2018) Interatrial block
predicts atrial fibrillation in patients with carotid and coronary artery disease. J Thorac Dis 10:4328–4334
32. Çinier G, Tekkeşin Aİ, Genç D et al (2018) Interatrial block as a predictor of atrial fibrillation in patients with ST-segment eleva-tion myocardial infarceleva-tion. Clin Cardiol 41:1232–1237
33. Boles U, Almuntaser I, Brown A, Murphy RR, Mahmud A, Feely J (2010) Ventricular activation time as a marker for diastolic dys-function in early hypertension. Am J Hypertens 23(7):781–785 34. Sigwart U, Grbic M, Goy JJ, Kappenberger L (1990) Left atrial
function in acute transient left ventricular ischemia produced dur-ing percutaneous transluminal coronary angioplasty of the left anterior descending coronary artery. Am J Cardiol 65:282–286 35. Rodriguez M, Lorenzo V (2009) Progress in uremic toxin
research: parathyroid hormone, a uremic toxin. Semin Dial 22:363–368
36. Mitsnefes MM, Kimball TR, Kartal J et al (2005) Cardiac and vascular adaptation in pediatric patients with chronic kidney dis-ease: role of calcium-phosphorus metabolism. J Am Soc Nephrol 16:2796–2803
37. Jono S, Nishizawa Y, Shioi A, Morii H (1997) Parathyroid hormone related peptide as a regulator of vascular calcifica-tion. Its inhibitory action on in vitro calcification by bovine vascular smooth muscle cells. Arterioscler Thromb Vasc Biol 17:1135–1142
38. Lipscombe D (2002) L-type calcium channels. High and new lows. Circ Res 90:933–935
39. Nitta K, Yajima A, Tsuchiya K (2017) Management of osteopo-rosis in chronic kidney disease. Intern Med 56(24):3271–3276
Publisher’s Note Springer Nature remains neutral with regard to jurisdictional claims in published maps and institutional affiliations.