INTRODUCTION
The term culture industry was first used by Adorno and Horkheimer (2002) in order to describe the mass production of cultural goods such as films, music, radio programs, and so on with an emphasis on the deterioration of the philosophical role of culture. Nevertheless, the scope and the usage of the term has evolved over time, and nowadays it covers all creative and media industries with a diversified focus. In this context, the concept of culture or creative cluster has also become an attractive approach in the literature, and consequently, a policy tool. Employment of certain measures such as concentration indexes (particularly LQ-Location Quotient) are widespread in the literature for the identification of the clusters (Boix et al., 2015). However, many central conceptual and theoretical questions are still unanswered regarding the extent and evolution of the clusters concerned.
In this context, the question addressed in this study is related to the evolution of a culture or creative industry cluster, Turkish movie cluster in Istanbul. The film industry in Turkey is historically agglomerated in Istanbul. In the database of Social Security Institution (SSI), the data for film industry is available under the sector category of production and distribution of cinema films and sound recording. According to the most recent statistics of SSI in relation to the work place and insured person (SGK, 2020), in 2018 74.54% of the employees in Turkey under this sector category lives in Istanbul. Although the share of these employees in the total number of employees in Istanbul is 0.32%, when compared with the share of this sector’s employees in the total number of employees in Turkey, the sector in 2018 has a LQ value of 2.62 in Istanbul. All these in turn indicate that in Istanbul there is a strong film industry characterized by the agglomeration of the agents involved in the production and distribution of movies.
Turkish film industry has particularly experienced a partial revival in the last decade. Although it is generally acknowledged that this revival
EVOLUTION OF TURKISH MOVIE CLUSTER:
A SOCIAL NETWORK ANALYSIS PERSPECTIVE
Burak BEYHAN*, Hakan ERKILIÇ**Received: 04.06.2020; Final Text: 09.11.2020 Keywords: Movie cluster; film industry; social network analysis; innovation; Istanbul.
* Department of City and Regional Planning, Faculty of Architecture, Muğla Sıtkı Koçman University, Muğla, TURKEY.
** Department of Radio Film and Television, Faculty of Communication, Mersin University, Mersin, TURKEY.
is due to the introduction of some new agents into the industry during the last two decades, a network analysis of the transformation of the social structure of the industry is almost absent. The recent historical-geographical analysis of the film industry in Istanbul divulges that the new agents have been scattered to nearby locations to Yeşilçam in the city (Öztürk, 2009; Özkan, 2009; Özkan Töre, 2010; Öz and Özkaracalar, 2010; 2017; Töre and Enlil, 2014; Enlil et al., 2011; Dursun, 2014). Till the 1990s, Yeşilçam Street in Beyoğlu was the main location where the agents of the industry were agglomerated in the form of an active cluster. Particularly since the second half of the 1990s, many producers and distributors have been dispersed to the other locations in Beyoğlu, Levent and Şişli (Özkan, 2009; Özkan Töre, 2010; Öz and Özkaracalar, 2010; 2017; Töre and Enlil, 2014; Dursun, 2014).
Actually, as Özkan (2009) reveals and Enlil et al. (2011) remark, two opposing spatial tendencies can be observed in Istanbul for the film industry: first, the huge film studios and the technical equipment rental firms requiring large areas and the building of big sets are mainly located on the fringes of the city where the rental prices per m² for the industrial and storage areas are very low compared with prices in the city center; second, in contrast to this, bulk of the professional associations related to the sector, casting agencies, theatre management and distribution companies, and production companies are located in the central parts of the city. Overall, agglomeration of film industry in Istanbul has a set of clustering dynamics that can only be understood by explicating the value chain or more properly the value creating ecology in the film industry. A value chain can be defined as a set of activities organized for the creation and delivery of a product or service to customers (Porter, 1985). In film industry, it usually consists of stages of development, pre-production (also referred to as financing and pre-sales), production, post-production (also referred to as sales and licensing), distribution and exhibition (Eliashberg et al., 2006; Davies and Wistreich, 2007; Vang and Chaminade, 2007; Küng, 2008). Although this general model for the value chain in film industry is improved or reformulated in some recent studies for various segments of the film industry (Vitkauskaitė, 2017), there are also alternative approaches to value creation such as the one formulated by Hearn and Pace (2006), and Hearn et al. (2007) drawing on the concept of value creating ecology and questioning the concept of value chain because of its description of the relationships in the creative industries as a single linear process with one stage leading to the next in a static form.
In the alternative approach based on the concept of value creating ecology, the collection of firms in the ecology are energetic and value flow is both multi-directional and multi-level (in other words, operational via clusters of networks) (Hearn et al., 2007). The value creating ecology approach has parallels with a series of other concepts and metaphors that are very relevant in the creative and cultural clusters such as the metaphor of (social) atmosphere first recognized by Marshall (1964) in his description of agglomeration of industrial activities. Marshall (1964, 225) observes that, in these agglomerations, “[t]he mysteries of the trade become no mysteries; but are as it were in the air, and children learn many of them unconsciously”. As Scott (2006) remarks, the creative dimension of the clusters as industrial agglomerations can easily be described in terms of Marshallian atmospherics, “something in the air” which is in principle the collective property of all.
Another concept having root in Marshallian atmospherics and important in creative and cultural clusters is the concept of buzz which was first used by Storper and Venables (2004) for referring to the effect of face-to-face (F2F) contacts in the agglomeration of economic activities and agents vis-a-vis the increasing ability to transmit information over long distances without requiring F2F contacts. The concept is widely used in the subsequent studies (Bathelt et al., 2004) for the elaboration of the process of knowledge creation in clusters. One of the first studies for the elaboration of the buzz effect with particular reference to a cultural cluster, namely the Leipzig media industry cluster, can be found in Bathelt (2005) who argues that the knowledge dynamically created by the buzz (local interaction) and interaction via pipelines connecting local to global is crucial in the continued economic success of a cluster.
Actually, the concept of pipelines reveals the importance of networks operational between the locality home to the cluster and firms or
institutions from different parts of the world. Although conceptualization of cluster and network in this way casts them at seemingly opposite categories of production relations, it should be emphasized that cluster itself may rely on networks of local characters as revealed within the framework of value creating ecology, not on a value chain representing a linear and static process. While, as a network, establishment of a successful global pipeline necessitates the creation of a common institutional context allowing for joint problem-solving, learning and knowledge creation over time (Bathelt et al., 2004), it is important to remark that agents can participate in the buzz of cluster without any particular investment as information and communication available in the buzz is inevitably acquired by the agent located within the cluster through attending to the social and economic spheres (Bathelt, 2005).
Although, as remarked above, there are many studies on the movie cluster in Istanbul in terms of elaboration of its geographical extent and recent revival, inner working of the cluster in terms of Marshallian atmospherics and the local buzz is not explored as a whole by using a social network analysis (SNA) perspective focusing on the agents other than the firms as the basic unit of analysis. Analysis of the network of these agents provides us with a lens through which Marshallian atmospherics and the local buzz can be quantified and compared for different periods of a cluster. Thus, being complementary to the previous studies, in this study, the micro-data compiled from several sources are used by employing the tools of SNA in order to understand the evolution of the movie cluster. The availability of the social atmosphere facilitating learning and knowledge spillovers via buzz effect and trust-based relations can be measured by observing the evolution and pattern of collaboration of the agents in the cluster.
Indeed, the extent and quality of the social atmosphere in a cluster can easily be revealed by analyzing the characteristics of the social network (SN) (Krätke, 2002). It can be argued that the increased connectedness of the agents in the SN reflects the production and circulation of knowledge required in a cluster. As a corollary to Marshallian atmospherics, the bulk of this knowledge is actually tacit in nature. This was also confirmed by Özkan (2009) for the movie cluster in Istanbul. Within this context, one of the aims of this study is to unveil the extent and evolution of the social transformation experienced in Turkish movie cluster by employing tools of SNA. However, it should be kept in mind that owing to the nature of knowledge circulated, the network concerned is highly spatialized because
tacit knowledge cannot be produced and shared without the availability of spatial proximity. Furthermore, it also necessitates a cognitive proximity in addition to social proximity (trust) and spatial proximity.
While there are various studies conducted in order to analyze film industry by using the tools and concepts of SNA, except for Krätke (2002) employing SNA in order to develop the ‘quality analysis’ of clusters by focusing on the film industry cluster in Potsdam/Babelsberg in Germany, they don’t directly relate their analyses to the concept of the culture cluster and there is almost no study using SNA in terms of assessing the evolution of the cluster concerned. It is observed that particularly in the US and Brazil, SNA is frequently used in the analysis of the film industry. In Brazil, Carvalho and Fischer (2000) use SNA in order to analyze the international strategic cooperation between United Cinemas International based in the UK and Orient Filmes, a Brazilian cinema exhibition company based in Salvador, Bahia. By collecting information about cast, director, producers and distributors, Kirschbaum (2006) analyses the role of those agents in the production of Brazilian films between 1994 and 2002. Lastly, Rocha et al. (2018) employ SNA for the analysis of social interactions in movie production and distribution in Brazil.
In the US, by employing tools of SNA, Jones and Walsh (1997) unveil that within the film industry community only one labor market exists in the US. Spiro (2008) also analyses the U.S. film industry for the period between 1909 and 2005 by using SNA. In his study, Spiro (2008) establishes a connection between position, mobility, novelty and innovation. Focusing on the coproduction relationships in high grossing versus highly lauded films in the U.S. market, Miller (2011) uses SNA in order to understand these relationships. Her analysis unveils that the funding structures of both high grossing and highly lauded films were less centralized, dense, and clustered than is commonly believed. Lastly, in the US, Packard et al. (2016) use SNA in order to measure the extent of contribution of different team members to the film’s success. They argue that these contributions stem from team members’ embeddedness in a SN intertwined through past film partnerships that provide them with chances to acquire knowledge to be involved in new film projects.
It is observed that in these studies conducted in the US and Brazil, the roles and positions of the agents involved in the production of films are elaborated by using centrality measures or k-core scores that show the degree of connectedness of the agent in the network in terms of various measures elaborated in a detailed context in the third section of this paper. Although k-core score and the centrality measures offer interesting insights for the SN under scrutiny, in this study, it is assumed that the first step in the analysis of a SN should entail the identification of connected components because agents having the same centrality or k-core score may be involved in different components having no interaction with each other. Furthermore, the number and size of the cliques in the network can also be used as a measure of quality of social interactions. Thus, although in this study parallel to Krätke (2002) it is argued that a ‘quality analysis’ of clusters can be performed by using the indicators of SNA, these indicators are used in a different fashion for the evaluation of evolution of the cluster and in connection with a new set of indicators particularly developed for this study. Moreover, while only 40% of the companies in the Potsdam/Babelsberg cluster were included in Krätke’s (2002) analysis, the databased compiled in this study covers all the agents in
the network. Nevertheless, the focus of analysis is restricted to the evolution of the cluster.
In this respect, the recent study conducted by Berg (2015) on the Korean film and TV industries for the analysis of evolution of the creative cluster reveals the importance of the agents other than the formal firms in the evolution of a cluster. As Berg (2015) remarks by drawing on the notions of Evolutionary Economic Geography, in “a co-evolutionary perspective, it is not only firms and industries, but also in a broader sense the institutional setting of firms and industries, that can affect the dynamics of regional economies”. The recent study conducted by Öz and Özkaracalar (2017) also employ the framework of evolutionary and institutional economics in their analysis of the movie cluster in Istanbul. They analyze the historical development and recent revival of the film industry in Istanbul within a co-evolutionary historical perspective with particular focus on the path-dependence as the basic analytical tool for their investigation.
The connection between the novelty-innovativeness and the position of the agents in Turkish movie cluster is the second focus of this study in terms of addressing the evolution of the creative dimension of the cluster. For a similar consideration, Spiro (2008) includes every artist working on a film as a screenwriter, director or producer between 1909 and 2005 in the SN, and reveals that further from the core of the network an agent, more likely he or she acts in a novel manner and takes relatively risky decisions. This stems from their unconfident position and willingness to pursue innovation. Thus, in this study it is argued that the agents having higher capacity for novelty-innovation can occupy not only central or in between locations as suggested by Granovetter (1973), but also distant locations having low k-cores scores. This is also in line with the high-risk factor in film industry as discussed above.
Based on the introductory framework given above, this paper is organized in six sections. In the second section, historical evolution of Turkish film industry is depicted with reference to the existing studies and within the framework of, in general, global changes and, in particular, changes in the film industry. In the third section, SNA, the method of analysis used, is presented together with the database compiled from various sources with particular reference to the specific procedures and parameters employed for this study. In the fourth section, a historical analysis of the evolution of social structure of the movie cluster is presented based on the findings emerging from SNA according to the decades between 1940s and 2010s, which reveals that social structure of Turkish movie cluster has dramatically changed and restructured over time. In the fifth section, some network statistics regarding the innovativeness in the cluster is presented. The final section draws on some concluding remarks regarding analysis conducted in this study and the implications for the future of the cluster.
A BRIEF HISTORY OF TURKISH FILM INDUSTRY WITHIN THE CONTEXT OF GLOBAL CHANGES
Till the end of 1940s, film industry in Hollywood was dominated by the big studios based on the vertically integrated form of organization. Organization of production-distribution-exhibition chain by these studios also known as majors was based on Fordist principles (Storper and Christopherson, 1987; Aksoy and Robin, 1992; Gomery, 2005). With the demise of film studio system in the 1950s and 1960s in the US, a network
organization realized around projects and characterized by a large number of firms involved in different phases of production via informal (such as personal networks of independent subcontractors and firms) or contractual agreements has emerged (Jones and Walsh, 1997). Scott (2002) describes this organization of motion-picture industry in Hollywood as a bifurcated production based on a tripartite system between two clearly definable tiers of productive activity. Although the first tier is still occupied by the major studios, the second tier composed of the independent section of the industry signifies a vital and booming element of the Hollywood complex. Scott (2002) places a middle tier in between these tiers as a bridge between the majors proper and the pure independents.
Reorganization of motion-picture industry in the US has also created some effects on the Turkish movie industry. The entry of the US film companies to the Turkish film industry has led to a series of changes in the organization of production-distribution-exhibition chain. In this respect, a detailed analysis of the economic structure of Turkish cinema can be found in the studies of Özön (1962; 1968a; 1968b; 1985), Şener (1970), Scognamillo (2001; 2002a; 2002b; 2002c; 2003), Abisel (1978; 1994), Erkılıç (2003; 2008; 2014), and Kalemci and Özen (2011). There are also various studies for the periodization of the evolution of Turkish cinema. For example, Özön (1996) periodizes Turkish movie industry with respect to the content of films or the qualities of the agents controlling the industry; the era of theatre professionals (1923-1939), transition era (1939-1950), era of cinema professionals (1950-1970) and new cinema era (1970-1984). Erkılıç (2003; 2014) distinguishes four periods; introduction of cinema via state institutions (1896-1922), the era of private production houses (1922-1949), the development of film production as a sector (1950-1995), and new Turkish cinema (after 1995).
Another periodization is made by Arslan (2011); the era until the late 1940s (pre-Yeşilçam cinema), Yeşilçam cinema from the 1950s through the 1980s, and the era since the early 1990s (post-Yeşilçam or the new cinema of Turkey). In his narrative, Arslan (2011) analyses the era from the 1950s through the 1980s under sub-eras of “early Yeşilçam” (the rise of Yeşilçam in 1950s), “high Yeşilçam” depicting the development of Yeşilçam up to 1980s, “late Yeşilçam” (melting in the 1980s). In another study, Kanzler (2014) analyses the history of film industry in Turkey under four periods; early years (1896-1950), Yeşilçam (1950-1980), decline and crisis (1980- 2000), and renaissance (2000-2013). Lastly, Kalemci and Özen (2011) propose three periods for the analysis of the Turkish movie industry; (1) the pre-1950s characterized by vertically integrated form of organization under the monopoly of a few large family companies, (2) network organization (1950-1989), and (3) hierarchical network organization (1989-2011). Although Kalemci and Özen (2011) employ the concept of network frequently, they don’t provide any measurable objective criteria for their periodization. In the era before the 1950s witnessing the introduction of cinema, as remarked by Erkılıç (2003; 2014), via state institutions and subsequently establishment of private production houses, vertically integrated few family companies, as noted by Kalemci and Özen (2011), dominated the industry by controlling the exhibition phase owing to their monopoly power in the import and distribution chain. During this era, movie production was very little and the sector relied on the exhibition of mostly imported films rather than production. In the 1950s, the number of cinema halls in Turkey increased. Parallel to this, large family companies started
to lose their dominance over the sector due to the establishment of new production companies. In his study, Erkılıç (2003) calls this period (1950-1960) as “Period of Producers”. Over time, the heads of provincial divisions originated in the pre-1950s as extensions of big production companies headquartered in Istanbul and functioning as mediators in Anatolia tended to create “a structure and operation system that would allow them to be relatively less dependent and more in control” thanks to the growth of the number of production companies (Kalemci and Özen, 2011, 86).
Consequently, a new distribution system called as the ‘regional agency system’ was created within the structural frame of the provincial branches system. In this system rival to the former one, the regional operators (in other words, the distributors), each year, informed their producer in Istanbul about the type of movies the spectators in their region desired to watch and prepaid to the production company to produce that type of movies (Erkılıç, 2003). As argued by Erkılıç (2003; 2014), the regional operators can be described as a financing model invented by Turkish cinema. In this financial model, the film industry was relied on the prepayment made by the regional operators (Gökmen, 1973; Abisel, 1994). In contrast to the system of provincial branches, regional operating companies were independent from the producer. Actually, they were the main agents supplying capital for the production of movies (Erkılıç and Ünal, 2018). The majority of the studies conducted on the history of Turkish movie industry define the 1960s and the early 1970s as the Golden Age of Turkish cinema (Özön, 1985; Scagnamillo, 2003; Erkılıç, 2003; Arslan, 2011).
Because of the start of television broadcasting in Turkey and increase in the film production costs due to the emergence of star system that can be defined as a strategy to cast star actors and actresses in movies for mitigation of the risk involved in a film project, the introduction of color movies, terror events and the spiral of inflation-devaluation; the regional agency system began to experience some difficulties beginning from the 1970s onwards (Özön, 1996; Erkılıç, 2003; 2014). As remarked by Öz and Özkaracalar (2017), more critical in this process was actually the decreasing capacity of the cluster to adapt to the new conditions because of their loyalty to old routines. Furthermore, it is known that the film industry was heavily dependent on imports regarding the raw materials and equipment, and unfortunately, the incomes earned by the agents of Yeşilçam during the golden years of Turkish cinema were not capitalized for the improvement of this infrastructure (Özön, 1962; Scagnamillo, 2003; Erkılıç, 2003). As a result of these, Turkish movie industry entered into a crisis in the second half of the 1970s. As the production-distribution-exhibition stages were detached from each other, it is impossible to characterize this period with vertically integrated organization. The organization form of this period can be described, according to Kalemci and Özen (2011), as a network organization based on mutual negotiation and agreements rather than the supremacy or the chain of command.
Beginning from the 1980s onwards, the Turkish economy has been
increasingly integrated to liberal economic system leading to a change also in the cinema sector. Under the transformative pressure of the 1980 coup, and subsequently, the so-called “24 January decisions”, film production in Turkey was transformed into a mode of production dominated by the videotape industry (Erkılıç, 2003; 2014; Arslan, 2011). The big US film production companies also invested in Turkey with the formation of an appropriate environment. They discovered that there was a profitable
market in Turkey not only for television and video channels, but also for American movies (Öz and Özkaracalar, 2017). During this process, the US distribution companies made agreements with cinema exhibition companies in Turkey in order to ensure the dominance of American movies in the cinemas in such a way that national producers having no agreement with foreign distributors could not easily find cinemas for the exhibition of their films (Evren,1997; Erkılıç, 2003; Teksoy, 2008; Kalemci and Özen, 2011). On the one hand, as a result of this increasing domination of foreign distribution companies over film distribution activities in Turkey, and on the other hand, as a result of the dissolution of the regional distributors, during the era from the 1980s to the 1990s, producers could not find cinemas for the exhibition of their films and they lost a significant part of their audience.
Under the pressure of globalization, beginning from 1990s onwards, the Turkish movie industry experienced radical changes with the formation of distribution networks particularly by the US companies aiming at the self-distribution of their movies and the prevalence of American movies in the cinemas. Hence, the network organization starting to dissolve since the second half of the 1970s was substituted by a new form of organization. The basic characteristic of this new form of organization can be described as hierarchical network organization that is dominated by few numbers of distribution companies which have replaced the regional operators of the previous period (Kalemci and Özen, 2011). Types of movies, their exhibition order and the length of duration of exhibition are decided by these distribution companies, which make them stronger against the producers and movie theaters.
However, during the 1990s and 2000s television sector that negatively affected cinema sector particularly during the 1970s and 1980s has also provided income, technical infrastructure and expertise required in the reemergence of film industry beginning from the 2000s onwards predominantly through advertising sector (Erkılıç, 2003; Özkan, 2009; Öz and Özkaracalar, 2017). Some of the salient movies during the 1990s and early 2000s were financed by the television revenues of the producer companies. Inclusion of popular artists from the television series in these movies also contributed to the box office success of the movies. During this process, some popular television series were also adapted into feature films that can be considered as spin-offs (Öz and Özkaracalar, 2017). Thanks to the proliferation of television channels, younger audiences have also been familiarized with the classics of Yeşilçam, and in turn, film crews are provided with job opportunities (Öz and Özkaracalar, 2017)
Beginning from the mid-2000s onwards, a two-tier production system can, actually, be observed in the film industry in Turkey (Erkılıç, 2014). Conceptual pillars of this system are discussed by Scott (2000) with reference to French film industry. In this system, it is observed that main stream commercial movies are produced simultaneously with the ones having small budgets and artisanal in their production methods and business practices. The independent producers in this two-tier system are mostly supported by the cinema funds. During this recent era, it is observed that spectators relatively preferred Turkish films in spite of low number of Turkish films compared with the total number of films released. Subsequently, in 2010s, once again spectators have turned to Turkish cinema. However, it is known that although commercial movies break the box office records, independent productions don’t get enough
attention, albeit they become more successful in the international festivals. In Turkish film industry, while the first tier of the system is occupied by the main stream commercial movies, the second tier is constituted by mainly independent movies supported by the cinema funds.
To what extent these transformations are reflected in the SN of directors and screenwriters in the movie industry is a critical question. As remarked in the introduction, the evolution of the innovation capacity of the agents involved in the network is also important in order to understand the social transformations experienced in the industry. In the subsequent sections, after presenting the method of analysis and database used in this study, firstly evolution of the social structure of Turkish film industry in terms of the relationships between directors and screenwriters will be exposed. Following this, innovativeness in Turkish movie industry will be addressed within a restricted framework.
THE METHOD OF ANALYSIS AND THE DATABASE USED IN THE STUDY
SNA is based on graph theoretical conceptualization of social relations. In this respect, social agents are represented as nodes in a graph. The lines between the nodes in the graph represent the relationships between the agents. This abstraction visually facilitates grasping of social relations in a holistic way. There are two main approaches for the placement of nodes in a graph in SNA (Freeman, 2005); (1) multidimensional scaling (MDS) and (2) singular value decomposition (SVD). There are some variations in both MDS and SVD. Among them one of the most widely used one in MDS is spring embedding algorithm that locates the nodes according to the level of interaction between them. Accordingly, the nodes that are more in interaction with each other than the rest of the nodes are located close to each other, which reveals the demarcation between the social groups involved in a network. As Krätke (2002) remark, MDS offers only a rough solution for the foundation for the graphical reconstruction of the network. Thus, individual agents can be repositioned as required during processing. In this study, SN of directors and screenwriters is first analyzed by
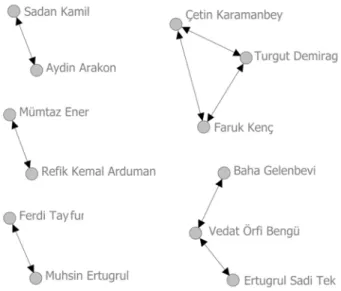
revealing cohesive sub-graphs via a series of component, bi-component and clique analysis (Borgatti et al., 2002). A component of a SN is the disconnected part from the rest of the network (Iacobucci, 1994). In other words, definitionally, an agent in one component can not be connected to another agent in another component. An illustrative example from the network created for this study by using two-mode data can be seen in Figure 1. In Figure 1, the nodes in the graph represent directors and screenwriters. The lines between the nodes shows the fact that the agents concerned worked together in the production of at least one movie. The direction of the line is from director to the screenwriter and its thickness shows number of the movies in which the agents concerned worked together. As it can be inferred from this representation, the self-loop for a node shows the fact that the agent concerned took the responsibility of director and screenwriter in the production of at least one movie. In
Figure 1, Şadan Kamil, Aydın Arakon and Ragıp Şevki Yeşim constitute a
component disconnected from the rest of the network. In this two-mode data network, there are a total of 14 components disconnected from each other. Those components having only one member are called isolates.
If the removal of one agent from the network leads to the formation of new components, the resulting components are called bi-components. For example, if Burhan Felek is removed from the network given in Figure 1, two separate components emerge in the network as components; bi-component of Muhsin Ertuğrul, Necdet Mahfi Ayral, Nazım Hikmet and M. İhsan, and bi-component of Ferdi Tayfur and İhsan Koca. Those agents leading to formation of bi-components are called cut-point functioning as a bridge between bi-components. In this respect, Burhan Felek is definitionally a cut-point in the network.
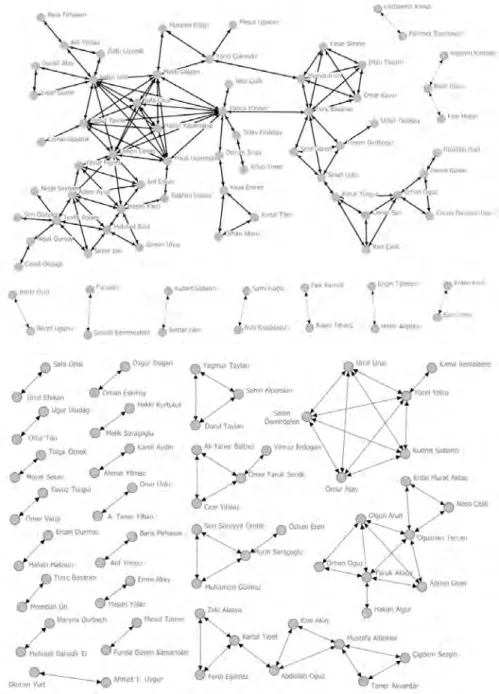
The network presented in Figure 1 can also be represented in one-mode data format by only including directors connected to each other via screenwriters. Such a representation excluding isolates can be seen in
Figure 2. If the isolates in the network are omitted, it is observed that there
were 5 components in the 1940s in the network of directors connected to each other via screenwriters (Figure 2). The largest component in the network is called main component. There are two such components in
Figure 2 each having 3 directors (Çetin Karamanbey, Turgut Demirağ
and Faruk Genç constitute one of them, and the other largest component is composed of Baha Gelenbevi, Vedat Örfi Bengü and Ertuğrul Sadi Tek). Only one of them is also characterized by a clique formation (Çetin Karamanbey, Turgut Demirağ and Faruk Genç). In a clique, all members should be connected to each other.
Figure 1. Components in the 1940s in two-mode data format (1)
1. This layout is produced by using Cytoscape (Shannon et al., 2003).
Semsi Arakon Mualla Ken<;
I
Faruk Kenc;
Tahir Olgar;~ .. I
q
Turgut Demi rag '-0 <;lltiri Karamanbey Rel\k Kemal 0 Arduman Muhc1rrem'o
Gi.Jrses / ./' Haluk Cernil Tanlu H1fz1 Tan Faruk Nafiz <;amJ1belr
•
1 ihsan Kocao
Fer'di Tayfur ...7
Buman Felek Muhsln Ertugrul ✓ M. 1hsan Vedatl:im \ Bengii Naz1m Hikmet 9Ayd111 Arakon Rag1p Sevk
O
Miimtaz Ener • Baha Gelenbevi Ye§lm~ Azmf Kutuvc11 Sarni Ayanoglu I j Zlya <;altkoglu LGtfi Akad
.
,
0 \ Selahattin Kuc;iik ErtugrUI Sadi Tek,
,
'-0 Talat Artemel t -Q SuavlTedO.
,
0 Seyfl Havaerf,
,
0 Kan K1p~a~In terms of visual characteristics of a graph, various parameters calculated by a regular SNA software can be effectively used for the inspection of important characteristics of the agents and social groups involved in a network. One of the most widely used parameters of the nodes involved in a network is the centrality. The centrality of a node can be measured in various ways. The most common one is the degree centrality (DC) showing the total number of relations to which a node is subject (3). For example, in
Figure 1, the size of the nodes representing directors and screenwriters are
scaled according to their DC in the network. Betweenness centrality can be listed among the other most frequently used centrality types. Betweenness centrality (BC) of a node is the ratio of all geodesics between pairs of nodes running through the respective node. BC actually reflects how often a node lies on the geodesics between the other nodes of the network (Freeman, 1977).
As it is evident from Granovetter’s (1973) study, those agents having higher levels of BC have access to diversified channels of knowledge and owing to this they may have higher innovation capacity. Those agents with high DC values are subject to large volumes of knowledge flow and they can also be considered to have relatively higher levels of innovation capacity. In this study, both DC and BC are used in order to observe the pattern of innovativeness in the network in relation to the position of the agents in the network. As remarked in the introduction, employment of centrality measures in the analysis of SN built around the relations occurring in the motion picture industry is widespread (Packard et al., 2016; Rocha et al., 2018).
Another, important concept in relation to the centrality of agents in a network is k-core first proposed by Seidman (1983). A k-core of a given network can be defined as the connected largest induced subgraph of the network in which every agent has a degree centrality of at least k (Seidman, 1983). In other words, a k-core is the maximal subgraph of the network in which every agent is adjacent to at least k agents. It has an application in a wide range of fields ranging from biology, ecology, and computer sciences to SN, information spreading, community detection and other interdisciplinary fields (Kong et al., 2019).
Figure 2. Components in the 1940s in one-mode data format (isolates excluded) (2)
2. All layouts for one-mode networks were initially produced by using spring-embedded algorithm of the NetDraw visualization tool (Borgatti, 2002). In order to increase the visibility of agents, the layouts were partially modified. Only some of the graphs are included here for illustrative purposes. Graphics in the figures show the network of directors connected to each other via screenwriters (one-mode presentation of the data).
3. The number of ties an actor has with other actors in a network (Freeman, 1979).
Aydin Arakon Turgut Demirag
Refik Kemal Arduman Baha Gelenbevi
Ferdi Tay fur
Vedat Orfi Bengu
Since embeddedness is built over time in a social system, in this study, it is measured by identifying both the social sub groups and the pattern of the continuation in these groups. In this context, for the analysis of the evolution of the social structure of Turkish movie industry in terms of the relationship between directors and screenwriters, deterministic definitions such as component, bi-component, and clique analysis described above are used. In addition to these analysis, characteristics of the network have been unveiled by calculating a series of parameters (such as diameter of the network) used in SNA for the whole and/or parts (partition, component or clique) of the network. Diameter of a SN is the shortest distance between the two most distant nodes in the network (longest geodesic distance in a SN). In this study, diameter of the main component is measured in order to get some intuition about the compactness and dissolution of the network. For example, the diameter of one of the main components in the network given in Figure 1 is 4. In this main component involving Tahir Olgaç, the diameter is the distance between Hıfzı Tan and Mualla Kenç or Şemsi Arakon who are the most distant agents in the respective component. Bulk of the network data used in the study has been compiled from the studies conducted by Agah Özgüç who has collected the data about Turkish movies and published several volumes of books (Özgüç, 1980; 1997; 2003; 2009; 2012) providing information about the agents (such as directors, screenwriters and producers) involved in each movie. Since these volumes of books provide information about the movies till 2012, the data about the movies produced during and after 2012 has been compiled from other resources such as two volumes of the book (İnanoğlu, 2018) published by TÜRVAK in 2018 in order to commemorate the 100th anniversary of Turkish cinema. The mistyped or missing information in these sources have been checked or compiled from the web site of Wikipedia for “Yıllara göre Türk filmleri” (VİKİPEDİ, 2020).
The agents involved in the network are grouped under 8 main
occupation categories; (1) producers, (2) directors, (3) screenwriters, (4) cinematographers, (5) music directors, (6) art directors, (7) directors of editing, and (8) artists. Subsequently a series of networks is constructed by associating the respective agents with each other. As the information available in the respective books is not linked to a database previously, it requires some adjustment for the employment of the data concerned in SNA. Thus, the database used in this study is corrected by considering typing errors and the use of pen names.
In his study conducted for SNA of the movie industry in the US, Spiro (2008) includes only agents in the roles of screenwriter, director or producer in the network by considering the fact that these roles represent the top of the hierarchy of the impermanent organization formed to produce the movie and the agents in these roles have the highest control over the film’s content. The main responsibility of screenwriter is to write the script. The director is responsible to organize the production and the way the script is translated onto film. The decisions regarding the financial aspects of the movie and limitations regarding the money lie with the producer.
Nevertheless, in this study producers are not included in the analysis owing to a number of reasons. Firstly, existing historical analysis of the movie industry is already based on the demarcation of the eras according to the relations between producers, distributors and exhibitors without analyzing the pattern of the relations between the other important agents of the industry. Secondly, inclusion of the producers in the analysis leads
to certain complications. For example, a producer can be considered as an individual or a company owned by a group of people. This complicates the representation of the network. Furthermore, the inclusion of producer in the network actually requires a three-mode data structure that is also difficult to analyze. In this study, even the two-mode data constructed for directors and screenwriters has been converted to one-mode data.
The database used for the analysis of the SN of directors and screenwriters in Turkish film industry is constructed by linking the directors to the screenwriters in the form of edge data format. For this purpose, each incidence of co-existence of any director with any screenwriter in any movie is considered provided that they were mentioned as the director or screenwriter for the film concerned in the series of the book written by Özgüç (1980; 1997; 2003; 2009; 2012) or İnanoğlu (2018). Thus, the original database constructed for the network analysis was in the form of two-mode data whose rows show the directors and columns show screenwriters. Because of the difficulty in the representation and analysis of two-mode data for the exposition of the structural relationships, two-mode data of directors and screenwriters has been converted to one-mode data of directors-to-directors for the structural analysis of the network over time.
HISTORICAL ANALYSIS OF THE SOCIAL STRUCTURE OF TURKISH MOVIE CLUSTER IN TERMS OF THE RELATIONSHIPS BETWEEN DIRECTORS AND SCREENWRITERS
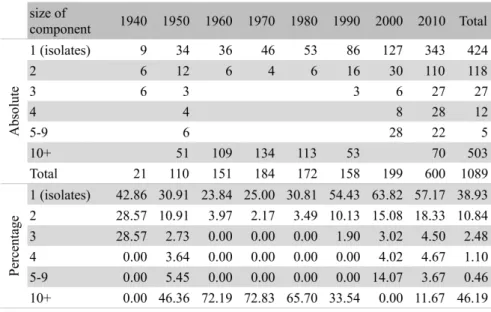
As explained above, the evolution of one-mode social structure of directors is analyzed by identifying cohesive sub-graphs. For this purpose, a series of component, bi-component and clique analysis (Borgatti et al., 2002) are used in order to delineate the social groups embedded in the network. Accordingly, firstly, the components of the network are revealed over time. Pivot tables are also created in order to comprehend the nature of the components embedded in the network. Table 1 showing the distribution of components according to their size over time reveals that more than 60% of the components are actually isolates without any connection to the other members.
Table 1. The number of components in the network according to their size over time.
component 1940 1950 1960 1970 1980 1990 2000 2010 Total I (isolates) 9 34 36 46 53 86 127 343 424 2 3 6 3 2 3 8 15 55 59 Cl) 3 2 2 9 9 ~ 0 4 2 7 3 "' ,D <l'.'. 5-9 I 4 4 1 10+ 1 1 1 I 2 2 Total 14 44 40 49 57 96 150 420 498 I (isolates) 64.29 77.27 90.00 93.88 92.98 89.58 84.67 81.67 85.14 Cl) 2 21.43 13.64 7.50 4.08 5.26 8.33 10.00 13.10 11.85 Oil C<S 3 14.29 2.27 0.00 0.00 0.00 1.04 1.33 2.14 1.81
c
Cl) u 4 0.00 2.27 0.00 0.00 0.00 0.00 1.33 1.67 0.60...
Cl) '""' 5-9 0.00 2.27 0.00 0.00 0.00 0.00 2.67 0.95 0.20 10+ 0.00 2.27 2.50 2.04 1.75 1.04 0.00 0.48 0.40Isolates can be best conceptualized as the strict periphery of the network. The number of isolates peaks in the 1970s by accounting for 93.88% of all components in the network for the decade concerned. Nevertheless, this does not mean that they always account for the bulk of the network in terms of the number of the members covered. Indeed, till the 1990s isolates count less than 50% of the directors (Table 2). Nevertheless, during the last three decades isolates count more than half of the directors in the network. The respective decades have witnessed the dissolution and re-organization of the network under scrutiny.
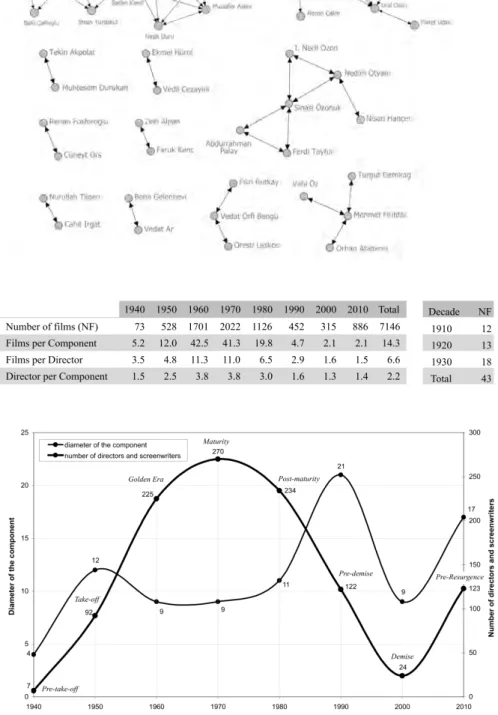
It is observed that beginning from 1950s (Figure 3) and particularly 1960s onwards till 1990s the biggest components that can be considered as the core of the network account for the bulk of the network (Table 2). In the 1970s the respective component covers 72.83% of the members in the whole network. Actually Table 2 reveals the most appropriate procedure that can be used in order to reveal the social groups in the network of directors connected to each other via screenwriters. It is clear that for the initial and the terminating decades simple plotting of the components by excluding the isolates will be sufficient to easily comprehend the network.
For the other decades covering 1960s, 1970s and 1980s, bi-component analysis and separate plotting of the main and other blocks may be required to properly and visually figure out the network. During these decades, it is observed that the average number of films directed by a single director is above 6 (it is even more than 11 particularly during 1960s & 1970s) (Table
3). It is also observed that during 1960s (also known as the golden age of
Turkish cinema) and 1970s the number of films per component is remarkably high compared with the other decades, which signals the existence of a compact network in the respective decades.
Indeed, although the diameter of the main component during these decades is around 9, the number of agents (directors and screenwriters) involved in the network is more than 220 (Figure 4). In 1990s, while the number of agents involved in the main component decreases to 122, the diameter of the network increases to 21. For approximately the same size of main component, the diameter of the network decreases to 17 in the 2010s, which interestingly signals an increase in the compactness of the network.
Table 2. The number of directors according to the size of the components over time.
size of
component 1940 1950 1960 1970 1980 1990 2000 2010 Total
1 (isolates) 9 34 36 46 53 86 127 343 424 2 6 12 6 4 6 16 30 110 118 B 3 6 3 3 6 27 27 ;::l 0 4 4 8 28 12 VJ .n <( 5-9 6 28 22 5 10+ 51 109 134 113 53 70 503 Total 21 110 151 184 172 158 199 600 1089 I (isolates) 42.86 30.91 23.84 25.00 30.81 54.43 63.82 57.17 38.93 0 2 28.57 10.91 3.97 2.17 3.49 10.13 15.08 18.33 10.84 00 $3 3 28.57 2.73 0.00 0.00 0.00 1.90 3.02 4.50 2.48 C: 0 u 4 0.00 3.64 0.00 0.00 0.00 0.00 4.02 4.67 1.10
...
0 p.., 5-9 0.00 5.45 0.00 0.00 0.00 0.00 14.07 3.67 0.46 10+ 0.00 46.36 72.19 72.83 65.70 33.54 0.00 11.67 46.19Figure 3. Main component and other components in the 1950s.
Table 3. The numbers of films and films per component and director together with the number of directors per component over time.
Figure 4. The numbers of agents in and the diameter of the main component over time.
&mdH1m1l
\ ~i.."U rr Olv.011
N~hL~,n O\Jr\lkarl V~U C'eu;yo h
.-inhll ltlJ,t
1940 1950 1960 1970 1980 1990 2000 2010 Total Decade NE
Number of films (NF) 73 528 1701 2022 1126 452 315 886 7146 1910 12
Films per Component 5.2 12.0 42.5 41.3 19.8 4.7 2.1 2.1 14.3 1920 13
Films per Director 3.5 4.8 11.3 11.0 6.5 2.9 1.6 1.5 6.6 1930 18
Director per Component l.5 2.5 3.8 3.8 3.0 1.6 1.3 1.4 2.2 Total 43
25 300
...,_.diameter of the component
250 20 17
i
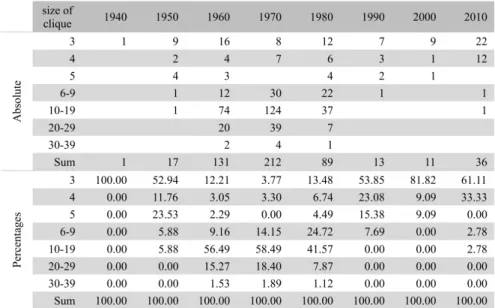
C 200 i ~ I; C 0 15 ~ C. E 0 "C u C ~ 150 ~ " 0 !!l 10 -~ i5 100 ~ ,, § z 50 1940 1950 1960 1970 1980 1990 2000 2010 DecadesThe complex nature of the network can also be confirmed by observing the nature of clique formations. Table 4 shows that beginning from 1960s till 1980s it is possible to observe formation of cliques having more than 30 members.
Clique co-membership of the directors also peaks during these decades that witness the existence of some directors being member of more than 50 cliques at the same decade (Table 5). Nevertheless, beginning from 1990s onwards smaller cliques have started to account for bulk of the clique formations.
Indeed, although the cliques having more than 5 members account for the bulk of the clique formations before 1990s, it has radically decreased since
Table 4. The number of cliques according to their size over time.
Table 5. The number of directors according to their clique co-membership over time.
size of 1940 1950 1960 1970 1980 1990 2000 2010 clique 3 9 16 8 12 7 9 22 4 2 4 7 6 3 12 5 4 3 4 2 2 ::, 6-9 12 30 22 ] 10-19 74 124 37 ..0 < 20-29 20 39 7 30-39 2 4 I Sum 17 131 212 89 13 II 36 3 100.00 52.94 12.21 3.77 13.48 53.85 81.82 61.11 4 0.00 11.76 3.05 3.30 6.74 23.08 9.09 33.33 "' 5 0.00 23.53 2.29 0.00 4.49 15.38 9.09 0.00 " eo ~ 6-9 0.00 5.88 9.16 14.15 24.72 7.69 0.00 2.78 t:
"
10-19 0.00 5.88 56.49 58.49 41.57 0.00 0.00 2.78 2 " Q.. 20-29 0.00 0.00 15.27 18.40 7.87 0.00 0.00 0.00 30-39 0.00 0.00 1.53 1.89 1.12 0.00 0.00 0.00 Sum 100.00 100.00 100.00 100.00 100.00 100.00 100.00 100.00 clique co-1940 1950 1960 1970 1980 1990 2000 2010 membership I 3 28 33 45 37 31 28 99 2 5 5 3 II 4 4 7 3 2 5 4 3 4 5 4 3 5 2 2 5-9 3 9 10 7 :, 5i 10-19 9 12 17 ..0 < 20-29 7 8 3 30-39 5 2 7 40-49 7 4 3 50- 11 25 2 total 3 41 96 115 91 39 32 112 1 100.00 68.29 34.38 39.13 40.66 79.49 87.50 88.39 2 0.00 12.20 5.21 2.61 12.09 10.26 12.50 6.25 3 0.00 4.88 5.21 3.48 3.30 10.26 0.00 4.46 4 0.00 7.32 5.21 1.74 1.10 0.00 0.00 0.89 V, " 5-9 0.00 7.32 9.38 8.70 7.69 0.00 0.00 0.00 0/) "'"
10-19 0.00 0.00 9.38 10.43 18.68 0.00 0.00 0.00 " 2 20-29 0.00 0.00 7.29 6.96 3.30 0.00 0.00 0.00 " 0. 30-39 0.00 0.00 5.21 1.74 7.69 0.00 0.00 0.00 40-49 0.00 0.00 7.29 3.48 3.30 0.00 0.00 0.00 50- 0.00 0.00 11.46 21.74 2.20 0.00 0.00 0.00 total 100.00 100.00 100.00 100.00 100.00 100.00 100.00 100.00then. It is observed that the number of cliques having only 3 members has radically increased since 1990s and peaked in 2000s (Figure 5) (Figure
6). Weakening of the SN can also be validated in the pattern of clique
co-memberships. In 1990s, only 4 directors are members of 3 different cliques at the same decade. In the subsequent decade, it is observed that a director can be a member of at most 2 different cliques at the same decade.
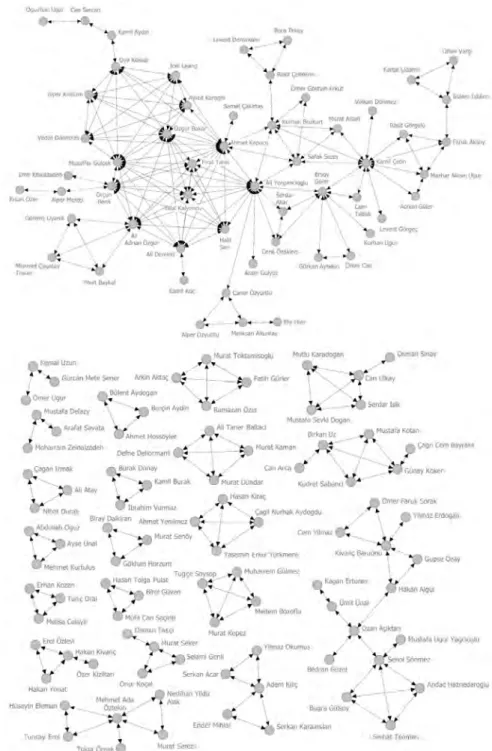
Thus, the observation in relation to the dissolution of the network based on the change of the size of the components over time is also confirmed based on the change in the size of the clique formations. Nevertheless, in 2010s, it is observed that the cliques having more than 5 members reappeared in the SN of directors (Figure 7). As remarked above, the last 3 decades have witnessed a harsh dissolution and slow re-organization of the network under scrutiny with a tendency of revitalization.
Figure 5. Main component and other components in the 1990s.
Figure 6. Main component and other components in the 2000s. 'ftlll,m , ~111 I~
/
~
I
"'
A ~
,,.
"
>1- - '~
~ , ,~ ,,,I
,. ,, ,,
\/Q
1.
'<
,
..
I\
\
.,., .. ,,
..
,
l.
!~
...
\
L
""" .
r,1,ui~Y!-" ,
...
1, \'T
~:,
,·,.e ' -~
l
,.
"-., "\,...
''"/ \
... ·
1)
.. ,. ,
~
... , ..
,
z:2t~c
..
J . . . ,l
, .(
tlu, 1 ',I ,,. ' I , I t "~ I 111 '\ I •"l"I ll{tl,ll'bl t /!,•, ~(00,,u>I I ,M• IHThese observations are also in line with the historical accounts of the Turkish movie industry. As discussed in the second section, the period after 1989 is described by Kalemci and Özen (2011) as the era of hierarchical network organization dominated by few numbers of distribution companies which have replaced the regional operators of the previous period. Nevertheless, SNA of directors via screenwriters for the last decade reveals that there is a tendency of revival in the SN of Turkish movie industry in terms of decreasing share of isolates and formation of bigger cliques and components compared with the previous decades (Figure
7). These findings are in compliance with the ones observed by Özkan
(2009), Özkan Töre (2010), and Öz and Özkaracalar (2010; 2017) for the reemergence of the film industry in Istanbul.
Figure 7. Main component and other components having at least 3 members in the 2010s. to!-~ "'
..
, '.L...
" t ' I Ov111,(,,,.,,
,
.
~--
<l "~,IC ,..t ' ~.Ir l. n~
/
t---
Ay.aA~rldll -t;,~-.
--"" I ,Ill"!'MU<a! T_,_,,,., MU!lU '-""'"Cl'I""
•--..._
~
--
-... ~ f.i•rhf'.ut1i!f ~A tan IJlk y
f ~tA'(QOQn ., &1•~11'1Aytl11 AIIT~Ball.!d Mlt.:ifdr( Stvl.J ()oQ l" oi~~4Tl Ut
...
.
(,Oltlt/!lr\ l'k>rl\1111 Tugi;e:~ ., HutiJ•u~mtjulme.-! H,t~r, TOIQ;:i Pul;,c "" .I '\,It."' fifm1 GI.Nen ~"' -...
~ M.,f,tr.ai1~1ill U IIIS\l ..,
.
h,n llo.llullu , lh "'In this study, a new indicator is also developed for the analysis of the SN of directors via screenwriters. It is related to the continuation of the agents in the SN. This actually corresponds to the embeddedness of the social relations created by the respective agents. Packard et al. (2016) use eigen and betweenness centralities in order to measure, respectively, the positional and junctional embeddedness of the agents concerned. Although these centrality measures may partly reflect the extent of embeddedness of the agents in the network, without a proper time dimension, they may not be useful for the measurement of the actual embeddedness of the agents concerned. Furthermore, in the case of a cluster, the measurement of embeddedness should be based on the qualities of relations in the cluster in general, not the qualities of the members of the network sustaining the cluster.
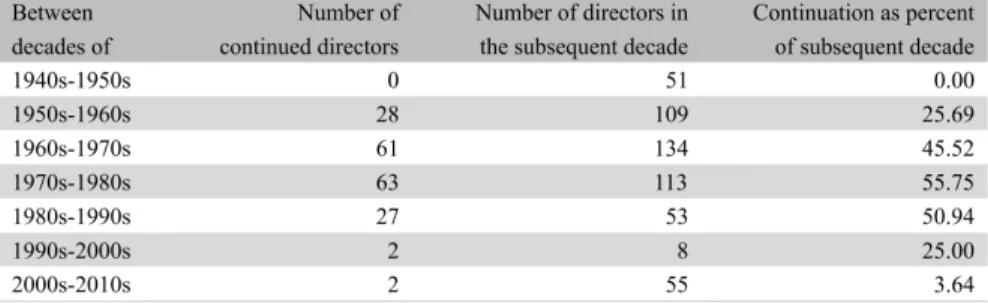
For this purpose, for each decade for the main component the number of directors who continue to be a member of the main component in the subsequent decade is calculated. Subsequently, their share in the number of directors in the main component of the subsequent decade is also calculated as an indicator of the continuation of the main network over time (Table 6). This actually reflects the operationalization of cognitive and social proximity in the network over time.
Creation and acquisition of tacit knowledge by the members of the
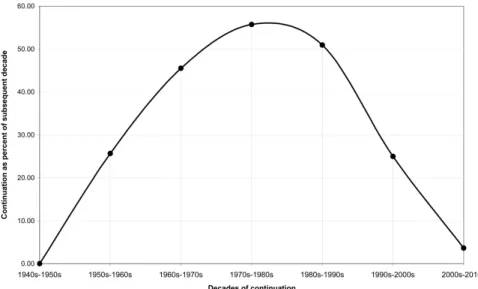
component is facilitated by the cognitive proximity. It can be safely argued that the cognitive distance between the members of a component is lower than the one between the members of different components. In a similar fashion, collaboration of the agents in movie projects is actually an outcome of the mutual trust between these agents, which accounts for the social proximity among them. In this respect, the creation and dissolution of the network in Turkish film industry is very evident from the continuation analysis of one-mode data of main component (Table 6) (Figure 8). What is particularly evident from these analyses is that in the 2010s there has emerged a new main component whose members have no or little connection to the main components of the previous eras. Overall, it seems that Turkish movie cluster has completed one of its life cycles and there are some signs for the initiation of another cycle in terms of the recent increase in the volume and quality of the social interactions experienced between the agents in the network.
In cluster evolution, a partial conflict can be observed between the connectedness and resilience. Indeed, although the golden era of Turkish cinema corresponds to a period characterized by increasing connectedness of the agents in the network, further increase in the connectedness seems to be associated with the decreasing resilience and subsequently initiation of a decline in Turkish film industry due to the increasing order and the
Table 6. The number and share of directors in the main component according to their continuation between subsequent decades over time.
Between Number of Number of directors in Continuation as percent
decades of continued directors the subseguent decade ofsubseguentdecade
1940s-1950s 0 51 0.00 I 950s-1960s 28 109 25.69 1960s-1970s 61 134 45.52 1970s-1980s 63 113 55.75 1980s-1990s 27 53 50.94 I 990s-2000s 2 8 25.00 2000s-20 I Os 2 55 3.64
reduction of adaptability of the system to changing external conditions. Nevertheless, thinking in the same line of reasoning, the recent increase in the connectedness of the agents involved in the network and the formation of a remarkable new main component having little connection with the past during the last decade can be considered as the signs of a resurgence. That’s why the era after 2010 is called in this study as the era of pre-resurgence. A similar observation is also done by Öz and Özkaracalar (2017, 83) in their argumentation for “the rebirth of a path (or rather paths) from the ashes of the old path”.
INNOVATIVENESS IN TURKISH MOVIE CLUSTER
One of the difficulties experienced in the studies dealing with
innovativeness is the measurement of the innovativeness. In traditional industry, the respective characteristics can be measured by using patent or similar kind of data. Nevertheless, in cultural and media industries it is much more difficult to define and find the parameters that can be used to measure innovativeness in the industries concerned. In this study the only option to properly measure the innovativeness in Turkish movie industry over time was the employment of a proxy variable that is available in the database compiled from the studies conducted by Agah Özgüç and internet. Accordingly, the rewards granted to the movies are taken as a proxy variable in order to measure the innovativeness of the films. Spiro (2008) also uses the ratio of an artist’s prior films nominated for a best picture Academy Award as an independent variable for the measurement of the novelty.
An important issue in relation to the measurement of innovativeness is the prevention of tautological propositions. For example, the success of a film measured in terms of box-office is a good example. The success of a film is usually measured in economic terms by using the box office data (the number of spectators); the higher the number of spectators, the higher the success of film, and vice versa the higher the success of film, the higher the number of spectators. However, the terms “success” can also be a substitute for those movies awarded, albeit some of these salient movies may not have a remarkable number of spectators. Thus, the novelty or innovativeness involved in a movie cannot be measured easily. As this
Figure 8. Continuation of directors via screenwriters in the main component over time. ~ 50.00 -:;: ~ "C C
f
4000 0 c 30.00l
~ ~ CI
20.00 0 () 10.00 0.00- -- - - ~ 1940s-1950s 1950s-1960s 1960s-1970s 1970s-1980s 1980s-1990s 1990s-2000s 2000s-2010s Decades of continuationexample illustrates, box office data of a film is not a suitable variable for innovativeness when compared with the number of rewards granted to the film concerned. In a similar fashion, the number of rewards granted to a film is not a suitable variable for the measurement of its success in traditional sense when compared with the number of spectators watching the film concerned.
In the measurement of the innovativeness of the films, those movies in which only actors or actresses won an award are excluded from the analysis as it is assumed that any award won by an actor or actress is an indicator of the personal artistic success or novelty of the actor or actress concerned, not the film itself. As the agents involved in the production of a movie are available in a detailed context, firstly each film is categorized according to the number of directors and screenwriters who contributed to the production of the film concerned (Table 7).
Consequently, a series of summary tables showing the number of incidences of each category over time has been produced for both the general count of the movies (Table 8) and only those awarded (Table 9). The ratio of Table 9 to Table 8 actually provides us with an index whose value indicates the innovative potential of each category over time (see
Table 10). Accordingly, if the index value is above 1, it shows the fact
that the rate of innovativeness of the category concerned is more than the expected value. Within this context, what is evident from Table 10 is that in general those movies involving more than one screenwriter or one director are more successful in winning an award compared with those having only one director and one screenwriter. The only exception for this observation is the initial (1940s) and terminating decades (2010s).
Table 7. Observed typologies for couplings of directors and screenwriters in the films.
Table 8. Incidences of films according to the couplings of directors and screenwriters.
Type Explanation Type Explanation Type Explanation
II one director one writer 16 one director six writer 24 two director four writer
12 one director two writer 18 one director eight writer 31 three director one writer
13 one director three writer 21 two director one writer 32 three director two writer
14 one director four writer 22 two director two writer 51 five director one writer
15 one director five writer 23 two director three writer 55 five director five writer
Type 1910 1920 1930 1940 1950 1960 1970 1980 1990 2000 2010 Sum II 6 12 18 61 449 1591 1894 1049 380 219 584 6263 12 0 0 0 I 15 49 67 50 58 55 172 467 13 0 0 0 0 4 16 17 13 8 18 31 107 "' " 14 0 0 0 0 0 ::, 6 3 1 1 13 25 ~ 15-18 0 0 0 0 I 0 1 0 0 0 8 10 ~ ::, 21 2 0 0 3 9 11 9 5 4 14 30 87 £ 22 0 0 0 0 2 I 4 3 I 4 18 33 .D ..,: 31-32 0 0 0 0 I 0 0 0 0 0 1 2 51 0 0 0 0 0 0 0 0 0 0 I Sum 8 12 18 65 482 1669 1999 1124 452 313 857 6999 II 75.0 100.0 100.0 93.8 93.2 95.3 94.7 93.3 84.1 70.0 67.7 89.4 12 0.0 0.0 0.0 1.5 3.1 2.9 3.4 4.4 12.8 17.6 20.0 6.7 13 0.0 0.0 0.0 0.0 0.8 1.0 0.9 1.2 1.8 5.8 3.6 1.5 "' " 14 0.0 0.0 0.0 0.0 0.2 0.0 0.3 0.3 0.2 0.3 1.5 0.4 cl) l:! = 15-18 0.0 0.0 0.0 0.0 0.2 0.0 0.1 0.0 0.0 0.0 0.9 0.1 " ~ 21 25.0 0.0 0.0 4.6 1.9 0.7 0.5 0.4 0.9 4.5 3.5 1.2 " Q.. 22 0.0 0.0 0.0 0.0 0.4 0.1 0.2 0.3 0.2 1.3 2.1 0.5 31-32 0.0 0.0 0.0 0.0 0.2 0.0 0.0 0.0 0.0 0.0 0.1 0.0 51 0.0 0.0 0.0 0.0 0.0 0.0 0.0 0.0 0.0 0.3 0.0 0.0
Thus, it seems that the possibility of winning an award tend to increase with the increasing number of particularly screenwriters involved in the production of a movie.
Apart from those analysis, the creativeness of the agents has also been tested against their centrality in the network with an expectation that those occupying a central or key position can be more innovative compared with those located at the margin of the network. This expectation stems from the fact that those subject to more relations with other agents in the network or occupying a key position in terms of diffusion of information may benefit from a wider range of ideas that contribute to the creativeness of the final product. Based on these expectations two measures of centrality are calculated for the categories of the agents defined above. The first one is the degree centrality that is the total number of edges incoming or outgoing from a node. The second centrality measure used in this study is the betweenness centrality that reveals the nodes occupying a key position in the network.
In addition to these centrality measures, innovativeness of the agents is also checked against their k-core score. Since the k-core analysis reveals the core and periphery of a network, it can be argued that probability of those agents having low k-core scores (furthest from the core) to make novel films will be very high owing to their insecure positions allowing them to pursue risky behavior (Spiro, 2008). Based on this, the expectation that
Table 9. Incidences of films winning an award according to the couplings of directors and screenwriters over time (excluding the movies in which awards won only by actors or actresses).
Table 10. Density quotient of the films winning an award according to the couplings of directors and screenwriters over time.
Type 1910 1920 1930 1940 1950 1960 1970 1980 1990 2000 2010 Sum II 0 0 9 40 50 69 41 58 87 356 12 0 0 0 0 0 4 5 6 24 12 26 77 13 0 0 0 0 2 2 2 4 3 6 2 21 ~ " Cl 14 0 0 0 0 0 0 0 I I 0 0 2 ~ 15-18 0 0 0 0 0 0 0 0 0 0 " :5 21 0 0 0 0 0 I 0 I 4 3 10 ~ .,:;; 22 0 0 0 0 0 0 0 0 2 2 5 .,: 31-32 0 0 0 0 0 0 0 0 0 0 I 51 0 0 0 0 0 0 0 0 0 I 0 Sum 0 0 14 47 58 80 70 83 120 474 II 0.0 0.0 100.0 100.0 64.3 85.1 86.2 86.3 58.6 69.9 72.5 75.1 12 00 00 0.0 0.0 00 8.5 8.6 7.5 34.3 14.5 21.7 16.2 13 0.0 0.0 0.0 0.0 14.3 4.3 3.4 5.0 4.3 7.2 1.7 4.4 ~ " cJ) 14 0.0 0.0 0.0 0.0 0.0 0.0 0.0 l.3 1.4 0.0 0.0 0.4 1'l = 15-18 0.0 0.0 0.0 0.0 7.1 0.0 0.0 0.0 0.0 0.0 0.0 0.2 " 2 21 0.0 0.0 0.0 0.0 0.0 2.1 1.7 0.0 1.4 4.8 2.5 2.1 " 0. 22 0.0 0.0 0.0 0.0 7.1 0.0 0.0 0.0 0.0 2.4 1.7 I.I 31-32 0.0 0.0 0.0 0.0 7.1 0.0 0.0 0.0 0.0 0.0 0.0 0.2 51 0.0 0.0 0.0 0.0 0.0 0.0 0.0 0.0 0.0 1.2 0.0 0.2 TyQe 1910 1920 1930 1940 1950 1960 1970 1980 1990 2000 2010 Sum II 0.0 0.0 1.0 I.I 0.7 0.9 0.9 0.9 0.7 1.0 I.I 0.8 12 0.0 0.0 2.9 2.6 1.7 2.7 0.8 I.I 2.4 13 17.2 4.5 4.0 4.3 2.4 l.3 0.5 2.9 14 0.0 0.0 4.9 6.3 0.0 0.0 I.I 15-18 34.2 0.0 0.0 1.4 21 0.0 0.0 0.0 3.2 3.8 0.0 1.6 I.I 0.7 1.7 22 17.1 0.0 0.0 0.0 0.0 1.9 0.8 2.3 31-32 34.2 0.0 7.0 51 3.8 14.0 Sum 0 0 1.0 1.0 1.0 1.0 1.0 1.0 1.0 1.0 1.0 1.0
innovation can be observed in the outer periphery can easily be justified. Accordingly, in this study it is assumed that in the case of the k-core analysis one can observe innovative firms at the fringe of the network rather than in between locations or central locations that are subject to an influx of ideas and knowledge.
It is evident from Table 11 showing the average degree and betweenness centralities, and k-core scores of the groups of agents involved in the production of films that those directors involved in a movie winning an award have usually higher average centralities and k-core scores compared with those others having no affiliation with a movie winning an award over time. The highest level of association between the centrality measures and creativeness is particularly observed for the three decades between 1950 and 1980. As it is discussed in the previous sections, during these decades, the movie industry experienced its take-off, growth and maturity stages. For almost all centrality measures, in the era of post-maturity (1980s) average centrality values of innovative agents fall below the average of those of non-innovative ones. A similar kind of trend can also be observed for the last decade described as the era of pre-resurgence.
The expectation that those agents having low k-core scores may also have innovation potential can be considered as an explanation for the particular situation observed in the eras of post-maturity (1980s) and pre-resurgence (2010s). Indeed, in 1980s the dominant pattern starts to dissolve, that may lead to, on the one hand, decreasing importance of the core, and on the other hand, increasing risk taking behavior of the periphery. A similar kind of argumentation can also be produced for 2010s by claiming that, on the one hand, the new nucleus of the network is not mature enough to cultivate the positional advantage of the agents, and on the other hand, risk taking behavior can be considered as a typical act of pre-resurgence era to try new things. Nonetheless, the explanations produced for the innovativeness of the
Table 11. Average centralities and the k-core scores of the directors according to their involvement in a movie winning an award and their couplings with screenwriters over time.
Era couplings of directors with screenwriters with without mean 1/2
II 12 13 14 16 21 22 32 51 award(!) award (2) value
1940 2.00 2.00 1.80 1.81 I. II 1950 54.20 62.00 171.00 28.00 20.33 53.91 8.11 12.69 6.65 1960 961.11 2928.00 814.00 1047.76 304.61 407.96 3.44 " 1970 817.54 304.00 473.50 726.13 209.01 293.33 3.47 ~ ;!' 1980 80.50 438.50 45.50 3.00 92.66 119.50 113.10 0.78 0 1990 1.36 2.82 5.00 1.00 2.26 2.66 2.53 0.85 2000 1.02 0.25 1.25 3.33 2.00 9.00 1.75 0.83 1.17 2.10 2010 0.43 0.42 0.50 0.43 1.30 1.23 0.33 1940 0.00 0.00 0.05 0.05 0.00 1950 124.28 407.33 426.89 0.00 17.58 137.12 10.41 23.08 13.17 ~ 1960 68.58 102.64 69.22 70.23 35.75 40.54 1.96 " C: 1970 111.35 130.61 13.08 107.37 41.18 51.97 2.61 C: " " 1980 20.66 264.19 90.31 0.00 38.83 52.98 49.61 0.73 i " 1990 8.89 49.79 286.00 736 0.00 48.07 16.12 26.23 2.98 O'.l 2000 0.51 0.00 3.00 0.00 0.00 0.80 0.54 0.24 0.35 2.22 2010 0.46 0.08 0.35 6.91 6.38 0.05 1940 2.00 2.00 0.65 0.71 3.08 1950 5.20 9.00 4.00 9.00 6.67 6.18 1.74 2.18 3.55 1960 25.00 34.00 34.00 25.86 11.62 13.60 2.23 ~ 1970 25.92 12.50 16.50 23.50 11.42 13.39 2.06 0