IMPACT OF POTASSIUM FERTILIZER IN GROWTH AND
YIELD OF SOME PEA(
Pisum sativum L
.) VARIETIES UNDER
SULAYMANIYAH –IRAQ CONDITIONS
BEKHAL OMAR
MASTER THESIS
Field Crops
DİYARBAKIR MARCH-2016
REPUBLIC OF TURKEY
UNIVERSITY OF DICLE
IMPACT OF POTASSIUM FERTILIZER IN GROWTH AND
YIELD OF SOME PEA(
Pisum sativum L
.) VARIETIES UNDER
SULAYMANIYAH –IRAQ CONDITIONS
BEKHAL OMAR
MASTER THESIS
Field Crops
DİYARBAKIR MARCH-2016
FEN BİLİMLERİ ENSTİTÜSÜ MÜDÜRLÜĞÜ DİYARBAKIR
Bekhal OMAR tarafından yapılan “Impact of Potassium Fertilizer in Growth and Yield of Some Pea (Pisum sativum L.) Varieties under Suleymaniyah-Iraq Conditions.” konulu bu çalışma , jürimiz tarafından Tarla Bitkileri Anabilim Dalında YÜKSEK LİSANS tezi olarak kabul edilmiştir
Jüri Üyesinin
Ünvanı Adı Soyadı Başkan: Doç.Dr. Veysel SARUHAN Üye : Prof.Dr. Behiye Tuba BİÇER Üye : Doç.Dr. Kağan KÖKTEN
Tez Savunma Sınavı Tarihi: 15/03/2016
Yukarıdaki bilgilerin doğruluğunu onaylarım. / /2016
Doç.Dr.Mehmet YILDIRIM ENSTİTÜ MÜDÜRÜ
ACKNOWLEG MENT
This pace of work will never be accomplished without our God Almighty with his blessing his power that works within me.
I would like to express my most scene appreciation and thanks to my supervision Dr. Veysel Saruhan for this supervision. Encouragement. Volume advice and guidance during the writing of this thesis.
Appreciation and highly grateful are also expressed to Dr. Mehmet yilidirm dean of the faculty of agricultural science.
Special thanks and appreciation are due to prof.Dr. Shirawan Esmael Tawfiq the coadvisor for his support. Advice and helps during my work and helps in statistical analysis.
A special gratitude I give to my husband's Dr. Aram omar for his supported and valuable remarks and help during my work.
Thanks and appreciations are also toDR.Dana azad and to my friend Bano Yasin, M. Bestwn O. Rashid. M. Bestwn Ali. Oral Mwsa, Lazyan Qadir. Mr. Sabah. And all staffs of Qlyasan Research Station for the help and for all facilitate that provided me during working in their station.
I would like my father, mother, brother and sister as they are simply perfect. I have no stable word that can fully describe the over lasting love to me for their help, sacrifice and tremendous support.
ABSTRACT III ÖZET IV LIST OF TABLES V 1 INTRODUCTION……… 1 2 LITERATURE REVIEWS……… 4 2.1 Potassium………. 4 2.2 Varieties……… 10
3 MATERIALS AND METHODS……….. 14
3.1 Materials……….. 14 3.2 Methods……… 14 3.3 Soil properties……….. 14 3.4 Studied Characters……… 16 3.4.1 Root Characters……… 16 3.4.2 Growth Characters……… 16
3.4.3 Forage Yield Characters……….. 17
3.4.4 Yields and its Components……….. 17
4 RESULTS AND DISCUSSION……… 19
4.1 The varians analysis of the growth character……….. 19
4.1.1 The effect of Potassium fertilization on growth characters………. 20
4.1.2 The Average of growth characters for pea varaieties………. 22
4.1.3 The interaction effect of potassium fertilizer and varieties on growth characters………
24
4.2 The Varians analysis of root characters……….. 25
4.2.1 The effect of Potassium fertilization on root characters………. 26
4.2.2 The differences among pea varieties in root characters………. 27
4.2.3 The interaction effect of potassium fertilizer and varieties on root characters……… 29
4.3 The variance analysis of yield and its components……….. 32
4.3.1 The effect of Potassium fertilization on yield and its components……….. 33
4.3.2 The differences among pea varieties in yield and its components………… 35
4.3.3 The interaction effect of potassium fertilizer and varieties on yield and its components……….. 38
4.4 The variance analysis of plant forage wieght……….. 41
4.4.1 The effect of Potassium fertilization on Plant forage weight(g)……….. 42
4.4.2 The means of plant forage weight for pea varieties………. 43
4.4.3 The interaction effect of potassium fertilizer and varieties on plant forage weight. 44 4.5 Calculated (t) for the correlation coefficient at autumn and spring season………. 45
4.5.1 Correlation Coefficient at autumn season……….. 46
4.5.2 Path Coefficient Analysis at autumn season………. 47
4.5.3 Correlation Coefficient spring season……….. 47
4.5.4 Path Coefficient Analysis spring season……….. 48
5 CONCLUSION……… 51
6 RECOMMENDATION……….. 51
7 REFERENCES……… 52-63
ABSTRACT
IMPACT OF POTASSIUM FERTILIZER IN GROWTH AND YIELD OF SOME PEA(Pisum
sativum L.) VARIETIES UNDER SULAYMANIYAH–IRAQ CONDITIİONS
MASTERS THESİS Bekhal OMAR
DEPARTMENT OF FIELD CROPS
INSTITUTE OF NATURAL AND APPLIED SCIENCES UNIVERSITY OF DICLE
2016
This study was conducted to determine the effects of four potassium applications on five pea varieties for growth and yield components at Qlyasan Research Station, Faculty of Agriculture, University of Sulaimani during the winter season of 2014-2015 and spring season of 2015. Experiment was arranged using a factorial, split-plot design, within a randomized complete block design with three replicates, over two years. Potassium (0, 40, 60 and 80 kg K2O.ha-1) were assigned to main plots and cultivars Avolla, Joneor, Sancho, Green sage, Mamoth) to sub-plots. The effect of potassium fertilizer was significant for all growth characters except number of branches per plant. Root characters respond to potassium fertilizer significantly except the characters root length and nodules dry weight. Seed yield and all its components respond significantly to potassium applications. The growth characters plant high, number of leaves per plant and leaf width responds significantly to varieties effect. The root of fresh weight, number of nodules per plant and nodules dry weight were significant among cultivars. Regards to the second season, the effect of potassium fertilizer was significant in all studied characters except number of branches per plant, number of seeds per pod, biological weight per plant and harvest index. Potassium level of 80 kg K2O.ha-1 showed superior value for most of studied characters.
Keywords: Pea, Pisum sativum L., Potassium, Yield, Yield Components.
BEZELYE (Pisum sativum L.) ÇEŞİTLERİNDE BÜYÜME VE VERİM ÜZERİNE ETKİSİ. YÜKSEKLİSANS TEZİ
Bekhal OMAR DİCLE ÜNİVERSİTESİ FEN BİLİMLERİ ENSTİTÜSÜ TARLA BİTKİLERİ ANABİLİM DALI
2016
Bu çalışma; Süleymaniye Üniversitesi Ziraat Fakültesi Olyasan Araştırma İstasyonunda 2014-2105 kış ve ilkbahar 2015 yılında ise ilkbahar yetiştirme mevsiminde, dört farklı potasyum uygulamasının beş bezelye çeşidinde verim ve verim unsurlarına etkilerinin belirlenmesi amacıyla yürütülmüştür.
Deneme tesadüf bloklarında bölünmüş parseller deneme desenine göre 3 tekerrürlü olarak düzenlenmiş, potasyum uygulamaları (0, 40, 60, 80 kg/ha) ana parselleri, bezelye çeşitleri (Avolla, Joneor, Sancho, Green sage, Mamoth) ise alt parselleri oluşturmuştur.
Potasyum gübrelemesinin, büyüme karakterleri üzerine bitkide dal sayısı hariç tüm karakterlerde önemli bulunmuştur. Bitki kök özelliklerinin potasyum uygulamasına tepkisi kök uzunluğu ve nodül kuru ağırlığı hariç önemli bulunmuştur. Yine tohum verimi ve verim unsurlarının potasyum uygulamalarına etkisi önemli bulunmuştur. Çeşitler arasında kök taze ağırlığı, bitki başına nodül sayısı ve ağırlığı yönünden önemli farklılıklar belirlenmiştir. ilkbahar ekimlerinde potasyum uygulamaları bitkide dal sayısı, baklada tohum sayısı, bitkide biyolojik verim ve hasat indeksi dışında tüm karakterlerde önemli bulunmuştur. 80 kg K2O.ha-1 uygulamasının birçok karakterde en yüksek değer verdiği saptanmıştır.
Anahtar Kelimeler: Bezelye, Pisum sativum L., Potasyum, Verim, Verim Unsurları.
LIST OF TABLE
No Title Page
No
1 Table 3.1. Some physical and chemical properties of soil at Qlyasanlocation. 15 2 Table 3.2. Climatic conditions of Qlyasan location for the saeson 2014-2015. 16 3 Table 4.1. Variance analysis of the growth characters 19 4 Table 4.2.
The average value of the effect of potassium fertilization on
growth characters in pea 20 5 Table 4.3.
The Average of growth characters for pea varaieties. 22 6 Table 4.4. The interaction effect of potassium fertilizer and varieties on
growth characters
24 7 Table 4.5.
The variance analysis of the root characters. 25 8 Table 4.6.
The effect of Potassium fertilization on root characters. 26 9 Table 4.7.
The differences among pea varieties in root characters. 27 10 Table 4.8.
The interaction effect of potassium fertilizer and varieties on root
characters. 29 11 Table 4.9. The variance analysis of yield and its components. 32 12 Table 4.10. The effect of Potassium fertilization on yield and its components. 33 13 Table 4.11. The differences among pea varieties in yield and its components. 35 14 Table 4.12.The interaction effect of potassium fertilizer and varieties on
yield and its components. 38 15 Table 4.13. The variance analysis of plant forage wieght
.
41 16 Table 4.14.The effect of Potassium fertilization on Plant forage weight (g). 42 17 Table 4.15.The means of plant forage weight for pea varieties. 43 18 Table 4.16.The interaction effect of potassium fertilizer and varieties onplant forage weight (g).
44 19 Table 4.17. Calculated (t) for the correlation coefficient. 45 20 Table 4.18. Correlation Coefficient. 46 21 Table 4.19. Path Coefficient Analysis. 47 22 Table 4.20. Correlation Coefficient. 47 23 Table 4.21. Path Coefficient Analysis. 48
1 1.NTRODUCTION
Pea (Pisum sativum L.) is one of the world’s oldest domesticated crops cultivated before 10th and 9th millennia BC (Zohary and Hopf 2000). Field pea comprises both the wild species (P. fulvum and P. eratius) and cultivated species (P.
abyssinicum) is originated from the Mediterranean region, primarily in the Middle East
(Ellis et al., 2011), however the exact center of its diversity is not known yet due to significant change in the areas of origin and loss of passport data of the early accessions,it is a cool season crop grown in many parts of the world, growing best at temperatures of 13 to 18 °C (Petr et al., 2012). To provide enough food for an expanding world population, a massive increase in crop production is required to meet the food demands of future generations, while preserving the ecological and energy related resources of our planet.
Pea is major winter annual crop of temperate regions of the world and was originally cultivated in the Mediterranean basin (Smart, 1990). Its adaptation to relatively cool conditions has enabled its cultivation to spread beyond the area of initial domestication into Europe, Africa, and Asia. In tropical areas, it is cultivated during the cold months (Sardana et al., 2007).
Pea is one of the best known grain legumes in temperate climate because of its universal popularity as a fresh vegetable. The cultivation of pea is very ancient. The origin of the pea is not certain but it would seem that it first entered cultivation in South-West Asia from where it was carried to the rest of the world (Langer and Hill, 1985).
Agricultural production continues to be constrained by a variety of biotic (e.g., pathogens, insects and weeds) and a biotic (e.g., drought, salinity, cold, frost and water logging) factors that can significantly reduce the quantity and quality of crop production (Bray et al., 2000).
Pea is one of the most important grain legumes traditionallycultivated in many regions of the world. The agronomicalimportance of pea is based on its high concentrationof protein, complex carbohydrates, dietary fiber, vitamin sand minerals for the human and animal diet (Nikolopoulou et al., 2007).
1. INTRODUCTION .
2
The pea is full of nutrition because its grain is rich in protein (27.8%), complex carbohydrates (42.65%), vitamins, minerals, dietary fibers and antioxidant compounds (Urbano et al., 2003).
The crop is grown in many countries and currently ranks fourth among the pulses in the world with cultivated area of 6.33 million hectares (FAOSTAT, 2012).
Peas have a very long history as a garden crop and many varieties have been evolved. There are early, second early and main crop varieties of pea that climb almost two meters high and dwarf pea that need little support. Sowing to harvesting time is 11-12 weeks for early varieties, 11-12-13 weeks for second early varieties, and 13-14 weeks for main crop varieties. The size of the plants varies in height from 30 cm for the smallest dwarf varieties to 1.8 m for the taller plants. Pods range from 7.5 cm to 15 cm (Wood, 1979).
Pea is one of the annual herbaceous legume crop belongs to family Fabaceae (Leguminosae). Pea is a self- pollinated cool-season legume or pulse crop and diploid crop having 14 chromosomes (Sato et al., 2010).
Application of recommended dose of (60 kg K2O.ha-1) produced highest yield of pea, the beneficial effects of integrated use of organic manure and inorganic fertilizers on the soil physic–chemical properties and crop yield have also been observed (Bhalarao et al., 2001).
The exists a lot of variation in pea cultivars for different plant characteristics like height, maturity, yield, color and quality of fruit. Cultivars also vary in the adaptability to certain agro-climatic conditions. So it is possible to have a cultivar of better attributes through hybridization (Bakht et al., 2009).
Chemical fertilizers play an important role on plant growth and productivity. Nitrogen is essential for synthesis of chlorophyll, enzymes and protein. Phosphorus is essential for root growth, phospho-proteins, phospholipids and ATP, ADP formation. Potassium plays an important role in the promotion of enzyme activity and enhancing the translocation of assimilates and protein synthesis (Helmy, 2013).
The objective of the present study is to evaluate the performance of five pea varieties under different potassium application levels, to facilitate the selection of
3
varieties appropriate for rainfed region and to determine the optimum level of potassium fertilizer to be applied.
2.LITERATURE REVIEW .
4 2. LITERATURE REVIEW
2.1. Potassium
Boyer and Stout (1959), reported that potassium is essential for N and carbohydrate metabolism, activation of various enzymes and adjustment of stomatal movement and water relations.
Evan et al (1971), confirmed that the potassium application in poorly fertile soil is essential to obtained high yield, since it plays an important role in many processes in plant cells. It has significant role in the activation of more than (60) enzymes which catalyze various metabolic processes.
Das et al (1975), confirmed that the up take and translocation nitrate from roots to shoots.
Srivastava, Verma 1985, Kanaujia et al (1997) and Vorob, (2000) confirmed that the application of NPK to pea crop usually promotes vegetative growth and nodulation, and Naik 1989; Saini and Thakur, 1996; Kanaujia et al., 1997, 1998; Vorob, 2000) indicated to its role in improving green pod yield, while Cutcliffe and Munro, (1980), reported that the vine length tended to increase as the rate of all the three nutrients increased.
Usherwood ( 1985), reported that Potassium is often referred as the quality element for crop production due to its positive interaction with other nutrients (especially with nitrogen) and production practices.
Hadavizadeh (1989), revealed that the good management practices are essential if optimum fertilizer responses are to be realized. These practices include use of recommended pea varieties, good seed bed preparation, proper seeding methods, effective plant insect control. Soil test results, field experience and knowledge of specific crop requirements help to determine the nutrients needed and the rate of application
Halliday (1992), indicated that due attention towards nutrient management is not paid in case of low input and high risk rain fed legume crops, frequently grown in low fertility soils.
5
Martin and Jamieson (1996) reported that water stress during the last half of the growing season (pollination, pod and seed formation periods) was a major factor in reducing seed yields in temperate dry areas. Water stress during seed filling decreased seed yield and quality.
Mullins et al (1996), signified that the nutrients available to plant particularly nitrogen and phosphorus are important constituents of protein and phospholipids. Phosphorus not only enhances the root growth but also promotes early plant maturity.
Mengel and Kirkb (1997), Mentioned that potassium promotes synthesis of photo-synthates and transport to fruits and grains, and enhances their conversion into starch, protein, vitamins, oil etc.
Sharma et al (1997) and Mishra (1999), found that pod yield increased by 60 kg P2O5 ha-1 in pea and cowpea, respectively, with no further significant increase at the higher P rate. Application of potassium also enhanced vegetative growth and increased pod yield in pea (Kanaujia et al., 1997 & 1998), in cowpea (Jamadagni and Birari, 1994) and in French bean (Kanaujia et al., 1999) with increasing K2O rate up to 60 kg ha-1.
Kanaujia et al (1997) also found that growth increased significantly with increasing levels of potassium (0, 30, 60 or 90 kg ha-1). Mean values for potassium revealed that maximum number of pods were obtained from the plants received K2O 150 kg ha-1. Minimum number of pods was recorded in those plants, which received no potassium. They reported that effects of P, K and rhizobium on growth yield and quality of pea and found significant growth and nodulation increase with the increasing of P and K levels and confirmed that the level of 60 kg P and K ha-1 was the best. Climax gave better seed yield 2.24 tons as compared to Meteor with 2.33 tons ha-1seed yield. Treatment, irrigation up to seed filling + P 120 kg ha-1+ K 100 kg ha-1 (T3) was found at the top with 2.63 tons ha-1 seed yield, followed by (T2) with 2.33 tons ha-1 while control (T0) was found at the bottom with 2.02 tons ha-1, respectively. As far as seed vigor tests showed that irrigation up to seed filling + P 120 kg ha-1+ K 100 kg ha-1 (T3) was better for both cultivars.
2.LITERATURE REVIEW .
6
Patel et al (1998), stated that peas cv. “Arbel” significantly increased in plant height, number of branches, leaves per plant, number of pods per plant, grains per pod and pod yield when applied 20 kg N ha-1 + 80 kg P ha-1 + 40 kg K ha-1. They reported that significantly increased plant height, number of branches, leaves per plant, number of pods per plant, grains per pod and pod yield were observed when applied 20 kg N ha -1
+ 80 kg P ha-1 + 40 kg K ha-1 was applied.
Kanaujia et al (1999) had reported that when 0, 30, 60 or 90 kg K2O ha-1 was applied to French bean, number of pods per plant increased with increasing K rates up to 60 kg ha-1. Regarding effect of potassium levels, it is interesting that the plants received 100 kg K ha-1 induced maximum pod length and stood atpar with the plants received 150 kg K ha-1, and they reported increase in pod length of French bean with increasing K up to 60 kg ha-1.
Klír (2000), reported that nutrients balance is a suitable way to quick diagnosing of nutrients management. The nutrients balance at the side of inputs, except for the biological nitrogen fixation depends on the commercial and organic fertilizers, seeds and atmospheric deposition of nitrogen and potassium. The side of outputs is the output of nutrients by grain and straw yields. Balance of items depends on the used method.
Vorob (2000), recorded positive effect of joint applications of phosphorus and potassium on growth and yield of peas. Phosphorus and potassium balance in condition without mineral fertilization was negative.
Kakar et al (2002), comfirmed that the maximum plant height (46.30 cm), number of branches plant-1 (5.60), number of pods plant-1 (33.10), pod length (8.49 cm), seed per pod (6.00), pod yield per plant (188.43 g) and total marketable green pod yield per hectare ( 5.01 t ); were recorded in treatment 75-120-120 or 75-120-0, kg NPK ha-1, which displayed maximum green pod yield due to increase in pod plant-1 and pod length. It was further noted that an additional K did not increased the yield.
Akhtar et al (2003), confirmed that the combined effect of P2O5 and K2O is concerned, it significantly influenced the pod length and green pod yield. Maximum pod length was attained when 69 or 46 kg P2O5 ha-1 was applied in combination with 100 or 150 kg K2O ha-1. Green pod yield was maximum at 69 kg P2O5 ha-1 100 or 150
7
kg K2O ha-1. 100 kg K2O ha-1 resulted in maximum grains per pod, closely followed by 150 kg K2O ha-1.
Amjad et al (2004), stated that the application of K2O to the crop had significant positive influence on seed yield, 1000 seed weight and percentage of large sized seeds up to the dose of 100 kg ha-1. Time taken to complete 50 % germination and electrical conductivity of seed leachates were also affected significantly being minimum at the dose of 100 kg K2O ha-1.
Saeed et al (2004), reported that there was a linear increase in yield response for all the three genotypes from 0-0-0 to 35-87.50-00 kg NPK ha-1, it decreased thereafter with the increase in fertilizer dose. The differences among the varietal means were non-significant during first year, while they were non-significant during the second year of study. Whereas, the application of fertilizer dose of 35-87.50-00 kg NPK ha-1 to gram genotype (K-90395) proved to be the best under the present experimental conditions.
Ezzat et al (2005), indicated that owing to its role in many biochemical processes such as protein synthesis and carbohydrate metabolism. However, the highest growth yield, yield components, protein, N and K contents of the plant and seeds of legumes crop were obtained by adding 360 kg/fed natural rock potassium (feldspar) and no significant increase with recommended treatments .
Singh et al (2006), calculated that the number of pod per plant and fresh vegetable pod yield were significantly higher when the crop was additionally treated with S, Fe and Mo as compared to only recommended N, P, K application. This may be due to the effect of sulphur, Fe and Mo in improving the assimilation of photosynthesis per unit leaf area due to higher chlorophyll content and enzyme activity .The total fresh weight per plant was significant only when compared between added nutrition and no nutrition for pea cultivation. The fresh root weight per plant was significantly higher when Fe was foliar sprayed together with Sand N, P, K recommended dose. The effect of different nutrition and its level on nodule weight and nodule number was significant.
Mohammad Janloo et al (2009), calculated that the application of 50 kg N ha-1 fertilizer significantly increased the number of secondary branches per plant, number of filled pod per plant, total number of pod, seed number per plant and seed yield.
2.LITERATURE REVIEW .
8
Maximum seed yield was achieved when 50 kg N ha-1 fertilizer applied. Potassium fertilizer had no significant effect on the above mentioned traits.
Danilovic and Soltysova (2010), recorded that the deficit of phosphorus represented 8.53 kg ha-1 year-1 (15.96 %) and deficit of potassium represented 9.24 kg ha-1 year-1 (59.08 %), despite the negative balances of phosphorus and potassium (in conditions without mineral fertilization).
Ashraf et al (2011) reported that the irrigation up to seed filling + P 120 kg/ ha + K 100 kg/ha showed better performance for vegetative and reproductive parameters similarly highest seed yield 2.63 t/ha were found in this combination for both cultivars of pea as compared to other combinations. They stated that the different chemical composition tests of leaves, stems and pods were observed it was found that Climax cultivar was better as compared to Meteor. It is concluded that seed vigor of Climax cultivar with irrigation up to seed filling + P 120 kg/ha+ K 100 kg/ha gave better results as compared to other levels of phosphorus, potash and Irrigation.
Shakoor Khanday et al (2012), ratified that the application of the recommended dose of NPK through fertilization gave significantly higher pod yield than all other interactions.
Helmy (2013), calculated that the application of K2O to the crop up to the dose of 100 kg/ha had significant positive effect on all the parameters studied, beyond this dose further application of K2O was ineffective. As combined effect of P2O5 and K2O is concerned, it significantly influenced the pod length and green pod yield. Maximum pod length was attained when 69 or 46 kg P2O5 ha-1 was applied in combination with 100 or 150 kg K20 ha-1. Green pod yield was maximum at 69 kg P2O5 ha-1 x 100 or 150 kg K2O ha-1.
Wang et al ( 2013), indicated to the emerging role of K in defending against a number of biotic and abiotic stresses including diseases, pests, drought, salinity, cold and frost and water logging. The availability of K and its effects on plant growth, anatomy, morphology and plant metabolism are discussed. The physiological and molecular mechanisms of K function in plant stress resistance are reviewed. This article also evaluates the potential for improving plant stress resistance by modifying K
9
fertilizer inputs and highlights the future needs for research about the role of K in agriculture.
Negash and Mulualem (2014), revealed that the grain yield of field pea was significantly affected by ploughing frequency and weeding frequency. The highest seed yield was attained by ploughing twice, weeding once and applying 100 kg ha-1 of DAP fertilizer. Field pea and other grain legumes, like lentil and chick pea, are commonly cultivated in rotation with cereal grains. The crop is also known to enhance soil fertility by forming a symbiotic relationship with Nitrogen fixing micro organisms in the soil.
Mishra (2014), reported that the pea plant can readily absorb and utilize the nutrients and express the highest value in all characters and finally the pod yield under combined application of organics and in organics.
2.LITERATURE REVIEW .
10 2.2. Varieties
Zain et al (1983), Cawood (1987), reported that the semi-leafless pea genotypes with reduced plant height had better light interception and canopy aeration than normal leaf types .
Berry (1985), Snoad (1985), Armstrong (1989), showed increased dry matter partitioning to fruits, improved water use efficiency and decreased susceptibility to fungal diseases
Heath and Hebblethwaite (1985b), reported that the improved standing ability of semi-leafless pea was the main reasing to emphasize its popularity .
Cote et al (1992), reported that the ability of semi-leafless cultivars to withstand lodging and disease and the fact that their morphology allows better aeration within the canopy, have all contributed to their commercial importance.
Martin et al (1994), confirmed that the first commercial cultivars of semi-leafless pea were released in the early 1980s.
Wang et al (1998) Grosjean et al (2000); Morrison et al ( 2007); Nalle et al (2011) reported that field pea trypsin inhibitors could be different among genotypes and field pea genotypes with low trypsin inhibitors would be more suitable for use as animal feed .
Zohary and Hopf, (2000) reported that field pea (Pisum sativum L.) is one of the world’s oldest domesticated crops cultivated before 10th
and 9th millennia BC, there are two main leaf types in field pea. One has normal leaves; the second type is the semi-leafless type that has modified leaflets reduced to tendrils with vine lengths of two to four feet.
Cruz-Suarez et al (2001), Thiessen et al (2003); Allan and Booth (2004); Adamidou et al (2009), reported that field peas has been used in production of concentrated feed for aquaculture, (Brand et al., 2000; Stein et al., 2004; Petersen and Spenser, 2006) pigs, Wiryawan and Dingle, 1999; Nalle et al., 2011) poultry and Bednar et al; 2001, De-Oliveira et al., 2008; Carciofi et al., 2008) pets like dogs and cats.
11
Vargas et al (2001), reported that the genotype × environment interaction, defined in this case as the different phenotypic response of genotypes to environmental changes .
Kakar et al (2002), reported that the characteristics of a cultivar as well as combination of traits differ according to climatic conditions of the localities.
May et al (2003), indicated that in semi-leafless cultivars, the leaflets are replaced with tendrils, the end result being less leaf area but better resistance to lodging.
Singh et al (2006), calculated that the pod length and number of grain per pod were significantly higher in Azad P-1 and Azad P-3 over Arkel. Average pod weight was higher in Azad P-1 followed by Azad P-3 and Arkel. The grain yield was significantly higher in Azad P-1 (13.48 q ha-1) followed by Azad P-3 (11.87 q ha-1) and Arkel (9.77 q ha-1). The fresh pod yield was significantly higher in Azad P-1 (96.2 q ha -1
) at par to Azad P-3 followed by Arkel. The total fresh weight per plant was non-significant, but fresh root weight plant-1 was significantly lower in Arkel and at par to Azad P-1, Azad P-3. The genotypic effect on nodule number per plant was not significant but nodule weight per plant was significantly higher in Azad P-1 (6017 mg) over Arkel (394.6 mg) and Azad P-3 (323.2 mg) that essentially indicated the higher N-fixation capacity of Azad P-1 variety over Arkel and Azad P-3.
Bozoglu et al (2007), noticed that all the observed characteristics showed statistical difference among cultivars. Dry seed yields varied between 1328 and 2724 kg K2O ha-1. Highest dry seed yield was obtained from Bolero. Bolero, Agromar AG 7306, Feltham First, Jumbo, Sprinter, Sugar Bon and Vilmoren which are recommended for sowing in autumn, particularly for their high seed yield which can be greater than 2000 K2O ha-1. Agromar AG 7306, Vilmoren and Jumbo didn’t respond to change of sowing time.
Reza et al (2007), found that the different phenotypic response of genotypes to environmental change cannot be explained by the genotype and the environment main effect, unless it is considered along with G × E interaction effects .
2.LITERATURE REVIEW .
12
Kibe and Kamithi, (2007); Shirtliffe and Johnston, (2002); Dahmardeh et al (2010), reported that the cultivars had significant effect on full pod number, total pod number, seed number, and seed yield. Plant height, first pod height, total pod number and seed yield were affected by plant densities. The SPRING Cultivar with plant density of 40 plant m-2 may be suggested for winterly pea grown in the Mediterranean-type conditions. Earlier studies show that seeding rate and cultivar are important factors affecting yield and quality of grain legumes.
Bilgili et al (2010), found that the forage yield of the pea genotypes averaged 26605 kg ha-1 and the highest yield were obtained from the leafed genotype Urunlu. Its forage yield reached to 35970 kg ha-1 yield level at Samsun location.
Ellis et al (2011), reported that field pea comprises both the wild species (P.
fulvum and P. eratius) and cultivated species (P. abyssinicum) is originnated from the
Mediterranean region, primarily in the Middle East.
Turk et al (2011), reported that Two semi-leafless cultivars (Ulubatli and Kirazli) and two leafed cultivars (Golyazi and Urunlu) were investigated. Plant height, plants number per m2, seeds number per pod, lodging scores, 1000 seed weight, forage yield, DM yield, seed yield, forage CP yield and seed CP yield were determined. According to two years averages, Golyazi had the highest 1000 seed weight, forage yield, DM yield, seed yield, forage CP yield and seed CP yield. Semi-leafless pea cultivars (Ulubatli and Kirazli) had significantly better standing ability than normal leaf cultivars (Urunlu and Golyazi). Increasing seed rates resulted in an increase in plants per m2, lodging scores, forage yield, DM yield and forage CP yield; however, increasing seed rates caused decrease in seeds pod-1and seed CP yield in two years averages.
Petr et al (2012), indicated that the exact center of its diversity is not known yet due to significant change in the areas of origin and loss of passport data of the early accessions.
Rodrigues et al (2012), concluded that all 10-field pea genotypes are an excellent feedstuff for ruminants and non-ruminants animal and it could be supplied as plain or included in concentrate feed because it is an excellent protein and energy supplement. It combines in the same grain high levels of crude protein and starch. Due to the low fat content is a very interesting pulse for pets’ light diets. They reported that the nutritional
13
composition of field peas is well documented; however antinutritional factors are depending on field pea genotype. It could be useful for accurate feed formulation because interaction of cultivars, soil, climate and agronomic factors can cause appreciable differences in nutrients profiles between locally grown gradients and those available around the world.
Shahid et al (2012), signified a significant correlation was found between the root/shoot dry weight and leaf K+/Na+ and Ca+2/Na+ ratios. Based on the percent increase or decrease over control for the measured attributes, the tested pea genotypes were categorized into less salt tolerant, intermediate and high salt tolerant groups at seedling stage.
Habtamu and Million (2013), found out that genotypes differed significantly in respect to phonological, yield and some yield related traits were highly influenced by the environment. Large magnitude of variability among the genotypes contributed to pod length and reaction to Ascochyta blight.
Khan et al ( 2013), calculated that the maximum pod yield was noted in 2001-55 (10.43 t ha-1) followed by FS-21-87 (9.52 t ha-1). Genotype 2001-55 also excelled in number of seeds per pod (8.56) and pod length (9.33 cm). Maximum plant height was observed in Shareen (125.7 cm) against minimum plant height (65.57 cm) in genotype 2001-55. Maximum 100- seed fresh weight (49.50 g) was noted in FS-21-87 followed by 2001-55 (46.00 g) and check Climax (40.0 g) against minimum in genotype DMR-4 (20.20 g). On the basis of overall performances, genotypes 2001-55 and FS-21-87 are recommended for further evaluation.
Poltronieri et al ( 2013), reported that legumes play an increasing role in mixed cropping systems, crop rotations and as target crops for food, livestock feeding and in human diets. Among grain legumes, the most important protein-rich crops are peas. The availability of early varieties favors the production of grain pea in shorter periods, after the end of rainy seasons and before the long periods of pre summer drought .
3. MATERIALS AND METHODS .
14 3. MATERIALS AND METHODES 3.1. Materials:
Five pea varieties, namely Avolla, Joneor, Sancho, Green sage, Mamoth, were were evaluated at Qlyasan Agricultural Research Station, Faculty of Agricultural Science, University of Sulaymani located (latitude 350 34' 307", N, longitude 450 21' 992" Ealtitude 765 m2 KM North west of Sulaymaniyah city), during two seasons winter season of (2014-2015) spring season (2015).
3.2. Methods
The experiment conducted Randomized Block design (CRBD) in split plot design and replicated three times. The potassium fertilizer levels (0, 40, 60, 80 kg K2O ha-1) were implemented in main plots. The pea varieties allotted in sub plots, sowing was conducted during (November 26, 2014) and spring season (January 25, 2015) each sub plots consist of 5 rows. The recommended dose of fertilizer was used 40 kg N/ha and 40 kg P2O5 ha-1. All required agricultural practices were used as needed. The experiment were harvested for seed yield at maturity on (May 17, 2015).
3.3. Soil properties:
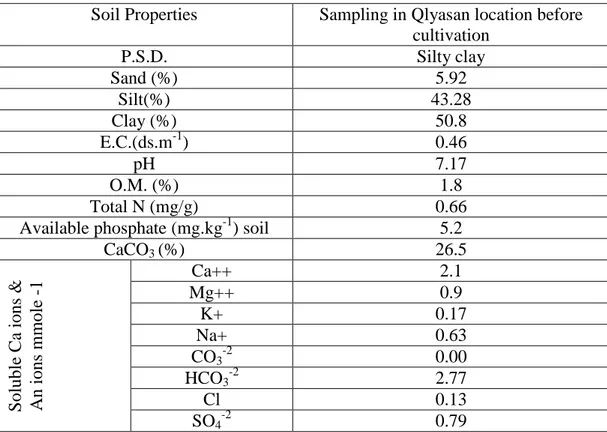
The representative soil sample were taken from the field before tillage at 0-30 cm depth, were air dried then sieved using 2 mm sieves and packed to analysis. Some physical and chemical properties were analyzed at Soil and Water Sciences Department, Faculty of Agricultural Sciences, University of Sulaimani, as shown in Table 3.1.
a- Particle size distribution (PSD) was determined according to the international pipette method.
b- Soil reaction pH was determined by using a (LCE portable) pH-meter. c- Cation exchange capacity (CEC) was determined by using an ion exchange
process method
d- Electrical conductivity was measured by using EC-meter (model PW9525, Philips Company).
15
g- Total N was determined by Micro Kjeldeal method
h- Calcium carbonate (CaCO3) was determined by the titrimetric method i- Ca+2& Mg+2 were determined by EDTA titrymetry (Jakson, 1958). j- K+ and Na+ were determined by using (Corning 400 flame photometer). k- CO3= and HCO3= were determined by titration method using (0.01N HCL) l- Cl- was determined by titration with (0.01N AgNO3), SO4= was determined
by titrimetric method using (0.01N EDTA).
Table 3.1. Some physical and chemical properties of soil at Qlyasan location.
Soil Properties Sampling in Qlyasan location before cultivation P.S.D. Silty clay Sand (%) 5.92 Silt(%) 43.28 Clay (%) 50.8 E.C.(ds.m-1) 0.46 pH 7.17 O.M. (%) 1.8 Total N (mg/g) 0.66 Available phosphate (mg.kg-1) soil 5.2
CaCO3 (%) 26.5 S olubl e C a ions & An ions m mol e -1 Ca++ 2.1 Mg++ 0.9 K+ 0.17 Na+ 0.63 CO3-2 0.00 HCO3-2 2.77 Cl 0.13 SO4-2 0.79
3. MATERIALS AND METHODS .
16
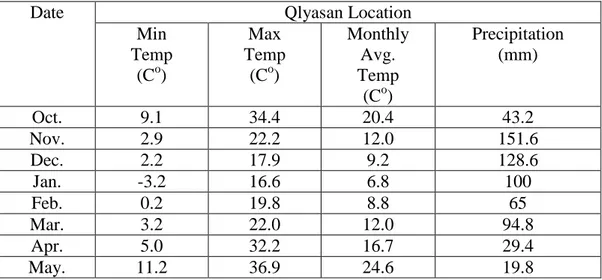
Table 3.2. Climatic conditions of Qlyasan location for the season 2014-2015.
3.4 Studied Characters
The following characters were studied in our investigation.
3.4.1 Root Characters
1. Root length plant-1 (cm): Measured from crown level to the top of the main root.
2. Root fresh weight plant-1 (g): The mean of root fresh weight plant-1 for the five plant samples was recorded in each plot.
3. Root dry weight plant-1 (g): The mean of root dry weight perplant for the five
plant sampleswas recorded for each plot.
4. No. of nodules plant-1: The mean of number of nodulesperplantfor the five plant
sampleswas recorded for each plot.
5. Nodules fresh weight plant-1 (g): The mean of nodules fresh weight of the five
plant samples was recorded in each plot.
6. Nodules dry weight plant-1 (g): The mean of nodules dry weight perplant of the
five plant samples was recorded in each plot.
3.4.2 Growth Characters
1. Plant height (cm): Mesured from the soil surface to the top of the plant.
2. No. of branches plant-1: The mean number of branches perplant of the five plants
was recorded in each plot.
Date Qlyasan Location Min Temp (Co) Max Temp (Co) Monthly Avg. Temp (Co) Precipitation (mm) Oct. 9.1 34.4 20.4 43.2 Nov. 2.9 22.2 12.0 151.6 Dec. 2.2 17.9 9.2 128.6 Jan. -3.2 16.6 6.8 100 Feb. 0.2 19.8 8.8 65 Mar. 3.2 22.0 12.0 94.8 Apr. 5.0 32.2 16.7 29.4 May. 11.2 36.9 24.6 19.8
17
4. Leaf fresh weight plant-1 (g): The mean of leaf fresh weight perplant of five the
plant samples was recorded in each plot.
5. Leaf dry weight plant-1 (g): The mean of leaf dry weight per plant of the five
plant samples was recorded in each plot.
6. Stem fresh weight plant-1 (g): The mean of stem fresh weight per the plant of
five plant samples was recorded in each plot.
7. Stem dry weight plant-1 (g): The mean of stem dry weight per plant of the five
plant samples was recorded in each plot.
3.4.3 Forage Yield Characters
1. Plant fresh weight (ha-1): The mean of plant fresh weight of the five plant
samples was recorded in each plot (g plant-1) and converted to (t ha-1).
2. Plant dry weight ( ha-1): The mean of plant dry weight of the five plant samples
was recorded in each plot (g plant-1) and converted to (t ha-1).
3.3.4 Yields and its Components
1. No. of pods plant-1: The mean of number of pods per plan of the five plant
samples was recorded in each plot.
2. Weight of pods plant-1 (g): The mean of weight of pods per plan of the five plant
samples was recorded in each plot.
3. Pod length plant-1 (cm): The mean of pods length per plan of the five plant
samples was recorded in each plot.
4. No. of seeds pod-1: The mean of number of seeds per pod of the five plant
samples was recorded in each plot.
5. Weight of seeds pod-1 (g): The mean of weight of seeds per podof the five plant
samples was recorded in each plot.
6. Weight of seeds plant-1 (g): The mean of weight of seeds per plan of the five
plant samples was recorded in each plot.
3. MATERIALS AND METHODS .
18
8. Biological weight plant-1 (g): The mean of fresh weight of the five plant samples
without the roots was recorded in each plot.
9. Harvest Index: Measured by separating the seeds from straw yield and weighed to calculate the H. I. according to the following equation:
10. Seed yield (kg ha-1): The mean of seeds weight of the five plant samples was
recorded in each plot (g plant-1) and converted to (Kg ha-1).
100 .% . yield organ economical Total biomass vegetative Total yield organ economical Total I H
19 4. RESULTS and DISCUSSIONS
The results of variance analysis for the effect of potassium fertilizer on pea cultivars for growth characters given Table 4.1.
Table 4.1. Variance analysis of the growth characters. Autumn season S. O. V. d.f M.S Plant height (cm) No. of braches / Plant No. of leaves / Plant Leaf length (cm) Leaf width (cm) Blocks 2 8.213 0.867 0.317 0.473 0.115 Potassium Fertilizer 3 1384.677 2.639 34.283 15.110 4.237 Error (a) 6 10.913 0.089 4.050 0.224 0.106 Varieties 4 87.149 1.975 17.775 0.508 0.870 Potassium Fertilizer x Varieties 12 87.832 0.931 4.853 0.748 0.123 Error (b) 32 4.897 0.992 2.408 0.516 0.094 Spring season S. O. V. d.f M.S Plant height (cm) No. of braches / Plant No. of leaves / Plant Leaf length (cm) Leaf width (cm) Blocks 2 0.867 0.067 0.350 0.217 0.104 Potassium Fertilizer 3 1268.417 1.622 37.089 12.594 3.327 Error (a) 6 10.200 0.156 2.839 0.528 0.186 Varieties 4 49.608 0.225 17.400 0.192 0.603 Potassium Fertilizer x Varieties 12 75.931 0.303 7.589 0.803 0.074 Error (b) 32 4.200 0.383 1.654 0.450 0.084
4. RESULTS and DISCUSSIONS
20
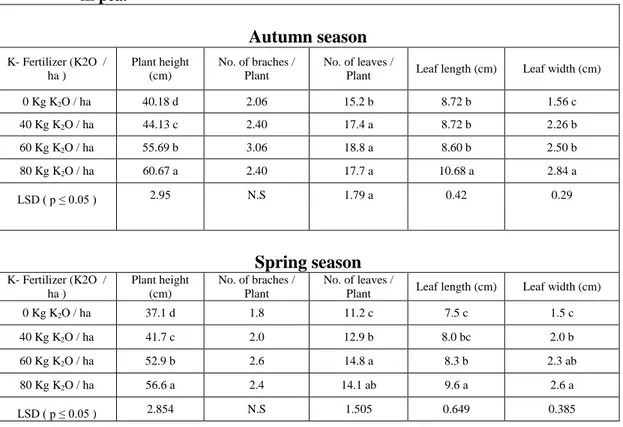
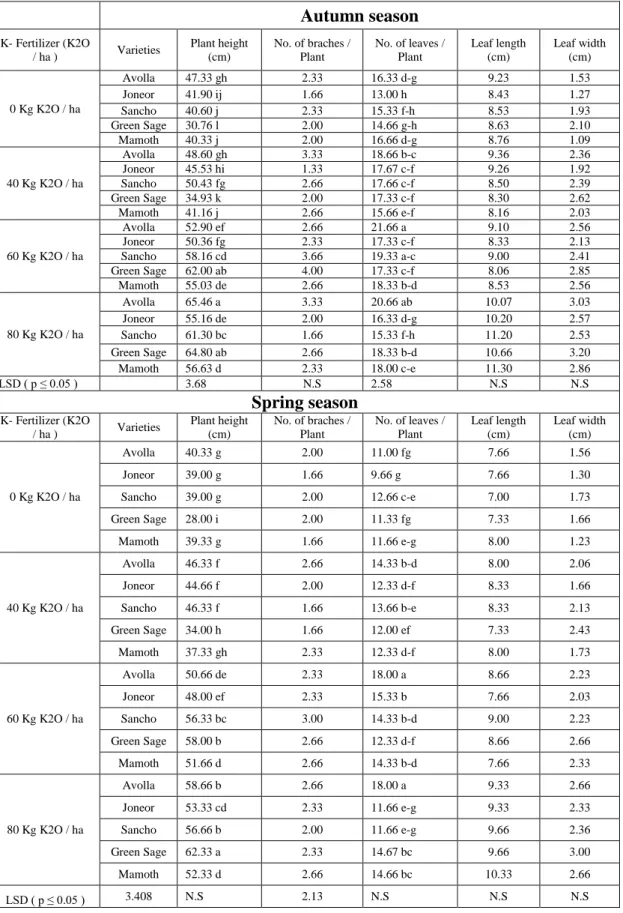
The results of variance analysis for the effect of potassium fertilizer on pea cultivars for growth characters given Table 4.2.
Table 4.2.The average value of the effect of potassium fertilization on growth characters in pea. Autumn season K- Fertilizer (K2O / ha ) Plant height (cm) No. of braches / Plant No. of leaves /
Plant Leaf length (cm) Leaf width (cm) 0 Kg K2O / ha 40.18 d 2.06 15.2 b 8.72 b 1.56 c 40 Kg K2O / ha 44.13 c 2.40 17.4 a 8.72 b 2.26 b 60 Kg K2O / ha 55.69 b 3.06 18.8 a 8.60 b 2.50 b 80 Kg K2O / ha 60.67 a 2.40 17.7 a 10.68 a 2.84 a LSD ( p ≤ 0.05 ) 2.95 N.S 1.79 a 0.42 0.29 Spring season K- Fertilizer (K2O / ha ) Plant height (cm) No. of braches / Plant No. of leaves /
Plant Leaf length (cm) Leaf width (cm) 0 Kg K2O / ha 37.1 d 1.8 11.2 c 7.5 c 1.5 c
40 Kg K2O / ha 41.7 c 2.0 12.9 b 8.0 bc 2.0 b
60 Kg K2O / ha 52.9 b 2.6 14.8 a 8.3 b 2.3 ab
80 Kg K2O / ha 56.6 a 2.4 14.1 ab 9.6 a 2.6 a
LSD ( p ≤ 0.05 ) 2.854 N.S 1.505 0.649 0.385
The effect of potassium fertilizer on plant height is highly significant, the application of 80 kg K2O ha-1 predominated the rest by (48.48, 37.47, and 8.94% in compare to 0, 40 and 60 kg K2O ha-1 respectively. Which recorded maximum value 60.67 cm, and followed by the application of 60 kg K2O ha-1, which recorded 55.69 cm and exceeded 0 and 40 kg K2O ha-1 by 38.58 and 26.193 % . The application of 40 kg K2O ha-1 recorded 44.13 cm and predominated the treatment of control by 9.81%, the lowest value due to plant height recorded by the control with 40.18 cm.
Number of branches per plant, respond non significantly to potassium fertilizer effect. The values of this character were restricted between 2.067 and 3.067 branches for both levels of 0 and 60 kg K2O ha-1 respectively (table 4.1. at atumn season).
Number of leaves per plant. It was noticed that character no of leaves per plant respond high significantly to potassium applications. Maximum number of leaves recorded by the application of 60 kg K2O ha-1 , which was 18.80 leaves, in which exceeded the treatment of control by 23.68 %, the minimum number of leaves recorded by control which was 15.20 leaves. No significant differences were recorded between the applications of 40, 60 and 80 kg K2O ha-1 for this character.
21
Highly significant response of the character leaf length to potassium fertilizer applications was noticed. Maximum leaf length value recorded by the level of 80 kg K2O ha-1 with 10.68 cm, and exceeded the levels of 0, 40 and 60 kg K2O ha-1 by 22.55, 22.55 and 24.16% respectively, while there were not significant differences among the levels of 0, 40 and 60 kg K2O ha-1. The lowest value due to leaf length 8.60 cm was produced by the application of 60 kg K2O ha-1.
Highly significant differences were noticed among potassium application levels due to the character leaf width. The application of 80 kg K2O ha-1 produced maximum leaf width 2.84 cm , which predominated the applications of 0, 40 and 60 kg K2O ha-1 by 79.19, 25.36 and 13.36 % respectively, while there were no significant differences between 40 and 60 kg K2O ha-1 in leaf width .The lowest value for this character was exhibited by the treatment of control with 1.58 cm.
Regarding to spring season, the effect of potassium fertilizer in growth characters was highly significant for all characters except number of branches/plant, which was not significant. The application of 60 kg K2O ha-1 produced maximum values for the characters number of branches per plant and number of leaves per plant with 2.60 and 14.86 %, respectively .The maximum values due to the characters plant height, leaf length and leaf width were 56.66, 9.66 cm and 2.60 cm exhibited by the application of 80 kg K2O ha-1 respectively. The lowest values for the characters plant height number of branches per plant, number of leaves per plant, leaf length and leaf width were produced by the treatment of control as 37.13, 1.86, 11.26, 7.53 and 1.50 cm respectively.
Previous workers indicated that the application of potassium enhanced vegetative growth and nodulation were increased significantly with increasing levels of potassium, Kanaujia et al 1997 1998 vorob 2000.
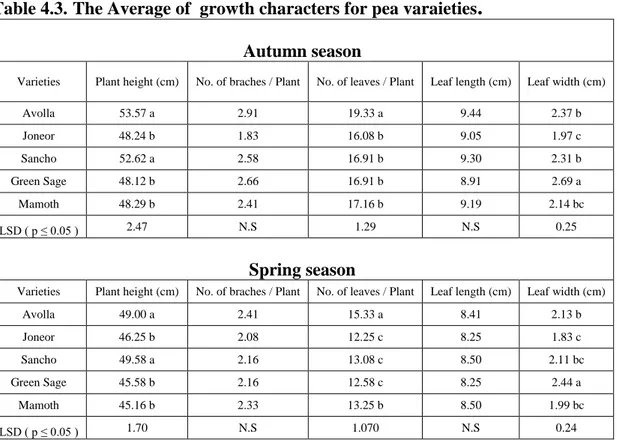
The results of The Average of growth characters for pea varaieties given Table 4.3.
The average of the growth characters for pea varieties confirm the presence of highly significant differences amonge varieties for the character plant height. The variety Avolla recorded maximum plant height value with 53.57 cm , and exceeded the varieties of Joneor, Green sage, and Mamoth by 11.05, 11.32 and 10.93%, respectively, while no significant difference were noticed between Avolla and Sancho varieties and also among the varieties of Joneor, Green sage, and Mamoth. The minimum value for this character was exhibited by the variety of Green sage with 48.12 cm. Significant differences were recorded among varieties for plant height previously by Hussain and Badshah (2002), Hussain et al (2005) and Khan et al (2013), the average of growth character for pea varieties. Abdolla (2015) reported no significant differences among varieties due to the character number of branches per plant.
4. RESULTS and DISCUSSIONS
22
Table 4.3.The Average of growth characters for pea varaieties
.
Autumn season
Varieties Plant height (cm) No. of braches / Plant No. of leaves / Plant Leaf length (cm) Leaf width (cm) Avolla 53.57 a 2.91 19.33 a 9.44 2.37 b Joneor 48.24 b 1.83 16.08 b 9.05 1.97 c Sancho 52.62 a 2.58 16.91 b 9.30 2.31 b Green Sage 48.12 b 2.66 16.91 b 8.91 2.69 a Mamoth 48.29 b 2.41 17.16 b 9.19 2.14 bc LSD ( p ≤ 0.05 ) 2.47 N.S 1.29 N.S 0.25 Spring season
Varieties Plant height (cm) No. of braches / Plant No. of leaves / Plant Leaf length (cm) Leaf width (cm) Avolla 49.00 a 2.41 15.33 a 8.41 2.13 b Joneor 46.25 b 2.08 12.25 c 8.25 1.83 c Sancho 49.58 a 2.16 13.08 c 8.50 2.11 bc Green Sage 45.58 b 2.16 12.58 c 8.25 2.44 a Mamoth 45.16 b 2.33 13.25 b 8.50 1.99 bc LSD ( p ≤ 0.05 ) 1.70 N.S 1.070 N.S 0.24
No significant differences were observed among varieties respect to the character number of branches per plant. The values were restricted between 1.83 and 2.91 cm for the varieties of Joneor and Avolla, respectively.
Highly significant differences among varieties for the character number of leaves per plant was recorded.
Avolla variety exhibited maximum number of leaves 19.33 and exceeded the varieties of Joneor, Sancho, Green sage and Mamoth by 20.20, 14.28, 14.28 and 12.61%, respectively, while there were no significant differences among them. The lowest number of leaves 16.08 was produced by the varietyof Joneor (Table 4.3).
The effect of varieties in leaf length, was found to be no significant. The leaf length values for all varieties ranged between 8.91 and 9.44 cm for the varieties of Joneor and Avolla, respectively.
Highly significant differences were noticed among varieties due to the character leaf width. The variety of Green sage showed maximum leaf width value with 2.69 cm which predominated the varieties of Avolla, Joneor, Sancho and Mamoth by 13.38, 36.21, 16.17 and 25.84% respectively (Table 4.3). No significant differences were noticed between the Avolla and Sancho varieties and also between Joneor and Mamoth varieties. The minimum leaf width value was showed by the variety of Joneor with 1.97 cm.
23
At spring season the difference among varieties for growth characters were highly significant due to the characters plant height, number of leaves per plant and leaf width. Avolla produced the highest value for number of leaves per plant with 15.33 Sancho gave maximum values for plant height with 49.58 cm. Green sage exhibited the highest value for leaf width with 2.44 cm (Table 4.3). At spring season the difference among varieties for growth characters were highly significant due to the characters plant height ,number of leaves per plant and leaf width. Avolla produced the highest value for numberof leaves per plant with 15.33 Sancho gave maximum values for plant height with 49.58 cm. Green sage exhibited the highest value for leaf width with 2.44 cm.
Mamoth gave the lowest value for plant heightwith 45.18 cm, while the lowest value for the characters number of leaves/plant and leaf width were produced by Joneor variety 12.25 and 1.83 respectively.
The interaction effect between potassium fertilizer and pea varieties on growth characters at autumn season represent in table 4.4.
The results of the interaction effect between potassium fertilizer levels and varieties on plant high, was found to be highly significant. Maximum plant height value 65.46 cm was found by the association of Avolla variety under the application of 80 kg K2O ha-1 and followed by 64.80 cm produced by the interaction of Green sage under the same potassium application. The lowest plant high value 30.76 cm was exhibited by the association of Green sage under (0) application of potassium.
The interaction effects between potassium levels and varieties on number of branches per plant, indicated to non significant response. The values were restricted between 1.33 and 4.00 branches for the interaction of Joneor associated with 40 kg K2O ha-1 and green sage coupled with 60 kg K2O ha-1, respectively.
The interaction effect between potassium levels and pea varieties due to number of leaves per plant, was highly significant of this character to this effect was noticed. The maximum number of leaves was 21.66 leaves exhibited by the interaction of Avolla under the application of 60 kg K2O ha-1 , while the lowest number of leaves was 13.00 leaves produced by the association of Joneor variety with 0 kg K2O ha-1 (Table 4.4).
The interaction effect between potassium fertilizer and pea varieties was not significant due to the character leaf length. The values of this character ranged between 8.16 and 11.30 cm for the interaction of Mamoth variety with 40 kg K2O ha-1 and the same variety under 80 kg K2O ha-1.
4. RESULTS and DISCUSSIONS
24
Table 4.4.The interaction effect of potassium fertilizer and varieties on growth characters.
Autumn season K- Fertilizer (K2O / ha ) Varieties Plant height (cm) No. of braches / Plant No. of leaves / Plant Leaf length (cm) Leaf width (cm) 0 Kg K2O / ha Avolla 47.33 gh 2.33 16.33 d-g 9.23 1.53 Joneor 41.90 ij 1.66 13.00 h 8.43 1.27 Sancho 40.60 j 2.33 15.33 f-h 8.53 1.93 Green Sage 30.76 l 2.00 14.66 g-h 8.63 2.10 Mamoth 40.33 j 2.00 16.66 d-g 8.76 1.09 40 Kg K2O / ha Avolla 48.60 gh 3.33 18.66 b-c 9.36 2.36 Joneor 45.53 hi 1.33 17.67 c-f 9.26 1.92 Sancho 50.43 fg 2.66 17.66 c-f 8.50 2.39 Green Sage 34.93 k 2.00 17.33 c-f 8.30 2.62 Mamoth 41.16 j 2.66 15.66 e-f 8.16 2.03 60 Kg K2O / ha Avolla 52.90 ef 2.66 21.66 a 9.10 2.56 Joneor 50.36 fg 2.33 17.33 c-f 8.33 2.13 Sancho 58.16 cd 3.66 19.33 a-c 9.00 2.41 Green Sage 62.00 ab 4.00 17.33 c-f 8.06 2.85 Mamoth 55.03 de 2.66 18.33 b-d 8.53 2.56 80 Kg K2O / ha Avolla 65.46 a 3.33 20.66 ab 10.07 3.03 Joneor 55.16 de 2.00 16.33 d-g 10.20 2.57 Sancho 61.30 bc 1.66 15.33 f-h 11.20 2.53 Green Sage 64.80 ab 2.66 18.33 b-d 10.66 3.20 Mamoth 56.63 d 2.33 18.00 c-e 11.30 2.86 LSD ( p ≤ 0.05 ) 3.68 N.S 2.58 N.S N.S Spring season K- Fertilizer (K2O / ha ) Varieties Plant height (cm) No. of braches / Plant No. of leaves / Plant Leaf length (cm) Leaf width (cm) 0 Kg K2O / ha Avolla 40.33 g 2.00 11.00 fg 7.66 1.56 Joneor 39.00 g 1.66 9.66 g 7.66 1.30 Sancho 39.00 g 2.00 12.66 c-e 7.00 1.73 Green Sage 28.00 i 2.00 11.33 fg 7.33 1.66 Mamoth 39.33 g 1.66 11.66 e-g 8.00 1.23 40 Kg K2O / ha Avolla 46.33 f 2.66 14.33 b-d 8.00 2.06 Joneor 44.66 f 2.00 12.33 d-f 8.33 1.66 Sancho 46.33 f 1.66 13.66 b-e 8.33 2.13 Green Sage 34.00 h 1.66 12.00 ef 7.33 2.43 Mamoth 37.33 gh 2.33 12.33 d-f 8.00 1.73 60 Kg K2O / ha Avolla 50.66 de 2.33 18.00 a 8.66 2.23 Joneor 48.00 ef 2.33 15.33 b 7.66 2.03 Sancho 56.33 bc 3.00 14.33 b-d 9.00 2.23 Green Sage 58.00 b 2.66 12.33 d-f 8.66 2.66 Mamoth 51.66 d 2.66 14.33 b-d 7.66 2.33 80 Kg K2O / ha Avolla 58.66 b 2.66 18.00 a 9.33 2.66 Joneor 53.33 cd 2.33 11.66 e-g 9.33 2.33 Sancho 56.66 b 2.00 11.66 e-g 9.66 2.36 Green Sage 62.33 a 2.33 14.67 bc 9.66 3.00 Mamoth 52.33 d 2.66 14.66 bc 10.33 2.66 LSD ( p ≤ 0.05 ) 3.408 N.S 2.13 N.S N.S N.S
25
The interaction between potassium fertilizer and pea varieties in leaf width was not significant. The values were restricted between 1.09 and 3.20 cm for both interactions Mamoth variety with 0 kg K2O ha-1 and Green sage variety coupled with 80 kg K2O ha-1.
Concerning to spring season the interaction effect between potassium fertilizer and varieties were highly significant for only plant height and number of leaves per plant.
Maximum value to plant height 62.33 cm was produced under the interaction of 80 kg K2O ha-1 (Table 4.4) coupled with green sage variety, while the lowest value 28.00 cm was produced by the interaction of 0 kg K2O ha-1 with green safe variety.
Regarding to the character number of leaves/plant, maximum value 18.00 leaves was produced by the interaction 60 and 80 kg K2O ha-1 with Avolla variety, while the lowest value 9.66 leaves was exhibited by the interaction of 0 kg K2O ha-1 with Joneor variety.
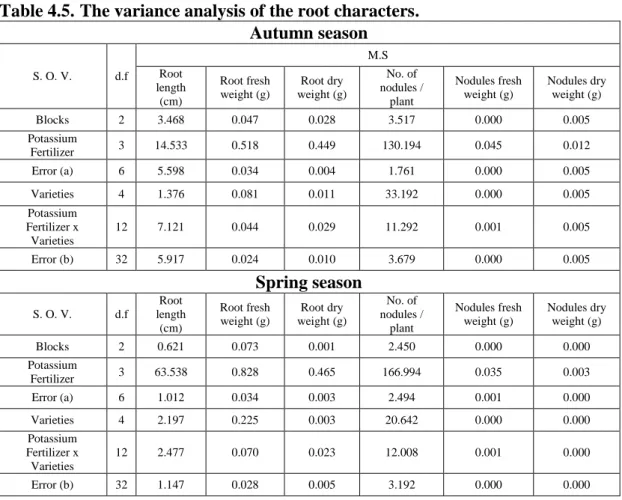
Table 4.5.The variance analysis of the root characters. Autumn season S. O. V. d.f M.S Root length (cm) Root fresh weight (g) Root dry weight (g) No. of nodules / plant Nodules fresh weight (g) Nodules dry weight (g) Blocks 2 3.468 0.047 0.028 3.517 0.000 0.005 Potassium Fertilizer 3 14.533 0.518 0.449 130.194 0.045 0.012 Error (a) 6 5.598 0.034 0.004 1.761 0.000 0.005 Varieties 4 1.376 0.081 0.011 33.192 0.000 0.005 Potassium Fertilizer x Varieties 12 7.121 0.044 0.029 11.292 0.001 0.005 Error (b) 32 5.917 0.024 0.010 3.679 0.000 0.005 Spring season S. O. V. d.f Root length (cm) Root fresh weight (g) Root dry weight (g) No. of nodules / plant Nodules fresh weight (g) Nodules dry weight (g) Blocks 2 0.621 0.073 0.001 2.450 0.000 0.000 Potassium Fertilizer 3 63.538 0.828 0.465 166.994 0.035 0.003 Error (a) 6 1.012 0.034 0.003 2.494 0.001 0.000 Varieties 4 2.197 0.225 0.003 20.642 0.000 0.000 Potassium Fertilizer x Varieties 12 2.477 0.070 0.023 12.008 0.001 0.000 Error (b) 32 1.147 0.028 0.005 3.192 0.000 0.000
4. RESULTS and DISCUSSIONS
26
Table 4.6.The effect of Potassium fertilization on root characters. Autumn season K- Fertilizer (K2O / ha ) Root length (cm) Root fresh weight (g) Root dry weight (g) No. of nodules / plant Nodules fresh weight (g) Nodules dry weight (g) 0 Kg K2O / ha 18.13 1.64 b 0.54 d 21.3 c 0.14 d 0.03 40 Kg K2O / ha 18.99 1.90 a 0.78 c 24.7 b 0.17 c 0.03 60 Kg K2O / ha 19.04 2.01 a 0.87 b 27.4 a 0.20 b 0.09 80 Kg K2O / ha 20.50 2.05 a 0.94 a 27.6 a 0.26 a 0.06 LSD ( p ≤ 0.05 ) N.S 0.164 0.05 1.18 0.01 N.S Spring season K- Fertilizer (K2O / ha ) Root length (cm) Root fresh weight (g) Root dry weight (g) No. of nodules / plant Nodules fresh weight (g) Nodules dry weight (g) 0 Kg K2O / ha 14.33 c 1.38 c 0.47 d 16.73 c 0.12 d 0.02 c 40 Kg K2O / ha 15.66 b 1.70 b 0.72 c 21.06 b 0.15 c 0.03 b 60 Kg K2O / ha 18.08 a 1.83 ab 0.81 b 23.80 a 0.18 b 0.05 a 80 Kg K2O / ha 18.73 a 1.91 a 0.87 a 23.80 a 0.23 a 0.05 a LSD ( p ≤ 0.05 ) 0.89 0.16 0.04 1.41 0.02 0.01
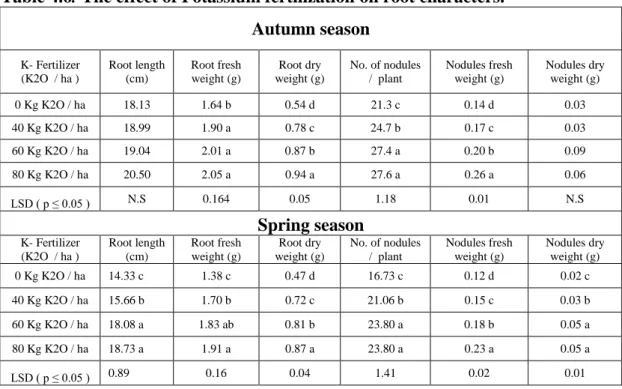
No significant effect of potassium fertilizer in the character root length was recorded. The root length value restricted between 18.13 and 20.50 cm for the applications of 0 and 80 kg K2O ha-1 respectively (Table 4.6).
Highly significant effect of potassium fertilizer in root fresh weight was observed. Maximum value 2.05 gm was produced by the application of 80 kg K2O ha-1 and followed by 2.01 gm for the application of 60 kg K2O ha-1. All application levels were predominated the treatment of control significantly by 15.63, 22.62 and 25.12 %, respectively. The lowest root fresh weight1.64 gm was exhibited by the treatment of control.
The highly significant effect of potassium fertilizer was noticed in the character root dry weight, the root dry weight increased as potassium level increased from 0,0 to 80 kg K2O ha-1. All application levels exceeded the treatment of control by 42.98, 58.65 and 72.85 %, respectively. Maximum value produced by 80 kg K2O ha-1 which was 0.94 gm, and minimum value 0.54 gm was produced by the treatment of control (Table 4.6).
The effect of potassium fertilizer on number of nodules per plant was highly significant. The number of nodules per plant increased as the potassium application level increased. The highest number of nodules 27.60 was produced by the application of 80 kg K2O ha-1.
27
All potassium levels predominated the treatment of control significantly by 15.93, 28.75, and 29.37%, respectively (Table 4.6). The lowest value 21.33 was produced by the application of 0.0 kg K2O ha-1.
The effect of potassium fertilizer in nodules fresh weight was highly significant table. All application levels exceeded the treatment of control significantly by 21.27, 45.39 and 90.78% , respectively .Maximum weight 0.26 gm was showed by 80 kg K2O ha-1, and the lowest weight of fresh nodules 0.14 gm was produced by the treatment of control (Table 4.6).
From the same table and appendix no significant effect of potassium fertilizer was observed in nodules dry weight. while it was increased with potassium level increased up to 60 kg K2O ha-1.
At spring season the effect of potassium fertilizer was highly significant in all character. The application of 80 kg K2O ha-1 exhibited maximum values for all characters which were 18.73, 1.91, 0.87, 23.90, 0.23 and 0.05 for root length, root fresh weight, root dry weight, number of nodules per plant, nodules fresh weight and nodules dry weight respectively, while the treatment of control 0 kg K2O ha-1 gave the lowest values for these characters which were 14.33, 1.38, 0.47, 16.73, 0.12 and 0.02 respectively.
Table 4.7.The differences among pea varieties in root characters. Autumn season
Varieties Root length (cm) Root fresh weight (g) Root dry weight (g) No. of nodules / plant Nodules fresh weight (g) Nodules dry weight (g) Avolla 18.76 2.01 a 0.83 27.41 a 0.20 0.05 ab Joneor 19.20 1.86 b 0.75 25.33 b 0.19 0.04 b Sancho 19.50 1.84 b 0.78 22.75 c 0.19 0.09 a Green Sage 19.49 1.92 a 0.79 25.58 b 0.19 0.04 b Mamoth 18.89 1.92 a 0.77 25.33 b 0.19 0.04 b LSD ( p ≤ 0.05 ) N.S 0.13 N.S 1.59 N.S 0.04 Spring season
Varieties Root length (cm) Root fresh weight (g) weight (g) Root dry No. of nodules / plant Nodules fresh weight (g) Nodules dry weight (g) Avolla 17.16 1.84 a 0.74 22.83 a 0.18 0.04 Joneor 16.00 1.50 b 0.72 21.08 b 0.17 0.04 Sancho 16.76 1.62 b 0.71 19.33 c 0.16 0.04 Green Sage 16.83 1.76 a 0.72 22.08 ab 0.17 0.04 Mamoth 16.75 1.79 a 0.70 21.41 ab 0.17 0.04 LSD ( p ≤ 0.05 ) N.S 0.138 N.S 1.486 N.S N.S
4. RESULTS and DISCUSSIONS
28
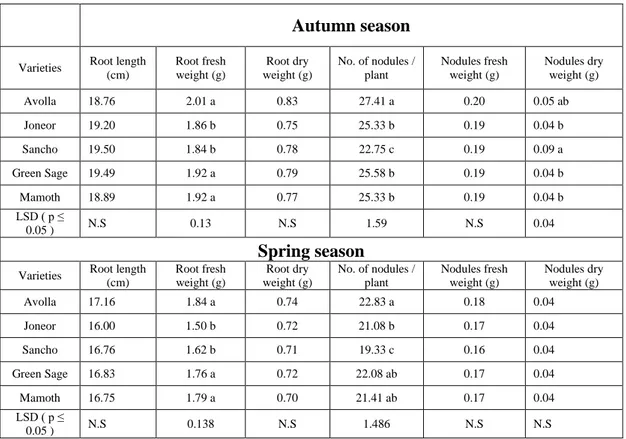
Data represent in this table (4.7), confirm that the differences between pea varieties were not significant due to the character root length, and the values were restricted between 18.76 and 19.50 cm for the varieties of Avolla and Sancho, respectively.
Significant differences among varieties for the character of root fresh weight was confirmed. Avolla variety produced maximum values 2.01 g, which exceeded the varieties of Joneor and Sancho significantly. There were no significant difference among the varieties of Avolla, Green Sage and Mamoth. The lowest value 1.86 g was recorded by Joneor variety.
No significant differences were noticed among varieties for the character of root dry weight. The values were ranged between 0.75 and 0.83 g for the varieties of Joneor and Avolla, respectively (Table 4.7).
Highly significant differences were observed among varieties for the number of nodules per plant. Maximum number was produce by Avolla variety 27.41 which exceeded the rest by 8.22, 20.51, 7.16 and 8.22 %, respectively. The lowest numbers of nodules were produced by the varieties of Joneor and Mamoth each with 25.33 nodules per plant.
Non-significant differences among varieties for the nodules fresh weight was observed. The values were restricted between 0.19 and 0.20 for Green Sage and Avolla varieties respectively (Table 4.7).
From the same table and Appendix no significant differences were noticed among varieties for the nodules dry weight. The values were ranged between 0.04 g for both varieties of Joneor and Mamoth and 0.09 g for the variety of Green Sage.
Regarding to the spring season the difference among varieties to the root fresh weight, number of nodules per plant was highly significant. The Avolla variety recorded maximum values for both characters with 1.84 and 22.83 respectively , while the lowest value for fresh root weight 1.50 gm was, recorded by Joneor variety and for number of nodules per plant 19.33 was recorded by Sancho variety.
Significant differences were reported among pea varieties for fresh root weight per plant, while no significant differences among varieties for the nodule number per plant and significant differences were reported for nodules weight per plant (Singh et al 2006).
29
Table 4.8.The interaction effect of potassium fertilizer and varieties on root characters.
Autumn season
K- Fertilizer
(K2O .ha -1 ) Varieties
Root length (cm) Root fresh weight (g) Root dry weight (g) No. of nodules / plant Nodules fresh weight (g) Nodules dry weight (g) 0 Kg K2O / ha Avolla 19.17 1.61 hi 0.61 gh 21.33 hi 0.19 cd 0.03 b Joneor 19.43 1.93 c-g 0.69 fg 26.66 d-f 0.15 fg 0.03 b Sancho 14.73 2.30 a 0.98 a-c 30.00 a-c 0.18 c-e 0.06 b Green Sage 21.70 2.21 ab 1.05 a 31.66 a 0.26 a 0.07 b Mamoth 17.60 1.52 i 0.52 h 22.66 g-i 0.13 gh 0.02 b
40 Kg K2O / ha
Avolla 18.50 1.79 e-h 0.70 e-g 23.66 f-h 0.16 d-f 0.03 b Joneor 20.60 1.97 b-g 0.88 b-f 27.33 c-e 0.22 b 0.05 b Sancho 20.10 1.93 c-g 0.93 a-e 27.66 b-e 0.26 a 0.06 b Green Sage 17.33 1.58 hi 0.58 gh 20.33 i 0.12 h 0.03 b Mamoth 19.43 1.77 f-i 0.70 c-f 23.66 f-h 0.18 c-e 0.04 b
60 Kg K2O / ha
Avolla 20.50 1.87 d-g 0.81 c-f 24.66 e-g 0.20 bc 0.24 a Joneor 20.73 2.15 a-c 1.02 ab 22.33 hi 0.27 a 0.05 b Sancho 18.56 1.75 g-i 0.58 gh 21.33 hi 0.12 gh 0.03 b Green Sage 19.20 1.94 c-g 0.85 c-f 26.66 d-f 0.16 e-g 0.03 b Mamoth 20.36 2.04 b-e 0.83 c-f 28.66 a-d 0.20 bc 0.06 b
80 Kg K2O / ha
Avolla 19.83 1.96 c-g 0.91 a-e 25.66 d-g 0.26 a 0.05 b Joneor 18.00 1.74 g-i 0.44 i 21.00 hi 0.12 gh 0.03 b Sancho 18.40 2.06 a-d 0.97 a-c 23.00 g-i 0.18 c-e 0.03 b Green Sage 19.00 1.88 d-g 0.84 c-f 26.66 d-f 0.19 cd 0.05 b Mamoth 20.16 2.01 b-f 0.82 c-f 30.66 ab 0.27 a 0.06 b LSD( p ≤ 0.05 ) N.S 0.25 0.16 3.19 0.02 0.12
Spring season
K- Fertilizer
(K2O .ha -1 ) Varieties
Root length (cm) Root fresh weight (g) Root dry weight (g) No. of nodules / plant Nodules fresh weight (g) Nodules dry weight (g) 0 Kg K2O / ha
Avolla 15.66 e-g 1.26 ef 0.50 i 16.66 f 0.16 c-e 0.03 Joneor 13.33 h 1.20 f 0.50 i 16.66 f 0.11 g 0.02 Sancho 13.67 h 1.26 ef 0.52 i 16.66 f 0.11 g 0.02 Green Sage 14.33 gh 1.63 cd 0.47 ij 17.00 ef 0.11 g 0.03 Mamoth 14.66 gh 1.53 de 0.38 j 16.66 f 0.11 g 0.02 40 Kg K2O / ha Avolla 15.00 f-h 1.80 b-d 0.64 h 21.66 cd 0.13 fg 0.03 Joneor 15.00 f-h 1.53 de 0.66 f-h 20.66 cd 0.15 d-f 0.03 Sancho 16.66 c-f 1.53 de 0.67 gh 20.33 cd 0.16 c-e 0.03 Green Sage 15.66 e-g 1.70 c-d 0.77 c-f 23.00 bc 0.14 ef 0.03 Mamoth 16.00 d-g 1.93 a-c 0.88 a-c 19.66 de 0.17 c-e 0.03
60 Kg K2O / ha
Avolla 17.33 b-e 2.16 a 0.90 a 26.00 a 0.17 c-e 0.04 Joneor 17.33 b-e 1.63 cd 0.82 a-e 22.00 c 0.19 bc 0.05 Sancho 18.06 bc 1.66 cd 0.760 e-g 21.33 cd 0.19 bc 0.05 Green Sage 19.00 ab 1.90 a-c 0.79 b-e 26.66 a 0.19 bc 0.05 Mamoth 18.66 b 1.80 b-d 0.76 ef 23.00 bc 0.18 b-d 0.05 80 Kg K2O / ha Avolla 20.66 a 2.13 a 0.90 ab 27.00 a 0.24 a 0.06 Joneor 18.33bc 1.66 cd 0.91 ab 25.00 ab 0.24 a 0.05 Sancho 18.66 b 2.03 ab 0.93 a 19.00 d-f 0.20 b 0.05 Green Sage 18.33 bc 1.83 bc 0.84 a-e 21.66 cd 0.24 a 0.04 Mamoth 17.66 b-d 1.90 a-c 0.77 c-f 26.33 a 0.25 a 0.05 LSD ( p ≤ 0.05 ) 1.78 0.27 0.12 2.97 0.03 N.S