ROLE OF JMJD5 IN LIVER CANCER
A THESIS SUBMITTED TO
THE DEPARTMENT OF MOLECULAR BIOLOGY AND GENETICS AND THE GRADUATE SCHOOL OF ENGINEERING AND SCIENCE OF
BILKENT UNIVERSITY
IN PARTIAL FULFILLMENT OF THE REQUIREMENTS FOR THE DEGREE OF
MASTER OF SCIENCE
By
Engin Demirdizen
August, 2013
ii
I certify that I have read this thesis and that in my opinion it is fully adequate, in scope and in quality, as a thesis for the degree of Master of Science.
Prof. Dr. Mehmet Öztürk (Advisor)
I certify that I have read this thesis and that in my opinion it is fully adequate, in scope and in quality, as a thesis for the degree of Master of Science.
Assoc. Prof. Dr. Rengül Çetin-Atalay
I certify that I have read this thesis and that in my opinion it is fully adequate, in scope and in quality, as a thesis for the degree of Master of Science.
Assist. Prof. Dr. Bala Gür-Dedeoğlu
Approved for the Graduate School of Engineering and Science:
Director of Graduate School of Engineering and Science Prof. Dr. Levent Onural
iii
ABSTRACT
ROLE OF JMJD5 IN LIVER CANCER
Engin Demirdizen
M.S. in Molecular Biology and Genetics Supervisor: Prof. Dr. Mehmet Öztürk
August 2013, 94 Pages
Being one of the most common cancer types in human population, hepatocellular carcinoma (HCC) has high rate of deaths due to the challenges in its diagnosis and treatment. In recent years, epigenetic regulators have come into play in HCC research to overcome with those challenges. As potential drug targets, histone demethylases has drawn a lot of interest. In this respect, several studies have focused on a specific member of this family, JMJD5, suggesting its possible function in tumor suppression, while the opposite argument has also been proposed by several reports. Preceding studies on JMJD5 in our lab also pointed to a possible tumor suppressor function. Hence, this study aimed to elucidate the role of JMJD5 in liver cancer development using SNU449 HCC cell line stably expressing JMJD5. For this purpose, stable clones overexpressing wild-type and mutant JMJD5 as well as controls were generated. A comparative analysis of these clones was performed. No definite results could be obtained for the effect of JMJD5 on cell proliferation, but the number of cells in G1 declined, whereas that in G2/M inclined in clones expressing wild-type and mutant JMJD5, suggesting that JMJD5 affects cell cycle progression. In addition, cell motility was decreased, while anchorage-independent colony formation ability was enhanced in both mutant and wild type JMJD5-expressing clones. Decrease in cell motility is considered to be anti-tumoral, whereas anchorage-independent growth is a malignant change. Our findings suggest that JMJD5 may have a quite complex role in liver tumorigenesis. Further in vivo studies may help to clarify some of these apparently conflicting in vitro effects.
iv
ÖZET
JMJD5’İN KARACİĞER KANSERİNDEKİ ROLÜ
Engin Demirdizen
Moleküler Biyoloji ve Genetik, Yüksek Lisans Tez Yöneticisi: Prof. Dr. Mehmet Öztürk
Ağustos 2013, 94 Sayfa
İnsan popülasyonunda en sık görülen kanser tiplerinden biri olarak, teşhis ve tedavisindeki zorluklardan dolayı karaciğer kanseri (Hepatoselüler Karsinom, HSK) yüksek ölüm oranına sahiptir. Bu zorlukların üstesinden gelebilmek için son yıllarda HSK araştırmalarında epigenetik düzenleyiciler kullanılmaya başlandı. Potensiyel ilaç hedefleri olarak histon demetilazlar çok ilgi çekmektedir. Bu bakımdan, pek çok çalışma karşıt delilleri de diğer çalışmalarda iddia edilmesine rağmen tümör baskılanmasında olası bir görevi olduğunu ileri sürerek bu ailenin bir üyesi olan JMJD5’e odaklanmıştır. Labımızda JMJD5 üzerindeki daha önce yapılan çalışmalar da olası bir tümor baskılama görevine işaret etmiştir. Bu yüzden bu çalışma JMJD5’i stabil olarak ifade eden SNU449 HSK hücre hattını kullanarak JMJD5’in karaciğer kanseri gelişimindeki rolünü ortaya çıkarmayı amaçlamıştır. Bu amaç için normal ve mutant JMJD5’i olduğundan fazla ifade eden stabil klonlarla birlikte kontroller oluşturuldu. Bu klonların kıyaslamalı analizi yapıldı. JMJD5’in hücre çoğalmasına etkisi hakkında kesin sonuçlar elde edilemedi, ancak G2/M’deki hücre sayısı normal ve mutant JMJD5 ifade eden klonlarda artarken, G1’deki hücre sayısı azaldı. Bu sonuç JMJD5’in hücre döngüsü ilerleyişini etkilediğini ileri sürüyor. Buna ek olarak, mutant ve normal tip JMJD5 ifade eden klonlarda dayanaktan bağımsız koloni oluşum kapasitesi artarken hücre hareketliliğinin azaldığı gözlendi.. Hücre hareketliliğinde azalma tümör önleyici olarak düşünülürken dayanaktan bağımsız büyüme kötü huylu bir değişimdir. Bulgularımız JMJD5’in karaciğer kanseri oluşumunda oldukça karmaşık bir rolü olabileceğine işaret ediyor. Daha fazla in vivo çalışma, görünüşe göre çelişkili in vitro etkilerin bazılarına açıklık getirmeye yardım edebilir.
Anahtar sözcükler: JMJD5, karaciğer kanseri, hepatoselüler karsinom, tümör
v
TO MY FAMILY
vi
ACKNOWLEDGEMENTS
I am greatly thankful to many people who make this thesis possible.
First of all, I would like to thank my thesis supervisor Prof. Dr. Mehmet Öztürk for his supervision throughout this project, great ideas, encouragement and understanding. I always admired his extensive knowledge in molecular biology, enthusiasm and excitement about science. It was a privilege for me to work in his laboratory as a M.Sc. student.
Secondly, I am grateful to Gökhan Yıldız for his guidance and valuable support in almost every part of this project. I would also like to thank Emre Yurdusev and Tamer Kahraman for their crucial contributions to this work.
All the past and present members of our group, especially Umur Keleş, Derya Soner Dilek Çevik, Ayşegül Örs, Dr. Çiğdem Özen, Hande Topel, Merve Deniz Abdüsselamoğlu, Yusuf İsmail Ertuna, Dr. Hani Alotaibi, Umar Raza and Andaç Kipalev have been wonderful colleagues and friends during my M.Sc. study.
Other members in our lab, particularly Ender Avcı, Pelin Telkoparan, Mehmet Şahin, İhsan Dereli, Damla Gözen, Sıla Özdemir, Gurbet Karahan, Nilüfer Sayar, Verda Ceylan Bitirim, Defne Bayık, Gözde Güçlüler, Ece Akhan, Merve Aydın have always been good friends for me.
I would also like to thank Füsun Elvan, Bilge Kılıç, Sevim Baran, Yıldız Karabacak and Abdullah Ünnü in the Department of Molecular Biology and Genetics for their invaluable help.
I would like to thank Dr. Uygar Tazebay and Dr. Yoshihiro Izumiya for donating SNU449-TRex cells and pLTRE-KDM8 plasmids, respectively.
Finally, I would like to thank The Scientific and Technological Research Council of Turkey (TÜBİTAK) for supporting me during the master study through BİDEB 2210 scholarship.
vii
TABLE OF CONTENTS
ABSTRACT ... iii
ÖZET... iv
TABLE OF CONTENTS ... vii
LIST OF TABLES ... xii
LIST OF FIGURES ... xiii
INTRODUCTION ... 1
1.1 Hepatocellular carcinoma ... 1
1.1.1 Aetiologies of hepatocellular carcinoma ... 1
1.1.2 Pathogenesis of hepatocellular carcinoma ... 2
1.2 Epigenetics, cancer and HCC ... 2
1.3 Histone demethylases ... 4
1.3.1 Histone lysine demethylase (HDM) family ... 4
1.3.2 Regulation of histone demethylase activity ... 7
1.3.3 Biochemical mechanism of histone lysine demethylation ... 7
1.3.4 HDMs in relation to cancer ... 7
1.4 Role of JMJD5 in H3K36 demethylation and protein hydroxylation ... 8
1.4.1 Role of JMJD5 in histone demethylation ... 8
1.4.1.1 Biological importance of H3K36 methylation... 8
1.4.1.2 JMJD5 in the literature ... 8
1.4.2 Role of JMJD5 in protein hydroxylation ... 9
1.4.2.1 Hydroxylation activities of JMJD5 and its related proteins ... 10
OBJECTIVES AND RATIONALE ... 11
viii
3.1 MATERIALS ... 12
3.1.1 General Laboratory Reagents ... 12
3.1.2 Cell culture materials and reagents ... 12
3.1.3 Bacterial Strains ... 13
3.1.4 Nucleic acids ... 13
3.1.5 Electrophoresis, photography and spectrophotometry ... 13
3.1.6 Antibodies ... 13
3.2 SOLUTIONS AND MEDIA ... 15
3.2.1 General solutions ... 15
3.2.2 Bacteria solutions ... 15
3.2.3 Immunofluorescence staining solutions ... 16
3.2.4 Immunoperoxidase staining solutions ... 16
3.2.5 BrdU incorporation assay solutions ... 17
3.2.6 Sodium Deodecyl Sulphate (SDS) – Polyacrylamide Gel Electrophoresis (PAGE) and immunoblotting solutions ... 17
3.2.7 SRB assay solutions ... 18
3.2.8 Wound healing assay solutions ... 18
3.2.9 Flow cytometry analysis solution... 19
3.3 METHODS ... 19
3.3.1 Commonly used methods ... 19
3.3.1.1 Agarose gel electrophoresis ... 19
3.3.1.2 Computer and Software Tools ... 19
3.3.2 Constructing the plasmids ... 20
3.3.3 Cell culture methods ... 20
3.3.3.1 Cell lines and growth conditions of cells ... 20
ix
3.3.3.3 Passaging the cells ... 21
3.3.3.4 Cryopreservation of the cells ... 21
3.3.3.5 Transient transfection of cells using Lipofectamine 2000 ... 22
3.3.3.6 Stable transfection of cells with lentiviral vectors ... 22
3.3.4 Total protein extraction from cultured cells ... 24
3.3.5 Western blotting ... 24
3.3.6 Immunofluorescence staining ... 25
3.3.7 Immunoperoxidase staining ... 25
3.3.8 Bromodeoxyuridine (BrdU) and Flag double immunofluorescence staining…….. ... 26
3.3.9 Flow cytometry analysis of JMJD5 - expressing clones ... 27
3.3.10 RNA sample preparation and hybridization to chip ... 28
3.3.11 Bioinformatics data analyses of JMJD5 microarray samples ... 28
3.3.12 Sulphordamine B (SRB) assay for cell proliferation ... 29
3.3.13 SRB assay for Adriamycin resistance ... 30
3.3.14 Wound healing assay... 30
3.3.15 Soft agar colony formation assay ... 30
3.3.15.1 Preparation of base agar ... 30
3.3.15.2 Preparation of top agar ... 31
RESULTS ... 32
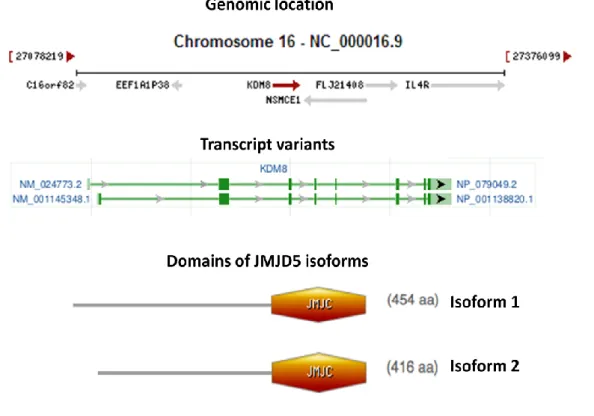
4.1 JMJD5 ... 32
4.1.1 Knowledge about JMJD5 on NCBI ... 32
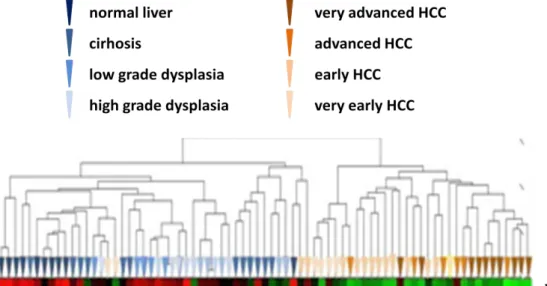
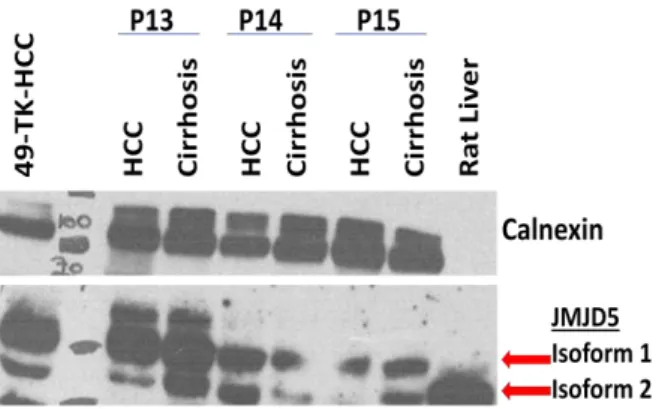
4.2 Expression Levels of JMJD5 in Healthy-Diseased Liver and HCC Cell Lines…….. ... 33
4.2.1 In Vivo JMJD5 Expression ... 33
x
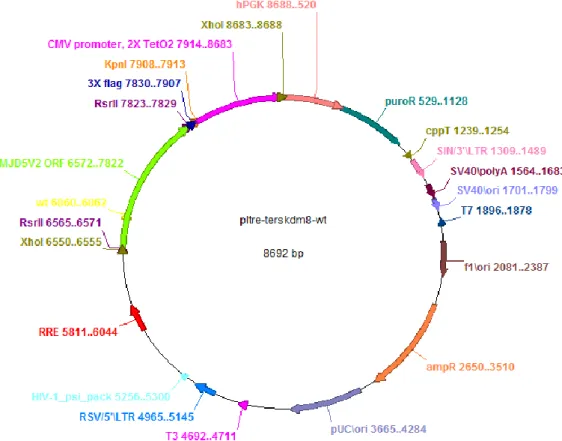
4.3 Maps of JMJD5 Plasmids and Restriction Enzyme Digestion Control ... 36
4.4 Transient Exogenous JMJD5 Expression in SNU449-TRex Cells ... 39
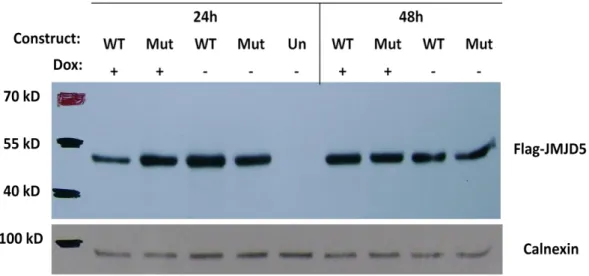
4.4.1 Tet-ON Inducible Transient Expression of Exogenous JMJD5 at 24 and 48 Hours ... 39
4.4.2 Tet-ON Inducible Transient Expression of Exogenous JMJD5 at 48 Hours……… ... 40
4.5 Determining the Optimum Drug Concentrations for Selection of Stable Colonies Using Kill Curve Method ... 41
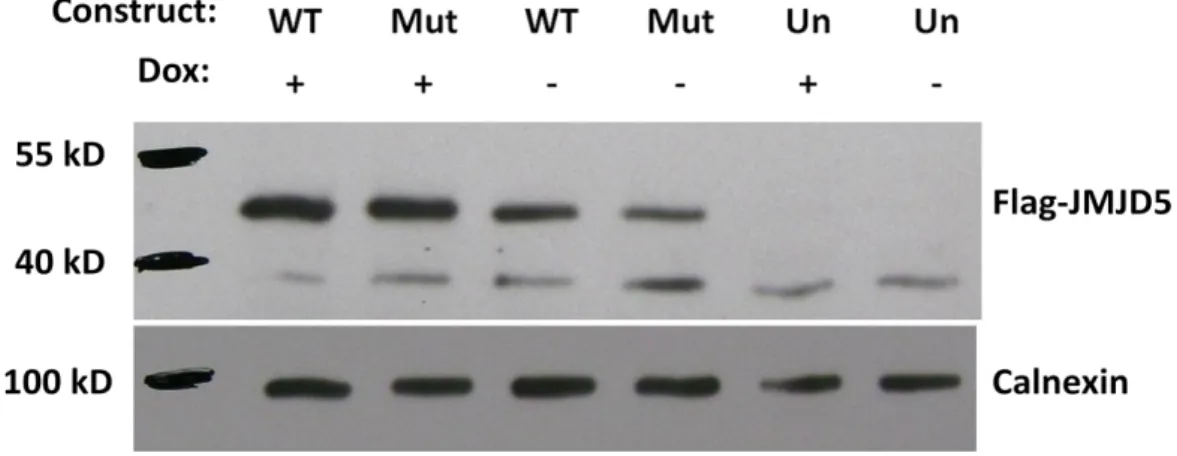
4.6 Tet-ON Inducible Exogenous JMJD5 Expression in Stable Clones ... 42
4.6.1 Western Blot Analysis... 42
4.6.2 Immunofluorescence Analysis ... 43
4.7 Comparison of Genome-wide Expression Profiles between EGEM-w4 and EGEM-e1 ... 46
4.7.1 Altered Genes ... 47
4.7.2 Altered Gene Sets ... 52
4.8 Phenotypic Assays for Stable Clones ... 57
4.8.1 Sulphordamine B Assay for Cell Proliferation ... 57
4.8.2 Immunofluorescence Double Staining for Bromodeoxyuridine and Flag…………. ... 58
4.8.3 Cell Cycle Analysis by Flow Cytometry ... 62
4.9 Analysis of Isogenic Sub-clones with High JMJD5 Expression ... 65
4.9.1 Immunoperoxidase Staining Analysis ... 65
4.9.2 Wound Healing of Stable Sub-clones ... 67
4.9.3 Anchorage-independent Growth of Stable Sub-clones ... 70
4.9.4 Cell Cycle Analysis of Isogenic Sub-clones by Flow Cytometry ... 73
4.9.5 Sensitivity of Stable Clones to Adriamycin ... 77
xi
5.1 The role of JMJD5 in cell proliferation and cell cycle ... 79
5.2 Role of JMJD5 in cell migration and morphology ... 82
5.3 Role of JMJD5 in anchorage-independent colony formation... 83
5.4 JMJD5 and drug sensitivity ... 84
5.5 The importance of H321A mutation in JmjC domain ... 84
5.6 JMJD5 as a tumor suppressor in the pathogenesis of HCC ... 85
CONCLUSION ... 87
FUTURE PERSPECTIVES ... 88
xii
LIST OF TABLES
Table 1.1: List of histone lysine demethylases, their specific substrates and related diseases. ... 5 Table 3.1: The list of the antibodies with their catalog numbers and working dilutions ... 14 Table 4.1: JMJD5 positivity for each clone ... 46 Table 4.2: 26 genes at least 1.5 fold upregulated with significance level of 0.05 in EGEM-w4 clone compared to EGEM-e1 clone... 47 Table 4.3: 37 genes at least 1.5 fold downregulated with significance level of 0.05 in EGEM-w4 clone compared to EGEM-e1 clone... 50 Table 4.4: Gene set enrichment analysis of EGEM-w4 and EGEM-e1 with respect to cellular processes. ... 53 Table 4.5: Gene set enrichment analysis of EGEM-w4 and EGEM-e1 with respect to oncogenic properties ... 56 Table 4.6: Mean FITC signals for the clones and isotype control ... 63 Table 4.7: The average percentage distribution of isogenic clones in cell cycle phases ... 65 Table 4.8: Immunoperoxidase count data and the mean Flag-JMJD5 positivity of isolated stable sub-clones ... 67 Table 4.9: Mean FITC signals for the isogenic stable clones and isotype control... 74 Table 4.10: The mean percent distributions of stable clones in cell cycle phases ... 76
xiii
LIST OF FIGURES
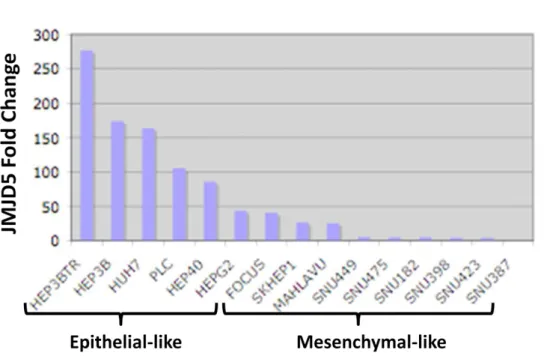
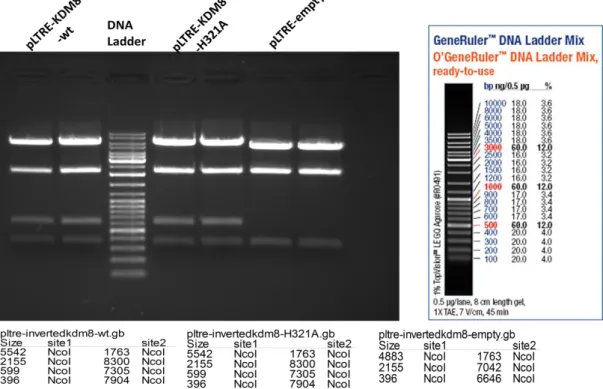
Figure 4.1: Genomic location, transcript variants and conserved domains of JMJD5 isoforms ... 32 Figure 4.2: Microarray data of different liver conditions for JMJD5 levels ... 33 Figure 4.3: Screening for JMJD5 expression in HCC and cirrhosis sample pairs of 15 patients using western blotting technique ... 35 Figure 4.4: Fold change of JMJD5 expression in HCC cell lines ... 36 Figure 4.5: Map of pLTRE-FLAG-KDM8 plasmid ... 37 Figure 4.6: NcoI restriction enzyme digestion results for JMJD5 plasmids on 1 % agarose gel ... 38 Figure 4.7: Flag-JMJD5 recombinant protein expression upon 24 h and 48 h doxycycline induction in SNU449 TRex cells transiently transfected with wild type and mutant constructs of JMJD5 gene ... 39 Figure 4.8: Flag-JMJD5 recombinant protein expression upon 48 h doxycycline induction in SNU449 TRex cells transiently transfected with wild type and mutant constructs of JMJD5 gene ... 40 Figure 4.9: Commassie Brilliant Blue staining of untransfected SNU449 TRex cells incubated in different concentrations of puromycin for 6 days ... 42 Figure 4.10: Inducible JMJD5 expression in stable clones ... 43 Figure 4.11: Immunoflorescence staining of stable clones for exogenous JMJD5.... 45 Figure 4.12: SRB readings of stable clones after 6-day doxycycline induction ... 58 Figure 4.13: BrdU and Flag double immunoflorescence staining pictures and merged photos for each isogenic stable clone ... 61 Figure 4.14: BrdU and Flag positivity percentages for each isogenic clone ... 61 Figure 4.15: BrdU positivity for Flag (+) and Flag (-) subpopulations of each clone. ... 62 Figure 4.16: Cell cycle analysis for stable clones ... 64 Figure 4.17: Immunoperoxidase staining for isolated sub-clones of EGEM-M2 and EGEM-W4 stable clones ... 66
xiv
Figure 4.18: Wound healing of stable clones at 0, 24 and 48 hours ... 69 Figure 4.19: Wound healing of stable clones after 48-hour incubation ... 70 Figure 4.20: 4X, 10X and 20X pictures of formed colonies for stable clones on soft agar ... 72 Figure 4.21: Mean colony number fold change of isogenic clones with respect to EGEM-e1 (empty) clone. ... 73 Figure 4.22: Cell cycle analysis for unsynchronous isogenic sub-clones ... 76 Figure 4.23: SRB staining of isogenic clones under different adriamycin concentrations on 96-well plates ... 77 Figure 4.24: Survival curves of stable clones with respect to adriamycin concentration ... 78
1
CHAPTER 1
INTRODUCTION
1.1 Hepatocellular carcinoma
Among all types of liver cancer, hepatocellular carcinoma (HCC) is the most widely encountered, comprising 83 % of all cases [1]. As a common disease, HCC is the fifth and seventh most widespread cancer in populations of men and women, respectively [2]. Being the sixth most prevalent neoplasm, HCC is also ranked third among the cancers most frequently causing death, with only 14 % 5-year survival rate [3, 4].
1.1.1 Aetiologies of hepatocellular carcinoma
The major aetiological factors regarding HCC include infection with hepatitis B (HBV) and C virus (HCV), contributing to about 70 % of all cases, excessive alcohol intake and aflatoxin contamination in the food resources [1, 2, 5]. Other risk factors, including female oral contraceptive use for a long time, certain metabolic diseases, diabetes, obesity, non-alcoholic fatty liver disorders (NAFLD) and non-alcoholic steatohepatitis, are also minorly responsible for the causation of HCC [1, 5]. The frequency of HCC occurrence changes in the world based on geographical distribution of causative agents. HBV infection plays a major role in most Asian and African countries, whereas HCV infection is the primary reason for HCC in United States and most European countries. Heavy alcohol drinking in western societies and dietary aflatoxin contamination in South China and Sub-Saharan Africa are primary causes of HCC development in these regions [2].
2
1.1.2 Pathogenesis of hepatocellular carcinoma
The cause of hepatocellular carcinoma can be literally attributed to cirrhosis-stimulating circumstances in the host microenvironment [1]. HBV-HCV infections and alcohol overconsumption lead to inflammation, many rounds of hepatocyte loss and regeneration, oxidative stress and permanent fibrotic activity, ultimately resulting in cirrhosis [1, 6]. After liver is injured, genomic stability is lost through blockage of DNA repair, carcinogenic agents and epigenetic alterations, which starts conversion of normal hepatocytes into malignancy [6, 7]. As the genetic damage accumulates, self-expanding dysplastic nodules arise, and they progressively give rise to well-differentiated, moderately differentiated and poorly differentiated metastatic HCC [7].
Genomic changes, including chromosome abnormalities and genetic mutations are commonly observed in HCC [1]. Loss of 4q and gain of 1q, 8q, 17q are the most widespread changes in the chromosome [5]. Mutations detected in HCC cases mainly occur in p53, β-catenin, Axin1, p16, hTERT, ErbB receptor family and MET receptor [1, 5, 8]. Epigenetic mechanisms, such as DNA methylation, mutations in epigenetic factors and differential expression of miRNAs, have been found to be associated with HCC pathogenesis [5]. As a key component in HCC development, inhibition of p53 and p16, coupling with hTERT activation, drives liver cells into bypassing senescence and immortalization [9].
1.2 Epigenetics, cancer and HCC
The field of hereditary alterations which do not occur in base sequence of DNA but affect gene expression is defined as epigenetics [10]. This inherited knowledge is encoded by chemically modified nucleotides and proteins binding to the chromatin in eukaryotic genomes. Gene expression patterns are deeply differentiated upon epigenetic changes because accessibility of genes and chromatin architecture are modulated [11]. There are four major mechanisms of epigenetic modification: DNA methylation, covalent modifications of histones, microRNAs and non-covalent actions of nucleosome remodeling machineries and histone variants [10].
3
Abnormal functioning in epigenetic mechanisms is equally important as genetic events in the onset and development of carcinogenesis [12]. As evidence suggests, the function of key epigenetic players changes earlier than cell transformation into malignancy, thereby playing a critical role in cancer development [13, 14]. In terms of discovery of early diagnostic biomarkers, risk consideration and tracing of the disease, more elaborated knowledge on epigenetic mechanisms could provide promising improvements [13].
Methylation patterns of genome, histone modification status and expression levels of chromatin-regulating factors are globally altered in cancer epigenome [10]. Hypomethylation in the global scale and hypermethylation in the CpG islands of tumor suppressor promoters are commonly detected in the cancer cells [10, 12]. According to mapping studies covering whole chromatin, most widely observed histone modifications in cancer are diminished histone-4 lysine 16 acetyl (H4K16ac), H4K20 methyl (H4K20me3) levels and varying H3K9, H3K27 methylations, all of which leads to gene silencing. Upregulated histone deacetylases (HDACs) levels, changing histone acetyl transferases (HATs) levels and aberrant histone methyltransferases (HMTs) activity underlie those modifications, being other characteristics of cancer. Histone lysine demethylases (HDMs), many of which possess Jumonji C domain, have also been associated with cancer, several of them being upregulated in prostate cancer. Nucleosome remodeling complexes were shown to act together with DNA methylations and histone modifications on silencing of tumor suppressors via compacting nucleosome settlement in promoter regions. Compared to normal tissues, miRNA expression levels also exhibit wide range of changes in tumor [10].
In the context of HCC, DNA methylation abnormalities, influencing mutations in epigenetic factors and changes in miRNA expression profiles have newly been identified with a raising concern [5]. Promoter hypermethylation in tumor suppressor genes and genome-wide hypomethylation have been characterized in HCC [15]. EZH2, which constitutes the catalytic part of polycomb repressive complex 2 (PRC2) and generates H2K27me3 repressive mark, is upregulated in HCC and correlates with the aggresiveness of HCC [5, 16]. HDACs-1, -2 and -3; enzymes involved in
4
DNA methylation, including DNMT1, DNMT3A and DNMT3B; and CENPA histone variant levels have also been shown to exhibit elevation in HCC samples compared to non-tumor liver samples [5].
1.3 Histone demethylases
Similar to the histone methylation through histone methyltransferases, which regulate chromatin architecture and transcription, HDMs play key functions in the cellular mechanisms, including development and involvement in disease. Histone demethylases so far identified have been shown to be important in normal processing of the cells, playing a diverse range of biological roles and also targeting non-histone proteins as substrates [17].
1.3.1 Histone lysine demethylase (HDM) family
Recently discovered histone lysine demethylases including amine oxidase family and Jumonji C (JmjC) domain-containing enzyme family has proved that histone lysine methylation is reversible. The first member of histone lysine demethylases discovered was lysine-specific demethylase 1(LSD1), also known as KDM1 [18]. The first member to be elucidated in JmjC family was F-box and Leu-rich repeat protein 11 (FBXL11), also known as JHDM1A and KDM2A, which was reported to demethylate H3K36me1 and H3K36me2 [17]. With the discovery of JMJD2, which is capable of demethylating H3K9me3/me2 and H3K36me3/2, and many others, trimethylation on histone lysine residues were also indicated to be reversible [19]. Up to now, demethylation events targeting H3K4, H3K9, H3K27, H3K36 and H4K20 have been detected in 18 members of 30-member JmjC family, as summarized in Table 1.1 [17].
5
Table 1.1: List of histone lysine demethylases, their specific substrates and related diseases.
(Adapted from Kooistra and Helin, 2012 [17])
Name Synonyms Histone
substrates
Non-histone substrates
Association with human disease
LSD demethylases LSD1 AOF2, BHC110, KDM1A H3K4me1, H3K4me2, H3K9me1, H3K9me2 p53, E2F1, DNMT1
Overexpression in prostate cancer, undifferentiated malignant neuroblastoma, oestrogen-receptor-negative breast cancer, bladder cancer, lung and colorectal carcinoma and silencing/downregulation in breast cancer LSD2 AOF1, KDM1B H3K4me1, H3K4me2
Amplification and overexpression in urothelial carcinoma JMJC demethylases JMJD7 HIF1AN HSPBAP1 JMJD5 KDM8 H3K36me2 JMJD4 JMJD6 PSR, PTDSR
H3R2, H4R3 Overexpression in chronic pancreatitis JMJD8 FBXL10 JHDM1B, KDM2B H3K36me1, H3K36me2, H3K4me3
Overexpression in various leukaemias and bladder carcinoma
FBXL11 JHDM1A, KDM2A H3K36me1, H3K36me2 p65, NF-κB KIAA1718 JHDM1D H3K9me1, H3K9me2, H3K27me1, H3K27me2 PHF8 JHDM1F H3K9me1, H3K9me2, H4K20me1
Mutation and deletion associated with X-linked mental retardation and cleft lip/palate
PHF2 JHDM1E H3K9me2 ARID5B Mutation or silencing/downregulation in breast carcinoma and head and neck squamous cell carcinoma HR KDM3B JMJD1A JHDM2A, TSGA, KDM3A H3K9me1, H3K9me2 Overexpression in malignant colorectal cancer, metastasized prostate adenocarcinoma, renal cell carcinoma and hepatocellular carcinoma
6
JMJD3 KDM6B H3K27me2, H3K27me3
Overexpression in various cancers including lung and liver carcinomas and several haematological
malignancies, in neutrophils of patients with ANCA vasculitis and in primary Hodgkin’s lymphoma UTX KDM6A H3K27me2,
H3k27me3
Mutation in multiple tumour types including multiple myeloma,
oesophageal squamus cell carcinoma, renal clear cell carcinoma, transitional cell carcinoma, chronic
myelomonocytic leukaemia, overexpression in breast cancer and deletion in Kabuki syndrome UTY JMJD2A JHDM3A, KDM4A H3K9me2, H3K9me3, H3K36me2, H3K36me3, H1.4K26me2, H1.4K26me3 Silencing/downregulation in bladder cancer and overexpression in breast cancer JMJD2C JHDM3C, GASC1, KDM4C H3K9me2, H3K9me3, H3K36me2, H3K36me3, H1.4K26me2, H1.4K26me3
Amplification in oesophageal cancer, breast cancer, medulloblastoma and translocation in lymphoma JMJD2B JHDM3B, KDM4B H3K9me2, H3K9me3, H3K36me2, H3K36me3, H1.4K26me2, H1.4K26me3 Overexpression in malignant peripheral nerve sheath tumour
JMJD2D JHDM3D, KDM4D H3K9me2, H3K9me3, H3K36me2, H3K36me3, H1.4K26me2, H1.4K26me3 JARID1B PLU1, KDM5B H3K4me2, H3K4me3
Overexpression in bladder cancer, prostate cancer and breast cancer JARID1C SMCX,
KDM5C
H3K4me2, H3K4me3
Mutation in mental retardation, in autism and in renal carcinoma JARID1D SMCY,
KDM5D
H3K4me2, H3K4me3
Deletion in prostate cancer JARID1A RBP2,
KDM5A
H3K4me2, H3K4me3
Silencing/downregulation or deletion in melanoma, translocation in acute leukaemia and mutation in ankylosing spondylitis
JARID2 Mutation associated with non-syndromic cleft lip, spina bifida and congenital heart defects
7 MINA NO66 H3K4me2, H3K4me3, H3K36me2, H3K36me3
Overexpression in non-small cell lung cancer
1.3.2 Regulation of histone demethylase activity
Several mechanisms that control histone demethylase activity include modulation of gene expression, settlement into the target via certain domains or as a component of protein complexes and modifications at the post-translational level [17, 20]. For the recruitment of the enzyme to the histones, high numbers of weak associations in the chromatin surroundings are utilized [18]. It turned out that in their recruitment sites, in place of switching on/off activity, they are involved in fine-tuning of the transcriptional regulation [17].
1.3.3 Biochemical mechanism of histone lysine demethylation
LSD1 carries out demethylation through flavin adenine dinucleotide (FAD)-dependent amine oxidation. In this mechanism, imine intermediate is formed due to oxidation of target methyl group on lysine by FAD, which is followed by hydrolysis of the intermediate product and release of demethylated lysine and formaldehyde. Because of chemical restrictions, LSD1 could only conduct its function on lysines with mono or dimethylation, whereas JmjC domain-containing histone lysine demethylases (JHDMs) catalyze the reaction at all three levels of histone methylation. In JHDM mechanism, target methyl group is converted into a hydroxymethyl group, with the involvement of α-ketoglutarate (α-KG) and Fe2+
as cofactors; then release of the hydroxymethyl group in formaldehyde form occurs, generating unmethylated lysine residue [18].
1.3.4 HDMs in relation to cancer
Several lines of study point to the fact that genetic changes and protein deregulations in histone demethylases are commonly encountered in cancer and these proteins are
8
considered as targetable candidates for drug research [19]. Suppressive effect of LSD1 on p53 and E-cadherin proposes that it might stimulate tumorigenesis [17, 21]. JMJD2 proteins, namely JMJD2A, JMJD2B and JMJD2C, have potentially oncogenic property, as evidenced by high expression of all in prostate cancer and contribution of JMJD2C to the cancer cell proliferation [19]. In breast cancer cells, JARID1B was shown to be upregulated [21]. In a hematopoetic mouse model, mutation in FBXL10 was detected, suggesting its possible tumor suppression activity. Upon triggering of senescence depending on RAS oncogene induction in primary human epithelial cells, JMJD3, JMJD6 and KIAA1718 were shown to be overexpressed, addressing a possible involvement of these factors in inducing senescence [19].
1.4 Role of JMJD5 in H3K36 demethylation and protein
hydroxylation
1.4.1 Role of JMJD5 in histone demethylation
1.4.1.1 Biological importance of H3K36 methylation
Histone methyltransferases known as SET2/KMT3 family carry out H3K36 methylation, which is generally found in body region of transcriptionally active genes. Consistently, this mark has been proposed to function in elongation of transcripts and inhibition of transcriptional start in this region [22]. Being related to actively transcribed chromatin in majority of the cases, methylation at H3K36 is also known to play roles in silencing of extra X chromosome, replication of DNA, DNA damage response, alternative splicing and methylations of DNA [23].
1.4.1.2 JMJD5 in the literature
JMJD5 was first demonstrated to play a role in connection between histone modulation and circadian clock regulation, having an evolutionary conservation from plants to humans [24]. In Arabidopsis, JMJD5 accumulation in both cytoplasm and
9
nucleus was detected, suggesting differential roles in both regions [25]. JMJD5, depending on its localization, might be carrying out protein hydroxylation in soluble part of nucleus and histone demethylation in chromatin [26]. According to the preliminary analyses, presence of an LXXL motif on N-terminus of JMJD5, required for interaction with nuclear receptors; and association with SUV39H1 and SETDB1 histone methyltransferases were predicted, implying complicated regulatory mechanisms [27]. Biochemical and functional analyses on JMJD5 revealed that it could most probably act as a protein hydroxylase rather than histone demethylase [28]. Hydroxylating NFATc1 and leading to its degradation, JMJD5 suppresses differentiation of precursor osteoclasts [26].
Through removing methyl marks on H3K36me2, JMJD5 induced cyclin A1 expression, functioning as a key factor in cell cycle progression of breast cancer cells [27]. JMJD5 deletion in mouse embryos resulted in an embryonic lethal phenotype due to the overexpression of Cdkn1a gene, which encodes p21cip1 cyclin-dependent kinase inhibitor, through demethylation of H3K36 [29]. As a potential oncogene, JMJD5 was also proposed to inhibit p53-p21cip1 pathway and p53-mediated cell cycle arrests in mouse embryos [30]. In contrast, histone demethylase-free action and decreased JMJD5 expression in lung cancer was detected, suggesting a possible function in tumor inhibition [31]. Furthermore, in an insertional mutagenesis study using mice lacking Blm, JMJD5 was identified as a candidate tumor suppressor [32].
1.4.2 Role of JMJD5 in protein hydroxylation
Metazoans, ranging between worms and humans, have a set of adaptive mechanisms against low oxygen conditions primarily controlled by hypoxia-inducible factor-α (HIF-α in short) [33]. The putative oncogenic roles of many HIF-target genes and elevated expression of HIF-α on several solid tumors suggest its potential tumor-inducing role [34]. Its accumulation, interaction with other partners and degradation are regulated by HIF-prolyl hydroxylases (HPHs), which constitute a subfamily among dioxygenases. These enzymes were also described in HIF-independent hydroxylation activities on several other substrates [33]. Exemplifying the first discovered protein hydroxylation event in the cell, HIF-α hydroxylation is performed
10
by EGLN hydroxylases on proline residue at high levels of oxygen and by factor-inhibiting HIF-α (FIH) on asparagine residue at intermediate levels of oxygen [35].
1.4.2.1 Hydroxylation activities of JMJD5 and its related proteins
Biochemical analysis on JMJD5 structure suggests a possible protein hydroxylase function rather than histone demethylation [28]. Recently, it was also documented that JMJD5 hydroxylates NFATc1 (nuclear factor of activated T-cells calcineurin-dependent 1), a critical transcription factor in osteoclastogenesis, and helps its proteasomal degradation [26]. Consistently, JmjC domain-containing enzymes involved in protein and nucleic acid hydroxylation, such as FIH-1, JMJD6, TWY5 and HSPBAP1 seem to be more homologous to JMJD5 depending on structural and sequential comparisons [28]. FIH-1 is responsible for the hydroxylation of HIF-α at Asparagine 803 under medium level of oxygen, resulting in HIF-α inhibition [19]. JMJD6 was detected to act as a lysyl hydroxylase on an RNA splicing protein U2AF65 (U2 small nuclear ribonucleoprotein auxiliary factor 65-kDa subunit), and its previously documented histone arginine demethylation role was disproved [36]. TYW5 (tRNA yW-synthesizing enzyme 5) was reported to catalyze hydroxylation of wybutosine (yW), a nucleoside located in tRNAPhe whose modification is required for proper translation of phenyl alanine, to its derivative [37]. HSPBAP1 (heat-shock protein 27 (Hsp27) -associated protein 1) was put forward as a potential protein hydroxylase of Hsp27 to block its activity [19].
11
CHAPTER 2
OBJECTIVES AND RATIONALE
Due to the absence of early biomarkers, liver injury-related restrictions on drug use and resistance against cytotoxic agents used for cancer therapy; HCC is lethal. As the genetic, molecular and aetiological mechanisms are better understood, the severe problems that liver cancer therapy is confronted could be dealt with [1]. Epigenetics, in this perspective, could provide progression in discovery of early diagnostic biomarkers, risk consideration and tracing of the disease [13]. In particular, several lines of study point to histone demethylases as targetable candidates for drug research [19]. JMJD5, a member of JmjC domain-containing histone lysine demethylase family, has recently been suggested to have a putative tumor suppressor role [31, 32]. Our past and current group members have also demonstrated its downregulation from the early onset of liver disease to hepatocellular carcinoma (see Figures 4.2 and 4.3 in "Results" section), suggesting a key role for this gene in normal functioning of liver and hepatocarcinogenesis. These results led to come up with the hypothesis that JMJD5 might have a tumor suppressor function in liver, its deficiency possibly contributing to the development of liver disease and carcinoma. In this study, we aimed at analysis of biological roles of JMJD5, with a particular focus on its tumor suppressor activity, applying genetic, molecular biological, phenotypic and morphological assays using hepatocellular carcinoma-derived SNU449 cell line. The outcomes of this study are expected to make important contributions to the liver cancer research in regards of candidate drug targets and biomarker identification.
12
CHAPTER 3
MATERIALS AND METHODS
3.1 MATERIALS
3.1.1 General Laboratory Reagents
The chemicals majorly used in this research were purchased from Sigma-Aldrich (St. Louis, MO, USA) and Merck (Darmstadt, Germany). The commonly used reagents, including ethanol, methanol, haematoxylene and Bradford reagents, were from Sigma-Aldrich (St. Louis, MO, USA). Ponceau S and DMSO were purchased from Applied Biochemia (Darmstadt, Germany). Nucleospin RNA II total RNA isolation kit and plasmid mini-prep kit was from Macherey-Nagel (Duren, Germany). Plasmid midi-prep kit was bought from Promega (Madison, WI, USA). Fluorescent mounting medium was from Dako. ECL Prime detection kit used for western blot was from Amersham Pharmacia Biotech Company (Buckinghamshire, UK). Agarose used in gel electrophoresis was purchased from Conda (Madrid, Spain). Agar, yeast extract and tryptone were puchased from Gibco (Carlsbad, CA, USA).
3.1.2 Cell culture materials and reagents
All the plastic equipments, including petri dishes, plates, flasks and cryovials, were bought from Corning Life Sciences Incorporated, (Corning, NY, USA). Dulbecco’s modified Eagle’s medium (DMEM) and Roswell Park Memorial Institute (RPMI) 1640 media were purchased from GIBCO (Life Technologies, Carlsbad, CA, USA). Powder DMEM High Glucose was from USBiological (Swampscott, Massachusetts, USA). Non-essential amino acids, trypsin-EDTA, penicillin/streptomycin, L-glutamine, fetal bovine serum (FBS), Optimem reduced serum medium, puromycin
13
and blasticidin were all from GIBCO. Serological pipettes and sealed-cap polycarbonate centrifuge tubes were from Costar Corporation (Cambridge, UK). Lipofectamine 2000 was purchased from Invitrogen.
3.1.3 Bacterial Strains
E. coli DH5α strain was used in this study.
3.1.4 Nucleic acids
DNA molecular weight markers and 6X loading dye were purchased from MBI Fermentas GmbH (Germany). pLTRE-FLAG-KDM8, pLTRE-FLAG-KDM8H321A and pLTRE-FLAG-empty plasmids were constructed and donated by Yoshihiro Izumiya from Sacramento, CA, USA.
3.1.5 Electrophoresis, photography and spectrophotometry
Agarose gel electrophoresis apparatus was from Thermo Electron Corporation. Gel imaging software, power supplies Power – PAC200 and Power – PAC300 were from Bio Rad Laboratories (CA, USA). Beckman Du640 UV-visible spectrophotometer from Beckman Instruments Incorporation (CA, USA) was used for Bradford assay to quantify proteins. Nucleic acid concentrations were determined by using NanoDrop from Thermo Scientific (Wilmington, USA).
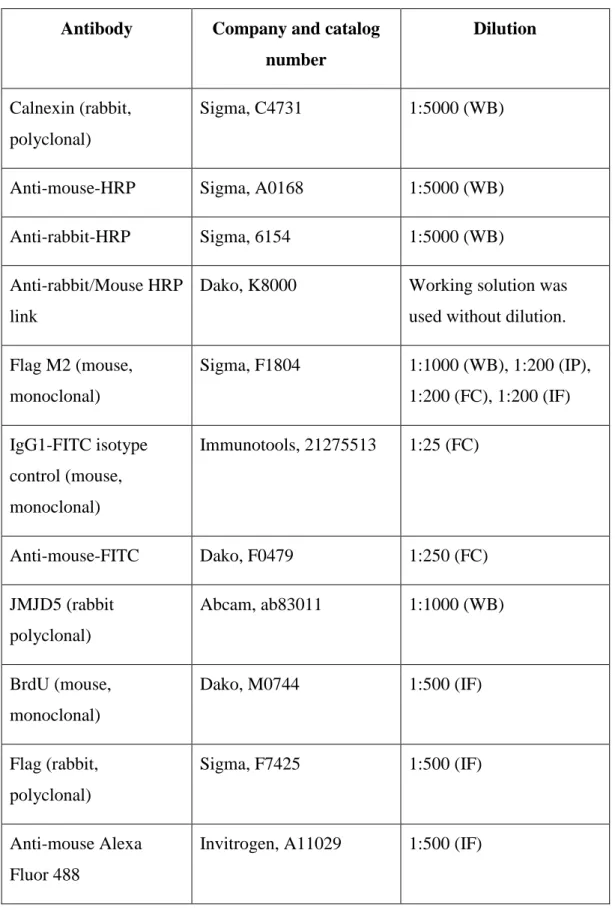
3.1.6 Antibodies
Antibodies used in different assays are indicated in the following table together with their catalog numbers, and working dilutions.
14
Table 3.1: The list of the antibodies with their catalog numbers and working dilutions
(WB: western blotting, IP: immunoperoxidase staining, FC: flow cytometry, IF: immunofluorescence)
Antibody Company and catalog
number
Dilution
Calnexin (rabbit, polyclonal)
Sigma, C4731 1:5000 (WB)
Anti-mouse-HRP Sigma, A0168 1:5000 (WB) Anti-rabbit-HRP Sigma, 6154 1:5000 (WB) Anti-rabbit/Mouse HRP
link
Dako, K8000 Working solution was used without dilution. Flag M2 (mouse, monoclonal) Sigma, F1804 1:1000 (WB), 1:200 (IP), 1:200 (FC), 1:200 (IF) IgG1-FITC isotype control (mouse, monoclonal) Immunotools, 21275513 1:25 (FC) Anti-mouse-FITC Dako, F0479 1:250 (FC) JMJD5 (rabbit polyclonal) Abcam, ab83011 1:1000 (WB) BrdU (mouse, monoclonal) Dako, M0744 1:500 (IF) Flag (rabbit, polyclonal) Sigma, F7425 1:500 (IF) Anti-mouse Alexa Fluor 488
15 Anti-rabbit Alexa Fluor
568
Invitrogen, A11011 1:500 (IF)
3.2 SOLUTIONS AND MEDIA
3.2.1 General solutions
50X Tris Acetate EDTA (TAE) 242 g Tris base, 57.1 ml glacial acetic acid and 18.6 g EDTA were dissolved in 1 liter ddH2O.
1X working dilution is used.
10X Phosphate Buffered Saline (PBS) 80 g NaCl, 2 g KCl, 14.4 g Na2HPO4,
2.4 g KH2PO4 in 1 liter ddH2O
1X working dilution is used. Before use in cell culture, it is autoclaved.
Ethidium bromide 10 mg/ml stock is prepared by dissolving in ddH2O.
Working concentration is 30 µg/ml.
3.2.2 Bacteria solutions
Luria-Broth (LB) medium 10 g bacto-tryptone, 5 g bacto-yeast extract and 10 g NaCl were dissolved in 1 liter of water. For LB agar plates, 15 g/L bacto agar was added and autoclave-sterilized.
Ampicillin 100 mg/ml stock solution was dissolved in ddH2O.
16
100 µg/ml working concentration was used.
3.2.3 Immunofluorescence staining solutions
Acetone: methanol fixation reagent Acetone and methanol were mixed in 1 to 1 ratio.
Blocking solution 10% FBS, 0.3% Triton X-100 in 1X PBS
Antibody dilution solution 1 % BSA, 0.3% Triton X-100 in 1X PBS
DAPI (4’,6-diamino-2-phenylindole) 0.1-1 µg/ml working concentration in ddH2O.
3.2.4 Immunoperoxidase staining solutions
Acetone: methanol fixation reagent Acetone and methanol were mixed in 1 to 1 ratio.
3% H2O2 solution It was prepared mixing 30% H2O2 with
methanol and ddH2O. (For example, 3
ml H2O2, 10 ml methanol and 17 ml
ddH2O)
Blocking solution 10% FBS, 0.3% Triton X-100 in 1X PBS
DAB solution DAB chromogen and its substrate from Dako were used according to the manufacturer’s protocol.
17
ddH2O.
3.2.5 BrdU incorporation assay solutions
BrdU Stock solution concentration is 10 mg/ml
in ddH2O. 30 µM working concentration is used.
2N HCl 8.62 ml of 37% HCl is added to 16.36 ml ddH2O.
3.2.6 Sodium Deodecyl Sulphate (SDS) – Polyacrylamide Gel Electrophoresis (PAGE) and immunoblotting solutions
In this study, tris-glycine gels and buffers were prepared manually according to a conventional protocol in our lab. To prepare 5% stacking gel, ddH2O, 30%
acrylamide mix, 1.0 M Tris-HCl pH 6.8, 10% SDS, 10% ammonium persulphate and TEMED were mixed successively, in certain volumes. For the resolving gel, depending on concentration of the gel, same solutions were mixed in certain volumes, this time using 1.5 M Tris-HCl pH 8.8 instead of 1.0 M Tris-HCl pH 6.8. Wet transfer was applied on PVDF membrane. 5X sample loading buffer, and denaturing agent (β-mercaptoethanol) were purchased from Invitrogen.
NP-40 lysis buffer 50 mM Tris HCl, 150 mM NaCl, 1% NP-40, 0.1% SDS, 1X protease inhibitor cocktail
10X SDS Running buffer 144 g glycine and 30 g Tris were dissolved in dH2O, 50 ml 10% SDS was
added, and the volume was completed to 1 L. Working solution is 1X.
10X Transfer buffer 72 g glycine and 58 g Tris were dissolved in dH2O, 2 ml 10% SDS was
18
added, and the volume was completed to 1 L. Working solution is 1X containing 20% EtOH.
10X Tris buffered saline (TBS) 12.19 g trisma base and 87.76 g NaCl were dissolved in 1 L of ddH2O, and pH is adjusted to 8.
Working concentration is 1X.
TBS-tween 20 (TBS-T) 0.2% Tween 20 was dissolved in 1X TBS.
Blocking solution 5% (w/v) non-fat dry milk was dissolved in 0.2% TBS-T.
Ponceau S 0.1% (w/v) Ponceau S and 5% (v/v) acetic acid were dissolved in 0.2 % TBS-T.
3.2.7 SRB assay solutions
10 % TCA fixation solution 10 % TCA is dissolved in water. 0.4 % SRB staining buffer
Tris base, unbuffered
0.4 % SRB dye powder is dissolved in 1 % acetic acid.
10 mM, pH 10.5
3.2.8 Wound healing assay solutions
Crystal Violet solution 1 % crystal violet solution is prepared in 2 % ethanol.
19
3.2.9 Flow cytometry analysis solution
Propidium iodide buffer 50 µg/ml propidium iodide, 0.1 mg/ml RNase A and 0.5% TritonX-100 in PBS
3.3 METHODS
3.3.1 Commonly used methods
3.3.1.1 Agarose gel electrophoresis
Restriction enzyme digestion products and plasmid DNAs generally were run, separated and checked with this technique. Agarose gels were prepared in desired weight/volume concentrations by dissolving agarose in 1X TAE buffer using microwave heat. When the solution was cool enough, ethidium bromide, reaching to 30 µg/ml concentration, was added. 1X TAE buffer was also used for the gel run. Mixed with 6X loading dye, samples were loaded into the wells and run at 120 V, for the various time durations with respect to the size of the products. Visualization of DNA fragments was carried out by gel imaging device under UV light, and product sizes were compared with those of DNA ladder.
3.3.1.2 Computer and Software Tools
NCBI website at http://www.ncbi.nlm.nih.gov/ and Ensembl Genome Browser website at http://www.ensembl.org/index.html/ were utilized to learn all sequences, transcripts variants exon-intron information about the genes. PROSITE internet tool at http://prosite.expasy.org/ developed by Swiss Institute of Bioinformatics (Lausanne) was used for conserved domain search. A plasmid Editor (ApE) programme created by M. Wayne Davis was used for plasmid map construction, restriction digestion design and cloning.
20
3.3.2 Constructing the plasmids
The plasmids donated by Yoshihiro Izumiya were constructed by this group in a set of cloning processes. 3X Flag tag and RsrII site was inserted into the multiple cloning site of pcDNA5/FRT/TO vector (Invitrogen) under CMV promoter containing Tet operator sequences. JMJD5 variant 2 open reading frame (ORF) was inserted into RsrII site. The construct between XhoI sites which contains Tet-CMV promoter, 3X Flag tag, JMJD5 ORF and BGH polyadenylation signal was cut out from pcDNA5/FRT/TO vector and inserted into pLKO.1 no-stuffer vector (Addgene) between XhoI sites. Newly generated plasmids were named as pLTRE-FLAG-KDM8, pLTRE-FLAG-KDM8H321A and pLTRE-FLAG-empty.
3.3.3 Cell culture methods
3.3.3.1 Cell lines and growth conditions of cells
HepG2-Trex, SNU449-Trex stable cell lines and SNU449-Trex-derived stable clones, namely EGEM-W1, EGEM-W2, EGEM-W3, EGEM-W4, EGEM-M1, EGEM-M2, EGEM-M3, EGEM-E1, EGEM-M2-C2, EGEM-M2-C4, EGEM-W4-C2, EGEM-W4-C3, were cultured in complete DMEM or RPMI medium.
Complete DMEM and RPMI media contained 10 % FBS, 1 % penicillin/streptomycin and 1 % non-essential amino acids. The incubation of cells was conducted in humidified incubators with 37 C° temperature and 5 % CO2 level.
Cells were passaged in 2-3 day frequency when the confluency was reached.
3.3.3.2 Thawing the cells
Taken from either nitrogen tank or -80 C° freezer, the desired cell lines were incubated on ice for a few minutes and thawed at 37 C° in water bath in a few minutes. The thawed cell suspension was transferred to a 15 ml falcon tubes and mixed with several milliliters of fresh medium, immediately. Cells were spinned down at 1500 rpm for 3 min. DMSO was removed together with the supernatant
21
using aspirator. The pellet was resuspended in several milliliters of complete medium and transferred to either a 25 cm2 flask or 100 mm dish according to the size of the pellet. Rocked gently back and forth to evenly distribute the cells, flask or dish was incubated in the incubator at 37 C° in 5% CO2 overnight. Next day, dead cells were
removed and washed with 1X PBS, and the medium was replenished.
3.3.3.3 Passaging the cells
Before passaging the cells, the old growth medium was removed by aspiration, and the cells were washed with 1X PBS. After the removal of PBS, trypsin-EDTA was added onto the cells in dishes or plates. The added volume of the trypsin-EDTA was dependent on the surface area of the dish or plate. For example, 500 µl volume was added to the 100 mm dishes. The cells were left to incubate in incubators for a few minutes until all the cells were detached from the surface. The detached cells were mixed thoroughly by adding fresh medium and pipetting up and down with serological pipettes. Then, the cells were divided into suitable dishes or flasks with desired dilutions. The growth media, trypsin-EDTA and 1X PBS were stored at 4 C°. FBS was heat-inactivated at 55 C° for 30 min, filter-sterilized, aliquoted and stored at -20 C°. Before use, all media and solutions were warmed up in water bath at 37 C°.
3.3.3.4 Cryopreservation of the cells
After reaching 60-70% confluency, cells were washed with PBS, detached by trypsin-EDTA and collected with medium into 15-ml falcon. Cell suspension was centrifuged at 1500 rpm for 3 min, and the supernatant was aspired. The cell pellet was then resuspended in freezing medium containing 10 % DMSO in complete medium. Cells were transferred to the cryotubes, and first stored at -20 C° for 1 hour and later at -80 C° overnight. Nitrogen tanks were used for long term storage.
22
3.3.3.5 Transient transfection of cells using Lipofectamine 2000
After washing with 1X PBS and trypsinizing, cells were counted on hemocytometer, and 6 x 10⁵ cells/well were cultured on 6-well plates in antibiotic-free medium. Cell confluency on the plates should be 90-95% after 24h. Preceding transfection, the media were aspirated, cells were washed with 1X PBS and 1.5 ml OptiMem I Reduced Serum Medium was given into each well. 250 µl/well diluted DNA mix was prepared by mixing 4 µg of plasmid of interest per well with OptiMem I Reduced Serum Medium. 250 µl/well diluted lipofectamine 2000 mix was prepared by mixing 10 µl of lipofectamine 2000 transfection reagent per well with OptiMem I Reduced Serum Medium. After gently mixed, the mixtures were incubated for 5 minutes at room temperature. Diluted DNA and diluted lipofectamine mixtures were combined and incubated for 20 minutes at room temperature. 500 µl of complexes was divided into each well, completing the volume to 2 ml. The cells were incubated in transfection media at 37 C° in 5% CO2 for 4-6 hours. Then, transfection media
were removed, 2 µg/ml doxycycline (Sigma)-containing complete RPMI 1640 medium was given to the Dox (+) cells, whereas only complete RPMI was given to Dox (-) cells. The cells were incubated at 37 C° in 5% CO2 for 24, 48 and 72 hours.
3.3.3.6 Stable transfection of cells with lentiviral vectors
3.3.3.6.1 Production of viral particles
HEK293T cells were seeded in such a way as to reach 30-40 % confluency in the following day, and incubated at 37 C° overnight.
Transfection mixes (The required amounts per well for 6-well plate transfection are shown.)
Express-InTM (Open Biosystem) Calcium phosphate (CaP) Mix A
TransLenti Viral ORF Packaging mix (OpenBiosystem) 2 µl Lentiviral vector 0,5-1μg Optimem 500 μl
Mix A
TransLenti Viral ORF Packaging mix (Open Biosystem) 2 µl Lentiviral vector 0,5-1μg CaCl2 (1M) 120 μl
23 Mix B
Express-InTM (Open Biosystem) 20 μl Optimem 480 μl
ddH2O 360 μl Mix B
2xHBS 500 μl
(In addition to the lentiviral transfection vectors, pLEX JRed TurboGFP vector mix was prepared (Evrogen) to check working of transfection in every step of the process.)
A and B mixes were prepared separately and left to wait for 5 minutes. Then two mixes were combined and left to wait for 20 minutes at room temperature. Completing the volume to 2 ml with complete growth medium, the whole mixtures were added to HEK293T cells, and plates were incubated at 37 C° overnight. Next day, transfection medium was changed with fresh complete medium.
3.3.3.6.2 Infection
The day after the transfection of HEK293T cells, SNU449-TRex cells targeted for transfection were seeded on 6-well plates to reach 30-40 % confluency and incubated overnight at 37 C°. 48 hours after than HEK293T cell transfection, 2 ml media of these cultures which contain viral particles were taken, 8 µg/ml polybrene was added, and the media were passed through 42 µm filter. Media of HEK293T cells were replenished. The media of target SNU449-TRex cells were removed, and the filtered media containing viral particles and polybrene were added to them. Target cells were incubated at 37 C° overnight. By collecting the media from HEK293T cells every other day, target cells were infected three times in total for efficient transfection.
3.3.3.6.3 Selection
24 hours after third infection, target SNU449-TRex cells were selected under 9 µg/ml puromycin concentration, dose being dependent on kill curve of this cell line. After 1-week selection, all the control cells were dead, while colonies appeared on infected cells.
24
3.3.4 Total protein extraction from cultured cells
Cells were trypsinized and collected in the pellet. For lysis, cells were mixed up with the adequate amount of RIPA buffer by pipetting and vortexing every 5 minutes up to 15 minutes. To fragment DNA and increase lysing efficiency, sonication and 3-minute boiling processes were applied. Cell lysates were centrifuged at 4 C° at 13,000 rpm for 40 minutes. Supernatants were saved in clean eppendorf tubes, and stored at -80 C°.
3.3.5 Western blotting
For quantification of protein lysates, Bradford assay was applied. A standard curve was drawn with respect to absorbance values of serially diluted BSA proteins of known concentrations. The concentrations of sample proteins were calculated by putting the absorbance values of them as y values in the standard curve equation. Upon mixing with Bradford reagent, a blue- colored complex is formed, giving an absorbance maximum at 595 nm on the spectrophotometer. For sample preparation, 5X SDS loading dye and 5% b-mercaptoethanol in loading dye were added in appropriate amounts to 15-30 ug protein lysates, and the volume was completed by ddH2O. Denaturation of samples was done at 100 C° for 10-12 minutes.
All the SDS-PAGE gels and buffers were manually prepared. 12% Tris-glycine gel was used for the better resolution of about 50 kD Flag-JMJD5 conjugate protein. 1X SDS running and 1X SDS transfer buffers were prepared according to the commonly used recipes in the lab. Transfer buffer contained 20 % ethanol, and PVDF membrane was used for the transfer.
Blocking of the obtained membranes was conducted overnight at 4 C° with 5 % BSA or milk in 0.3 % TBS-T, according to the suggested protocols for each specific antibody. Primary antibody incubation was done for 1 hour at room temperature with gentle shaking at certain antibody dilution ratios. Membranes were washed for 5, 15 and 5 minutes with 0.3 % TBS-T. Membrane was incubated with HRP-conjugated secondary antibodies for 1 hour at room temperature with gentle shaking at certain antibody dilution ratios. The membrane was additionally washed with TBS-T as in
25
the previous case. Then, for chemiluminescent detection, ECL prime western blot detection kit from Thermoscientific was applied according to the manufacturer’s protocol. Development of the X-ray films with chemiluminescent emission was performed for certain time periods according to the specific antibody.
3.3.6 Immunofluorescence staining
SNU449-TRex cells were seeded on sterile coverslips in 12-well plates in 15,000 cells/well number in order to reach subconfluency on the day of immunoperoxidase staining after 3-day culturing. Doxycycline induction, as being 2 µg/ml, was done in the first day of experiment after cells were attached to the surface for 48 hours. Being washed with 1X PBS, the cells were both fixed and permeabilized with acetone-methanol (1:1) mixture at -20 C° for 10 minutes. Then cells were washed with 1X PBS three times for 5 minutes each. Blocking was applied with 10 % FBS, 0.3 % Triton X-100 in 1X PBS for 1 hour at 37 C°. Primary antibody was diluted in a buffer containing 1 % BSA, 0.3 % Triton X-100 in 1X PBS depending on the specific antibody and applied directly onto the coverslips drop by drop. The coverslips were incubated at 37 C° for 2 hours. Then cells were washed three times with 0.3 % 1X PBS-T for 5 minutes each and incubated with fluorescent dye-conjugated secondary antibody for 1 hour at room temperature in dark. Washing of the secondary antibody was performed similar to the primary antibody. DAPI counterstaining was performed by diluting 1/10,000 in ddH2O and applying for 3
minutes at room temperature. The excessive counterstain was removed by ddH2O
washing, and mounting of coverslips onto the slides was done with DAKO mounting medium. Fluorescent microscope (ZEISS) was used to examine the samples.
3.3.7 Immunoperoxidase staining
SNU449-TRex cells were seeded on sterile coverslips in 6-well plates in 15,000 cells/well number in order to reach subconfluency on the day of immunoperoxidase staining after 3-day culturing. Doxycycline induction, as being 2 µg/ml, was done in the first day of experiment after cells were attached to the surface for 48 hours. Being
26
washed with 1X PBS, the cells were both fixed and permeabilized with acetone-methanol (1:1) mixture at -20 C° for 10 minutes. Then cells were washed with 1X PBS three times for 5 minutes each. To stop endogenous peroxidase activity, hydrogen peroxide was added to each well and incubated for 10 minutes at room temperature in dark. The cells were again washed with 1X PBS three times for 5 minutes each. Blocking was applied with 10 % FBS, 0.3 % Triton X-100 in 1X PBS for 1 hour at room temperature. Primary antibody was diluted in blocking solution depending on the specific antibody and applied directly onto the coverslips. The coverslips were incubated at 37 C° for 2 hours. Then cells were washed twice with 0.3 % 1X PBS-T for 2 minutes each and incubated with secondary antibody (DAKO, anti-mouse and anti-rabbit together) for 1 hour at room temperature in dark. Washing of the secondary antibody was performed similar to the primary antibody. DAKO-DAB Chromogen solution was prepared according to the manufacturer’s protocol, added onto only one coverslip as drops, left to wait until reaction occurs and gives brown-colored product, and time was recorded. Then each well was treated with this substrate for determined amount of time. After reaction was stopped with ddH2O,
Haemotoxylin (Mayer’s, Sigma) counterstaining was performed for 3-5 minutes. The excessive counterstain was removed by ddH2O washing, and mounting of coverslips
onto the slides was done with DAKO mounting medium. Light microscope (ZEISS) was used to examine the samples.
3.3.8 Bromodeoxyuridine (BrdU) and Flag double immunofluorescence staining
SNU449-TRex clones were seeded on 12-well plates in 30,000 cells/well density, and fresh medium containing both doxycycline and BrdU was given to all cells. After 4-hour incubation, all medium was removed. The medium with doxycycline but without BrdU was added, and cells were incubated in this medium for 48 hours. Following fixation in 70 % ice-cold ethanol at -20 C° for 10 minutes, cells were washed with 1X PBS three times for 5 minutes each. Blocking was applied with 10 % FBS, 0.3 % Triton X-100 in 1X PBS for 1 hour at 37 C°. Primary Flag polyclonal antibody (Rb) was diluted in a buffer containing 1 % BSA, 0.3 % Triton X-100 in 1X
27
PBS depending on its working dilution ratio and applied directly onto the coverslips drop by drop. The coverslips were incubated at 37 C° for 2 hours. Then cells were washed three times with 0.3 % 1X PBS-T for 5 minutes each. Alexa 568-conjugated anti-Rabbit secondary antibody was applied in its specific dilution ratio at room temperature for 1 hour, and three times washing with 0.3 % 1X PBS-T was done. Then fixation was repeated with 70 % ice-cold ethanol at -20 C° for 10 minutes in order to keep Flag primary and secondary antibodies attached to their targets. 2 N HCl treatment for 30 minutes at 37 C° was applied to denature double stranded DNA structure. Neutralization was carried out with borate buffer, and cells were washed with 1X PBS three times. BrdU primary antibody treatment was applied at 37 C° for 1 hour and followed by PBS-T washes three times. Alexa 488-conjugated anti-mouse secondary antibody incubation was performed at room temperature for 1 hour, and it was washed with PBS-T three times. DAPI counterstaining was performed by diluting 1/10,000 in ddH2O and applying for 3 minutes at room temperature. The
excessive counterstain was removed by ddH2O washing, and mounting of coverslips
onto the slides was done with DAKO mounting medium. Fluorescent microscope (ZEISS) was used to examine the samples.
3.3.9 Flow cytometry analysis of JMJD5 - expressing clones
Being treated with doxycycline as previously mentioned, cells were rinsed with 1X PBS, trypsinized and divided into 15 ml falcons. Then cells were centrifuged at 1500 rpm for 5 minutes. Pellets were resuspended in 70 % PBS-ice cold ethanol, and tubes were incubated at -20 C° for 15 minutes for fixation and permeabilization. Cells were centrifuged at 1800 rpm for 8 minutes, PBS-ethanol solution was removed, and pellets were washed with 1X PBS. Primary antibody solution was prepared in 0.1 % PBS-T, being 1:200 dilution for Sigma mouse M2 monoclonal anti-flag antibody. The pellets were resuspended in 100 µl of primary antibody solution and incubated at room temperature for 1 hour with a few-time vortexing. Mouse IgG1-FITC isotype control was applied as being 4 µl in 100 µl of 0.1 % PBS-T and incubated in the same manner. After 1X PBS-T wash, Sigma FITC-conjugated anti-mouse secondary antibody, being properly diluted in 0.1 % PBS-T, was applied to the cells for 30
28
minutes in the dark with gentle agitation. After 1X PBS-T wash, for DNA staining, cells were incubated at 37 C° for 30 minutes in 500 µl propidium iodide buffer containing 50 µg/ml Sigma propidium iodide, 0.1 mg/ml Thermoscientific RNase A and 0.5 % Triton X-100. After cells were washed twice with 1X PBS and resuspended in appropriate amount of PBS, cell cycle analysis was performed using BD Accuri C6 Flow Cytometer (BD Biosciences, San Jose, CA) and BD Accuri C6 CFlow Sampler software.
3.3.10 RNA sample preparation and hybridization to chip
Total RNA isolation from triplicate samples of empty and wild type JMJD5 clones was performed with Nucleospin RNA kit (MN, Düren, Germany) according to the manufacturer’s protocol. RNA quality was checked using Agilent Bioanalyzer 2100 kit and software (Agilent Technologies, Santa Clara, CA, USA) according to the manufacturer’s protocol. RNA isolates were hybridized to Affymetrix HG_U133_Plus2 chips, applying Affymetrix 3’ IVT hybridization protocol in Bilkent University Bilgen Affymetrix Center for microarray analysis.
3.3.11 Bioinformatics data analyses of JMJD5 microarray samples
Heatmap of JMJD5 probe set (Figure 4.2) was generated using the publically available microarray dataset (GSE6765) [38] downloaded from the gene expression omnibus website. The dataset was normalized using the RMA normalization method. Heatmap was generated using Cluster 3.0 software [39] and Java TreeView software [40].
Microarray raw files of three replicates of empty vector over-expression samples (EGEM_e1a, EGEM_e1b, and EGEM_e1c) and three replicates of wild type (wt) JMJD5 over-expression samples (EGEM_w4a, EGEM_w4b, and EGEM_w4c) were normalized with the RMA method using the BRB_Array_Tools Version 4.2.0 developed by Dr. Richard Simon and BRB-ArrayTools Development Team. Class comparison tool of the BRB_Array_Tools program was used to determine the list of
29
significantly (>1.5 fold and p<0.05) differentially expressed genes between empty vector and wt JMJD5 samples.
In order to determine differing biological mechanisms as a result of over-expression of JMJD5 in SNU449 cells, gene set enrichment analysis (GSEA) experiments were performed using normalized microarray data together with C5_ALL gene ontology gene sets or C6_ALL oncogenic signatures curated gene lists of molecular signature databases (MSigDB).
3.3.12 Sulphordamine B (SRB) assay for cell proliferation
EGEM-w2, EGEM-w4, EGEM-m2, EGEM-m3 and EGEM-e1 clones were seeded on 96-well plates in 2000 cells/well density in triplicates for both Dox (+) and Dox (-) conditions. All the outer wells were filled with 200 µl PBS. Next day, fresh medium containing doxycycline was added to Dox (+) wells, completing the volume in each well to 300 µl and letting the final doxycycline concentration be 2 µg/ml. Cells were cultured for 6 days, replenishing doxycycline from top of the wells every 2 days. Upon reaching the over-confluency, cells were taken out for SRB fixation and staining protocol. The media were discarded very gently, and wells were washed slowly with 200 µl 1X PBS. Fixation was done with 10 % TCA for 1 hour at +4 C° for 1 hour in dark. Cells were washed 4-5 times with dH2O, and plates were allowed
to dry overnight on the bench. 0.4 % SRB solution was prepared by dissolving SRB powder in 1 % acetic acid and applied to the wells as 50 µl/well at room temperature for 20 minutes in dark. After discarding the dye, the plates were washed five times with 1 % acetic acid on plate washer device (BioTek). The plates were left to dry in fume hood for 1 hour, and then they were scanned. 10 mM pH 10.5 cold Tris base from + 4 C° was added into each well, and dye was dissolved by shaking 10 seconds on plate shaker. OD values were then read on Elisa reader (BioTek) at 515 nm primary wavelength, using KC Calbiochem program.
30
3.3.13 SRB assay for Adriamycin resistance
SNU449 TRex, EGEM w4-C2, EGEM w4-C3, EGEM m2-C2, EGEM m2-C4 and EGEM-e1 clones were seeded on 96-well plates in 5000 cells/well density in triplicates. All the outer wells were filled with 200 µl PBS. Next day, medium containing 2X adriamycin and doxycycline was added to all wells, completing the volume in each well to 200 µl and letting the final doxycycline concentration be 2 µg/ml. Adriamycin concentration range was arranged between 10 µg/ml and 0. The cells were incubated for 72 hours, and SRB staining protocol was performed as explained above.
3.3.14 Wound healing assay
Cells were seeded on 6-well plates as 4 x 10⁵ cells/well in complete RPMI medium. Next day, wounding was done with FT200 pipette. Cells were washed with 1X PBS twice. Complete RPMI medium containing 2 µg/ml doxycycline was given to the cells. Cells were incubated at 37 °C, 5 % CO2 for 48 hours. Photos were taken at 0, 24 and 48 hours using the inverted light microscope. 48 hour- cultured cells were then fixed with acetone-methanol (1:1) at -20 °C for 10 minutes and washed with 1X PBS three times. Staining with 1 % cystal violet in 2 % ethanol was performed for 30 minutes at room temperature in dark. Following washing with ddH2O several times,
the photos of the stained cells were taken again.
3.3.15 Soft agar colony formation assay
3.3.15.1 Preparation of base agar
All the glassware, materials and water were sterile. 1 % agar solution was prepared by dissolving in water heating with microwave and cooled to 40 °C in a water bath. 2X DMEM medium, prepared from its powder form adding the missing components according to its datasheet, with 20 % FBS, 2 % penicillin-streptomycin and 2 % non-essential amino acids was left to wait with 1 % agar solution in the water bath for about 30 minutes to equilibrate them. Two solutions were mixed in equal volumes in