https://doi.org/10.1007/s10198-018-0988-9 ORIGINAL PAPER
Health information and life-course smoking behavior: evidence
from Turkey
Dean R. Lillard1 · Zeynep Önder2
Received: 10 August 2017 / Accepted: 7 June 2018
© Springer-Verlag GmbH Germany, part of Springer Nature 2018
Abstract
We investigate whether individuals are less likely to start and more likely to quit smoking in years when newspapers publish more articles about the health risks of smoking. With data from 9030 respondents to the 2008 Global Adult Tobacco Survey in Turkey, we construct respondents’ life-course smoking histories back to 1925 and model initiation and cessation deci-sions taken 1925–2008. To measure information, we count articles published in Milliyet, one of Turkey’s major newspapers. Results from linear probability models show that people who have seen more smoking-health risk articles know more about the smoking–health relationship. Holding constant each individual’s information stock, education, place of residence, and the price of cigarettes, we find that, as new information arrives, male and female smokers in all cohorts are significantly more likely to quit and women are less likely to start. Our analysis is one of the first that examines how new information affects smoking decisions while controlling for each individual’s existing stock of information.
Keywords Information stock and flow · Initiation · Cessation · Life-course smoking history · Turkey JEL Classification I12 · I18 · I20
Introduction
We investigate the role information plays in individual deci-sions to initiate and quit smoking cigarettes. The broader empirical literature shows that consumers’ knowledge is correlated with their consumption, such as breakfast cereal [13] and various types of medical services [10, 15, 24]. Others show that exposure to nutrient information advertis-ing affects food consumption [25] and smoking cessation product advertising affects smoking cessation decisions [1].
Studies that specifically focus on smoking show that people with greater knowledge of the health risks of smoking are less likely to smoke [11, 14, 16].
Cigarette smoking is an interesting case study, because information about and awareness of the health risks of smok-ing increased dramatically dursmok-ing the twentieth century. Between 1954 and 1990, the fraction of survey respond-ents who identified smoking as one of the causes of lung cancer rose from around 40% in 1954 to 95% in 1990 [17]. However, it is not clear what role information played. The smoking prevalence rate of Turkish men started to decline only in the 1990s [22], while US men’s smoking prevalence was declining even before information was widely available [5, 20]. Among younger cohorts of US and Turkish women, smoking prevalence rate actually rose as information about health risks of smoking spread [20, 22].
Existing evidence may be biased, because the existing studies measure information/knowledge people endogenously acquire and because the existing models do not account for heterogeneity in people’s stock of information. Hsieh et al. [11] try to control for endogenous production of knowledge, but their instruments—whether a respondent participated in anti-smoking activities, agrees with smoking restrictions,
Electronic supplementary material The online version of this
article (https ://doi.org/10.1007/s1019 8-018-0988-9) contains
supplementary material, which is available to authorized users. * Dean R. Lillard
[email protected] Zeynep Önder [email protected]
1 Department of Human Sciences, Ohio State University,
DIW-Berlin, NBER, 1787 Neil Avenue, Columbus, OH 43210, USA
2 Faculty of Business Administration, Bilkent University,
recalls having recently seen anti-smoking advertising, or was aware of the government’s regulation of smoking— are themselves endogenous or may suffer from recall bias. Jones and Kirigia [14] jointly estimate the probability that a woman smokes and the probability she knows that “smoking has negative consequences”. More recently, Cheng et al. [3] use the latent variable approach to adjust for the knowledge about health effects of smoking from the 2010 Global Adult Tobacco Survey in China. Our analysis is closest to Lillard [21]. He who uses US data to show that information affects the probability smokers quit and that people with different levels of education respond in different ways to changes in information flows. With the exception of Lillard [21], these studies, and the broader literature, lack measures of the flow of information, either overall or specific to particular indi-viduals. Further existing literature investigates the correlation between smoking behavior and either a person’s information stock or the flow of (new) information but not both.
We improve on the literature in several ways. First, we model individual smoking decisions taken over most of the twentieth century—when the information landscape changed dramatically. Second, to our knowledge, ours is the first study to use longitudinal data to model how information affects smoking behavior of developing country residents. Third, most studies investigate smoking participation. We investi-gate separately the decision to start and stop smoking. Fourth, ours is one of the first studies to include both the stock and flow of information. Finally, we explore whether information effects are heterogeneous across demographic groups that plausibly differ in how much they know and how likely they are to be exposed to new information. Our results suggest that the arrival of information reduces the probability of initiation decisions of women in some cohorts and causes smokers of both sexes to be significantly more likely to quit.
We next briefly describe the social, economic, and politi-cal contexts in Turkey over our sample period, describe the tobacco market, and review Turkey’s tobacco control history. In the next section, we describe the data. In the following section, we frame our empirical analysis, and describe the models and estimation methods. In the next section, we pre-sent results. To conclude, we interpret our results and point to directions that future research might take and possible policy implications.
Background on tobacco consumption
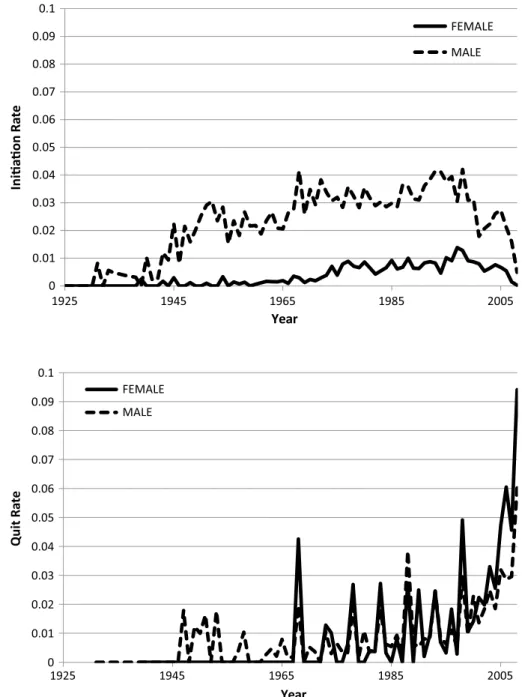
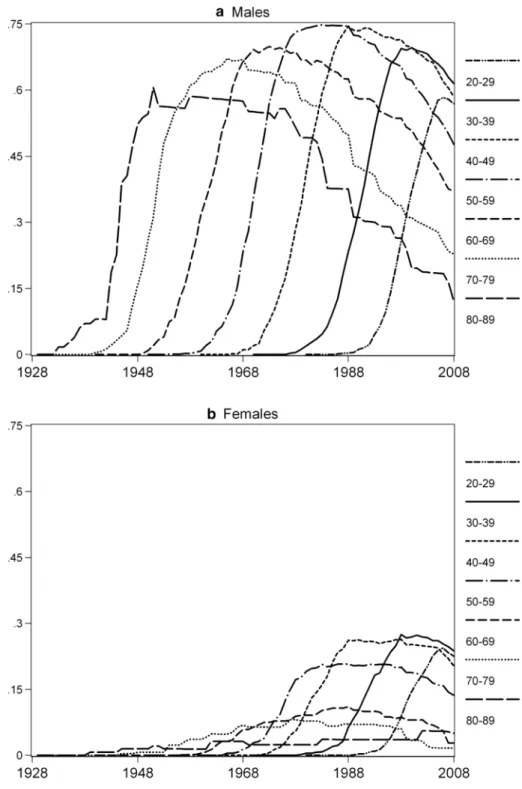
Turkey is an interesting case study. Between 1925 and 2008, the tobacco market and tobacco taxes changed dramatically, the economy expanded, per capita income rose, and smoking prevalence of successive Turkish cohorts of men and women rose and fell (see Fig. 1). Until 1984, Turkey’s tobacco industry operated as a state-owned monopoly called TEKEL
and foreign tobacco products were banned [27]. In 1984, the government began to dismantle the monopoly when they allowed foreign companies export their products to Turkey. They granted TEKEL the exclusive right to import, price, and distribute foreign and domestic brands until 1986. They let foreign companies partner with TEKEL to manufac-ture locally in 1986 and establish independent production facilities in 1991. Although the government never allowed television and radio advertising of tobacco, they let firms advertise in print media and posters. From 1984 to 1996 international firms aggressively advertised foreign but not domestic brands. Nevertheless, over the next decade, total cigarette consumption increased.
Over our sample period consumers faced widely vary-ing tobacco control policies. For example, nominal and real cigarette prices varied tremendously, because the govern-ment changed its taxes on cigarettes and tobacco, while it simultaneously created and tamed inflation [22, 23]. Ciga-rette taxes varied from 44% of their retail price in the 1960s to 82.25% of a pack’s retail price by 2014.
The government enacted other tobacco control policies sporadically from 1981 to 1996 and thereafter more system-atically. These policies include a warning label on cigarette packages enacted in 1981 and strengthened in 1991 and 1996. A 1996 tobacco control law that banned advertising, smok-ing in many public places, made it illegal for firms to print tobacco brand names on non-tobacco products, and to sell cig-arettes and other tobacco products to youth under age 18. In 2002, the government established an independent agency with broad authority to regulate tobacco markets. Turkey signed the World Health Organization’s Framework Convention on Tobacco Control in 2004; strengthened the warning label wording and its size on packages in 2005, further restricted to whom and how firms could market tobacco in 2008, and banned smoking in more public places in 2008 and 2009.
Data
Data on smoking and demographics
We draw data on individual smoking behavior from 9,030 respondents to the 2008 Global Adult Tobacco Survey in Tur-key [9]. The nationally representative sample of adults aged 15 and older provided demographic data, answered questions on contemporaneous and retrospective smoking behavior, and whether they know the relationship between smoking and smoking-related illnesses (Turkish Ministry of Health 2010).
Tables 1 and 2 report time-invariant demographic char-acteristics, smoking behavior, and knowledge of the smok-ing-health relationship (including the single factor from the principal component analysis). Relative to men, Turkish
women attain less education, are less likely to smoke, and are less knowledgeable about the health effects of smoking. In 2008, 48.0% of Turkish men and 15.2% of Turkish women were current smokers. In addition, the average male smoker started when he was 17.1 years old, 2.8 years before the average female first smoked (19.9). On average, male and female smokers quit when they are 38.0 and 32.9, respec-tively. For more details about smoking patterns over the whole life-course of the GATS 2008 sample, see Önder [22].
Table 2 presents the 2008 smoking prevalence rate by sex, education level, and rural/urban residents. More peo-ple smoked in urban (33.1%) than rural areas (27.2%). The smoking prevalence rate follows an inverted U-shape across schooling levels—a pattern typical of develop-ing countries. On average, across samples with primary schooling or less, secondary, and high school education, the smoking prevalence rate rises from 28.2 to 31.1 to 40.8% respectively, and then drops to 31.8% among people who graduated from college.
Fig. 1 Smoking prevalence rates over the life-course by gender and birth cohort. Source:
Data on information about the health risks of smoking
Our data on information consist of articles, published in US magazines and a Turkish newspaper, Milliyet, that warn readers about the health risks of smoking. We use articles
published in Milliyet not only because it is one of the Turkey’s leading newspapers but also because it is the only Turkish newspaper that provides the archives of news since 1950. In terms of sales, it ranked fifth in 1969 [26] and first in 1990 [7]. We use the number of articles published in Milliyet as a direct proxy for information. We also use the number of articles published in popular US consumer magazines as an instrumental variable to predict the flow of articles appearing in Milliyet in any given year. We draw US data from the His-torical Reader’s Guide to Periodical Literature and Proquest. There are 2835 articles published from 1925 to 2008 in the US consumer magazines [19] and 1017 articles published from 1950 to 2008 in Milliyet. Since Milliyet’s electronic archives track articles published in 1950 and later, we assume that no articles were published before 1950. In the 5-year period from 1951 to 1955 and from 1956 to 1960, Milliyet published a total of 24 and 14 articles about health risk of smoking, respec-tively. While some articles may have appeared before 1950, it is unlikely to have been many.
Other control variables
We control for each respondent’s attained schooling using four dummy variables (primary school, middle school, high school, and college graduates), sex, age, and whether they live in an urban or a rural area. These data measure the respondent’s status in 2008.
Time series data
To each respondent in every year, we append annual data on the log of per capita Gross Domestic Product, percent of the population living in urban areas, and the average cigarette price. Data on the average price per pack of 20 cigarettes for 1925–1960 come from an unpublished TEKEL compila-tion [12]; 1961–2002 from the Turkish Institute of Statistics; 2003–2008 from the Regulatory Board of the Markets for Tobacco, Tobacco Products, and Alcoholic Beverages. We convert all prices to real 2008 lira.
Method
Dependent variables
Although GATS 2008 is a cross-sectional survey, we construct annual indicators of smoking initiation and smoking cessation with data on whether and how often a respondent currently smokes or formerly smoked, the age that she began to smoke, and how long ago ex-smokers quit. Each individual contributes an observation when she is “at risk” to start (quit) smoking. The initiation variable (Startit) is zero from the year that a person was
Table 1 Sample characteristics. Source: GATS [9]
Standard deviations are reported in parentheses
Figures in percentages except those with standard deviations. The knowledge index is the first factor from a principal component analy-sis
All Females Males
Male 47.1
Rural residence 30.3 30.4 30.3
Age 39.3 (16.4) 39.6 (16.7) 38.9 (16.2)
Education
No degree, < 5 years 17.2 26.7 7.3
Primary 39.1 38.1 40.0 Secondary 16.7 13.4 20.2 High school 18.1 14.9 21.5 College or more 8.9 6.9 11.0 Income proxy 7.4 (1.5) 7.3 (1.5) 7.4 (1.4) Unemployed 12.6 4.6 20.9 Current smoker 31.3 15.2 48.0 Ex-smoker 15.9 10.0 22.0 Start age 17.7 (5.7) 19.9 (7.1) 17.1 (5.0) Quit age 36.4 (14.5) 32.9 (13.4) 38.0 (14.3) Knowledge smoking-health
Causes serious diseases 97.2 96.7 97.8
Causes stroke 82.1 80.4 83.7
Causes heart attack 93.6 92.8 94.4
Causes lung cancer 96.1 95.5 96.8
Knowledge index from principal component analysis
0.00 (1.00) − 0.07 (1.16) 0.08 (0.77)
N 9030 4761 4269
Table 2 Smoking prevalence rate (%) by gender and place of
resi-dence. Source: GATS [9]
All Primary Secondary High school College or more
All 31.3 28.2 31.1 40.8 31.8 Urban 33.1 30.3 31.5 41.4 31.4 Rural 27.2 24.8 30.2 37.7 34.7 Female 15.2 12.4 14.4 25.6 20.2 Urban 18.7 16.0 17.0 27.4 20.3 Rural 7.2 6.6 6.7 11.4 19.7 Male 48.0 50.7 42.6 51.8 39.3 Urban 47.9 50.9 42.2 52.7 38.9 Rural 48.2 50.3 43.5 48.3 41.4
born until either 2008 (for never-smokers) or the year she first smoked. In the year she started, Startit equals 1. In every year, thereafter, it is missing. The cessation variable (Quitit) equals 0 from the year smokers started until either 2008 or the year they quit. The year an ex-smoker quit, Quitit equals 1. In years which respondents did not smoke, Quitit is missing. Although this algorithm ignores temporary quits, smoking status from retrospec-tive reports matches well with smoking behavior that is contemporaneously measured [4, 18]. Following evidence from Christopoulou et al. [4], we restrict the smoking cessation sample to respondents who were age 70 or younger when surveyed. This sample restriction avoids
bias caused by the higher rate of mortality of smokers versus non-smokers.
We restrict the initiation sample to people ages 9–25, because almost no Turkish smokers start outside this range. We limit the cessation sample to people who have started to smoke. After dropping respondents with miss-ing data, the initiation and cessation samples, respec-tively, include 302,558 person-year (8997 persons) and 94,861 person-year (4230 persons) observations.
Figures 2 and 3 plot men and women’s average rate of initiation and cessation from 1925 to 2008. On average, men are more likely to start and less likely to quit smok-ing than women.
Fig. 2 Smoking initiation rate 1925–2008, by gender. Source: GATS [9] 0 0.01 0.02 0.03 0.04 0.05 0.06 0.07 0.08 0.09 0.1 1925 1945 1965 1985 2005 Ini a on Ra te Year FEMALE MALE
Fig. 3 Smoking cession rate 1925–2008, by gender. Source: GATS [9] 0 0.01 0.02 0.03 0.04 0.05 0.06 0.07 0.08 0.09 0.1 1925 1945 1965 1985 2005 Quit Ra te Year FEMALE MALE
Constructing the information measures: stock and flow
We measure each person’s stock of information as the accumulated sum of articles published in Milliyet from the year a person was age 9 to year t − 1. We measure the information flow variable as the number of Milliyet arti-cles published in year t. Figure 4 plots the flow of articles published each year from 1925 to 2008. The flow of infor-mation increased in recent years because of the massive tobacco control activities of the government.
Our information flow variable is likely to be correlated with information people got more generally because many Turkish people read newspapers. In the 1970s, 89% of all people and 80% of rural residents read newspapers daily. Furthermore, almost half of illiterate adults listened to people who read newspapers out loud [26].
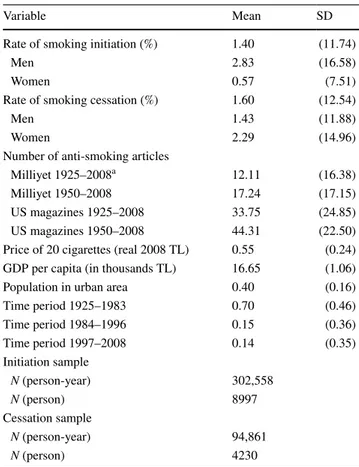
Table 3 summarizes the data that vary over time. In the average year between 1925 and 2008, initiation rates were 2.8 and 0.6% for men and women respectively. Cessation rates were 1.4 and 2.3% for men and women, respectively. On average, Milliyet published 12.1 articles and the US consumer magazines published 33.8 articles per year. Restricted to the years 1950–2008, 17.2 and 44.3 articles on the health risks of smoking appeared in Milliyet and US magazines, respectively. A pack of 20 cigarettes costs 0.55 TL (US$ 0.36). Over the period, urbanization averaged 40%; rising from 24.2 to 69.6% between 1925 and 2008.
Validating the measure of information stock
T validate our information stock variable calculated from the number of published newspaper articles, we did regression
Fig. 4 Anti-smoking articles in Milliyet and US consumer magazines 1925–2008. Source: Authors’ tabulations 0 20 40 60 80 100 120 1925 1945 1965 1985 2005 Number of Ar cle s Year Milliyet US Consumer Magazines
Table 3 Descriptive statistics of time-varying variables. Source:
GATS [9]
a We assume that Milliyet published no articles about the health risk
of smoking from 1925 to 1949
Variable Mean SD
Rate of smoking initiation (%) 1.40 (11.74)
Men 2.83 (16.58)
Women 0.57 (7.51)
Rate of smoking cessation (%) 1.60 (12.54)
Men 1.43 (11.88)
Women 2.29 (14.96)
Number of anti-smoking articles
Milliyet 1925–2008a 12.11 (16.38)
Milliyet 1950–2008 17.24 (17.15)
US magazines 1925–2008 33.75 (24.85)
US magazines 1950–2008 44.31 (22.50)
Price of 20 cigarettes (real 2008 TL) 0.55 (0.24)
GDP per capita (in thousands TL) 16.65 (1.06)
Population in urban area 0.40 (0.16)
Time period 1925–1983 0.70 (0.46) Time period 1984–1996 0.15 (0.36) Time period 1997–2008 0.14 (0.35) Initiation sample N (person-year) 302,558 N (person) 8997 Cessation sample N (person-year) 94,861 N (person) 4230
and principal component analyses using the 2008 GATS data. In the survey, they ask, “To your knowledge and in your opinion, does tobacco use cause: (a) serious diseases; (b) stroke; (c) heart attack; or (d) lung cancer?” We create indicators of knowledge with the answers to these questions and estimate models that are given by:
where Knowi is a dummy variable taking a value of 1 if individual i responds that smoking causes that disease, and 0 otherwise; Istocki is the information variable that varies with the birth year of each individual. It is the accumulated number of articles about health risk of smoking published in Milliyet. Xi is a vector of demographic characteristics that include age, sex, rural residence, unemployment, edu-cational attainment (four categories), and a proxy for house-hold income. We estimate a linear probability model for each separate response.
We also run an ordinary least-squares (OLS) model on the simple sum of the four variables indicating the knowl-edge about health effects of smoking and the predicted first component from a principal component analysis using 8859 observations with valid responses on all four vari-ables. That analysis yields only one factor (eigenvalue of 2.25) that loads on the four data as: 0.711 × serious dis-eases + 0.620 × Stroke + 0.820 × heart attack + 0.833 × lung cancer. This evidence suggests that the answers to these questions represent a single underlying latent variable. Therefore, we use principal components analysis to reduce the data from four dimensions to only one dimension.
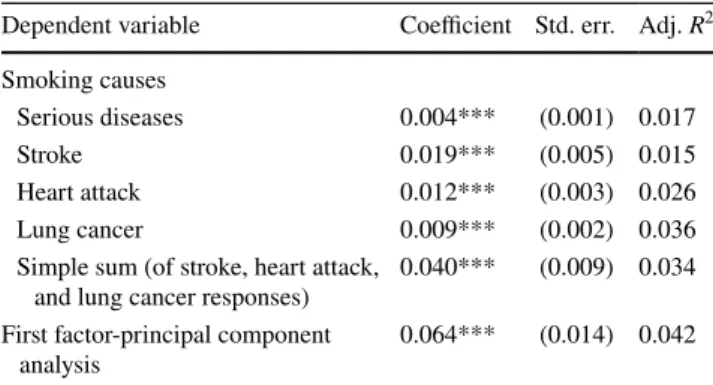
Table 4 shows that no matter how we characterize knowl-edge, i.e., answers to health effects questions or the factor from principal component analysis, a person’s information stock (IStock) positively predicts his or her knowledge. The results imply that seeing an extra 100 articles raises (1) Knowi=𝛿0+𝛿1Istocki+𝛿2Xi+𝜀i,
the probability that a person correctly identifies smoking as the cause of specific underlying health conditions by between 0.4 and 1.9% points. Seeing another 100 articles raises the two indices of knowledge (measured as either the simple sum of responses or the weighted sum of responses) by between 4.0 and 6.4% points. We present the estimated coefficients of the full models in the Appendix (Electronic Supplementary Material) Table A1.
Decisions to start or to stop smoking
We estimate a model of the probability that person i starts smoking or stops smoking in year t. The basic model for any given outcome (initiation or cessation) is given by:
where Outcomeit represents a dummy variable for smok-ing initiation (Startit) or cessation (Quitit). Startit is 0 when individual i is 9 years old or older and it is 1 in year t if individual i starts smoking in year t. It is missing after year
t for smokers. This variable will be zero for all non-smokers.
Quitit is a dummy variable which is equal to 0 for smoker i until i quits smoking in year t, 1 in year t when individual
i quits smoking, and is missing after year t. IStockit and IFlowit indicate the stock and flow of information respec-tively. We control for the real price of cigarettes, Pt , and a vector, Yt , that includes real GDP per capita, the urbanization rate, and dummy variables to flag years when Turkey had low and high levels of tobacco control laws. These variables only have a year subscript, because their value is the same for all individuals in a given year. The vector Xit includes age and time-invariant variables we only observe in 2008. The latter includes education, employment status, birth cohort, and a proxy for household income. 𝜏t includes two indicators that flag years that are evenly divisible by 5 and calendar years that differ from the survey year 2008 by a multiple of 5. These variables control for the attenuation bias associated with heaping in retrospectively reported event data [2]. We specify similar models for smoking cessation but add the age that a person started smoking and interaction variables between price and the heaping indicator variables. The basic model specified in Eq. (2) is estimated by OLS.
We also estimate the basic model by the method of instru-mental variables (IV). We do so to allow for the possibility that variation in factors omitted from the model, such as income, employment conditions, or educational reforms, might simultaneously determine smoking decisions and be correlated with the appearance of anti-smoking articles. We predict the variation in Milliyet articles with the number of articles published in popular US consumer magazines in the same year and use the predicted information flow variable (2) Outcomeit=a0+a1IStockit+a2IFlowit
+a3Pt+a4Yt+a5Xit+a6𝜏t+𝜀it,
Table 4 Coefficient on information stock (IStock) in models estimat-ing individuals’ knowledge of the smokestimat-ing–health relationship
All models control for each respondent’s age, sex, rural residence, unemployment status, educational attainment (four categories), and household income
*** All coefficients statistically differ from zero with p value ≤ 0.01
Dependent variable Coefficient Std. err. Adj. R2
Smoking causes
Serious diseases 0.004*** (0.001) 0.017
Stroke 0.019*** (0.005) 0.015
Heart attack 0.012*** (0.003) 0.026
Lung cancer 0.009*** (0.002) 0.036
Simple sum (of stroke, heart attack,
and lung cancer responses) 0.040*** (0.009) 0.034
First factor-principal component
( ̂IFlowit) . in the IV estimations.1 Though we do not report them here, the F-statistics on the instrument exceed 10 in all cases. We report first-stage results in an Appendix readers can request.
The basic model for either outcome (Startit and Quitit) is given by (IV-1):
We estimate all models separately by sex.
Because people in different cohorts got different informa-tion about the health risks of smoking, we specify models that allow the effect of information to vary across cohorts. Because older cohorts began to smoke before information was available, information could not have plausibly affected their initiation but might have affected their cessation deci-sions. In the youngest cohort, the arrival of new information likely affected both decisions.
To allow for cohort-specific heterogeneity, we interact the information flow variable with cohort indicators. Generi-cally (for both outcomes), we specify (IV-2):
where Cik indicates a vector of dummy variables for birth cohort k who, in 2008, were age 10–19, 20–29, 30–39, 40–49, 50–59, and 60 and older. For the cessation model estimated on the sample of women, we drop the 10–19 cohort indicators, because almost no women quit smoking at those ages.
We explore whether people with different levels of educa-tion behave differently when new smoking-health-risk infor-mation arrives. More educated people may respond differ-ently to new information than less educated people, because they have a lower discount rate, are more risk averse, may be better able to process information, or may simply be more likely to read the newspaper. To allow for these possibilities, we interact the information flow variable not only with the (3) Outcomeit=𝛽0+𝛽1IStockit+𝛽2IFloŵit+𝛽3Pt+𝛽4Yt
+ 𝛽5Xit+𝛽6Start Ageit + 𝛽7𝜏t+𝛽8Pt×𝜏t+𝜀it. (4) Outcomeit=𝛼0+ 6 ∑ k=1 𝛼kIFloŵit×Cik+𝛼7IStocki +𝛼8Pt+𝛼9Yt+𝛼10Xit+a11𝜏t+𝜀it,
level of education Eik (primary school, secondary school, high school (ref), and college or more indicators) but also with the cohort indicators. We estimate the model given by (IV-3):
We explore whether these relationships differ for people living in urban and rural areas. We add an interaction with an indicator that flags people living in urban areas (IV-4):
where Urbanil identifies whether a person was living in an urban or non-urban area in 2008.
The last model considers the interaction with education levels and investigates how the effect of information flow changes with education, living in rural or urban areas at dif-ferent birth cohorts (IV-5):
All models with interaction terms include the level of the variables that are interacted and the control vari-ables described above. For example, in IV-5, in addi-tion to the four-way interacaddi-tion (informaaddi-tion × educa-tion × cohort × rural residence), we include the dummy variables for rural residence, three of the four education categories (reference category—college or more), and five of the six cohorts (reference category—people age 10–19 in 2008). Because these models are complicated, we do not present the full set of coefficients. Instead, for each model, we compute the marginal effect of observing 100 more arti-cles. We report those estimated effects in a separate table. We estimate the same specifications for the cessation mod-els. All results are available on request.
Results
Smoking initiation
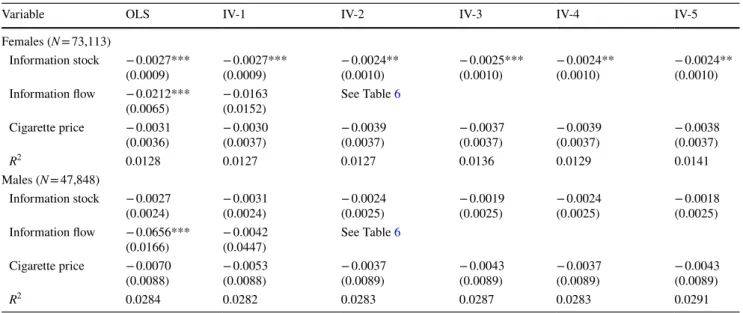
Table 5 presents selected coefficients from the smoking initiation models. Results for females and males are in the top and bottom panels, respectively. The column headings (5) Outcomeit=𝛼0+ 4 ∑ j=1 6 ∑ k=1 𝛼jkIFloŵit×Eik×Cij+𝛼5IStocki +𝛼6Pt+𝛼7Yt+𝛼8Xit +a9𝜏t+𝜀it. (6) Outcomeit=𝛼0+ 6 ∑ k=1 2 ∑ l=1
𝛼klIFloŵit×Cij×Urbanil + 𝛼5IStocki +𝛼6Pt+𝛼7Yt+𝛼8Xit+a9𝜏t+𝜀it, (7) Outcomeit=𝛼0+ 4 ∑ j=1 6 ∑ k=1 2 ∑ l=1 𝛼jklIFloŵit×Eik×Cij×Urbanil +𝛼5IStocki+𝛼6Pt+𝛼7Yt+𝛼8Xit+a9𝜏t+𝜀it.
1 Demez [8] states that the majority of health-related articles
pub-lished in the Turkish newspapers are the interpretation and views of experts—mainly medical doctors. These experts were more likely to follow the health-related research and attend medical conferences. This trend is observed not only in recent years but also in the 1950s. Information flow from abroad to Turkey was free during the sample period and Americanization started to affect cultural life in Turkey
after the World War II [6]. Therefore, it is reasonable to use the
num-ber of articles published in the US magazine as an instrument for the articles published in the Turkish newspaper.
indicate the model which we use to estimate the coefficients. The F-statistics on the US articles in the first-stage IV mod-els of the modmod-els differ statistically from zero at the 0.1% significance level, shown in the Appendix as Electronic Sup-plemental Material.
In the OLS and IV models, the coefficient on the informa-tion stock is negative for both men and women but statisti-cally differs from zero only for women. The OLS results suggest that men and women are much less likely to start smoking in years which they get more information. But once we instrument the flow of information in IV-1, the effect is still negative but does not statistically differ from zero. The coefficient on the cigarette price is negative but not sta-tistically different from zero in all models. The sign and significance of coefficients are similar when the models are estimated using either probit or logit models. Results from those models are available upon request.
In Table 6, we present the predicted effect of a change in information flow. The estimates represent the implied change in the probability of smoking initiation that would occur if a person in each demographic group saw an additional 100 articles about the health risks of smoking. Coefficients in boldface statistically differ from zero with a p value less than or equal to 0.05. In an Appendix (available on request), we present results of tests of the joint significance of all coefficients involving the information flow and tests of the
hypothesis that the coefficients on the information flow vari-able are equal across demographic groups.
Results in Table 6 suggest that seeing 100 more articles about the health risks of smoking will not change the prob-ability that the average woman or the average man starts to smoke (IV-1). However, results from IV-2 to IV-5 show that responses to information systematically differ for women of different ages, education, and who live in rural areas. Because we find no evidence of heterogeneous effects for men, we only discuss results for women.
Table 6 suggests that women age 10–49 are less likely to start smoking in years which they see more information but that these effects are statistically significant only in certain age and demographic groups. There is some evidence which suggests that older better educated women are more likely to start smoking in years that they see more information. IV-2 results imply that seeing 100 more articles would lower the initiation probability of the average women age 10–19 and 30–39 by 3.6 and 4.4% points, respectively. When one allows this effect to vary across women of different levels of education, in IV-3, results suggest that extra information has its biggest effect on women with less education and those living in rural areas. IV-3 results suggest that women age 30–39 and 40–49 with primary schooling are, respectively, 5.7 to 6% points less likely to start smoking. IV-5 results imply that, for women age 30–39 and 40–49 with primary
Table 5 Selected results: model of smoking initiation
All models control for age in 2008, age, age-squared, rural residence, indicators for primary, middle, and high school education (omitted cat-egory is college), 2008 cohort indicators 10–19 (reference), 20–29, 30–39, 40–49, 50–59, and 60+, unemployed, household income, heaping indicators for years separated from the survey year by a multiple of 5 years and calendar years evenly divisible by 5, indicators for observations from 1925 to 1983 and 1997 to 2008 (reference period 1984–1996), log of per capita gross domestic product, the fraction of the population liv-ing in urban areas, and an intercept. We include the information flow variable interacted with the cohort indicators (Model II), education × cohort indicators (Model III), rural residence × cohort indicators (Model IV), and rural residence × education × cohort indicators (Model V). Standard errors in parentheses
*** and** denote coefficients with p values ≤ 0.01 and 0.05, respectively
Variable OLS IV-1 IV-2 IV-3 IV-4 IV-5
Females (N = 73,113) Information stock − 0.0027*** (0.0009) − 0.0027***(0.0009) − 0.0024**(0.0010) − 0.0025***(0.0010) − 0.0024**(0.0010) − 0.0024**(0.0010) Information flow − 0.0212*** (0.0065) − 0.0163(0.0152) See Table 6 Cigarette price − 0.0031 (0.0036) − 0.0030(0.0037) − 0.0039(0.0037) − 0.0037(0.0037) − 0.0039(0.0037) − 0.0038(0.0037) R2 0.0128 0.0127 0.0127 0.0136 0.0129 0.0141 Males (N = 47,848) Information stock − 0.0027 (0.0024) − 0.0031(0.0024) − 0.0024(0.0025) − 0.0019(0.0025) − 0.0024(0.0025) − 0.0018(0.0025) Information flow − 0.0656*** (0.0166) − 0.0042(0.0447) See Table 6 Cigarette price − 0.0070 (0.0088) − 0.0053(0.0088) − 0.0037(0.0089) − 0.0043(0.0089) − 0.0037(0.0089) − 0.0043(0.0089) R2 0.0284 0.0282 0.0283 0.0287 0.0283 0.0291
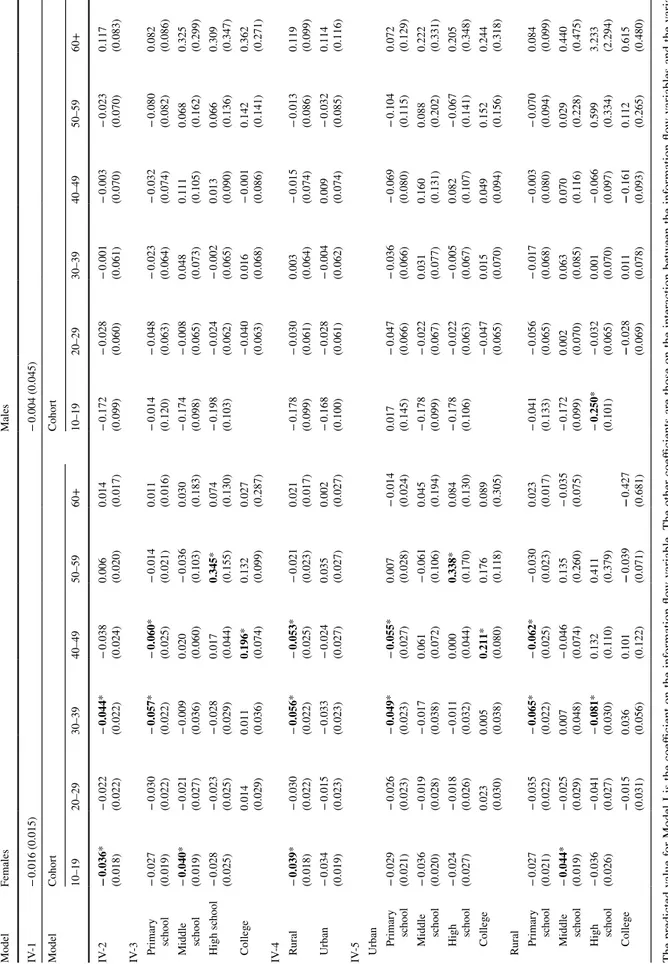
Table 6 Pr edicted c hang e in initiation pr obability giv en incr ease of 100 anti-smoking ar ticles, b y ag e, education, bir th cohor t, and r esidence The pr edicted v alue f or Model I is t he coefficient on t he inf or mation flo w v ar iable. The o ther coefficients ar e t hose on t he inter action be tw een t he inf or mation flo w v ar iables and t he v ar iables lis ted in t he no te t o T able 5 St andar d er rors in par ent heses * and boldf ace te xt deno tes coefficients t hat s tatis ticall y differ fr om zer o wit h p v alues ≤ 0.05 Model Females Males IV -1 − 0.016 (0.015) − 0.004 (0.045) Model Cohor t Cohor t 10–19 20–29 30–39 40–49 50–59 60+ 10–19 20–29 30–39 40–49 50–59 60+ IV -2 − 0.036 * (0.018) − 0.022 (0.022) − 0.044 * (0.022) − 0.038 (0.024) 0.006 (0.020) 0.014 (0.017) − 0.172 (0.099) − 0.028 (0.060) − 0.001 (0.061) − 0.003 (0.070) − 0.023 (0.070) 0.117 (0.083) IV -3 Primar y sc hool − 0.027 (0.019) − 0.030 (0.022) − 0.057 * (0.022) − 0.060 * (0.025) − 0.014 (0.021) 0.011 (0.016) − 0.014 (0.120) − 0.048 (0.063) − 0.023 (0.064) − 0.032 (0.074) − 0.080 (0.082) 0.082 (0.086) Middle sc hool − 0.040 * (0.019) − 0.021 (0.027) − 0.009 (0.036) 0.020 (0.060) − 0.036 (0.103) 0.030 (0.183) − 0.174 (0.098) − 0.008 (0.065) 0.048 (0.073) 0.111 (0.105) 0.068 (0.162) 0.325 (0.299) High sc hool − 0.028 (0.025) − 0.023 (0.025) − 0.028 (0.029) 0.017 (0.044) 0.345 * (0.155) 0.074 (0.130) − 0.198 (0.103) − 0.024 (0.062) − 0.002 (0.065) 0.013 (0.090) 0.066 (0.136) 0.309 (0.347) Colleg e 0.014 (0.029) 0.011 (0.036) 0.196 * (0.074) 0.132 (0.099) 0.027 (0.287) − 0.040 (0.063) 0.016 (0.068) − 0.001 (0.086) 0.142 (0.141) 0.362 (0.271) IV -4 Rural − 0.039 * (0.018) − 0.030 (0.022) − 0.056 * (0.022) − 0.053 * (0.025) − 0.021 (0.023) 0.021 (0.017) − 0.178 (0.099) − 0.030 (0.061) 0.003 (0.064) − 0.015 (0.074) − 0.013 (0.086) 0.119 (0.099) U rban − 0.034 (0.019) − 0.015 (0.023) − 0.033 (0.023) − 0.024 (0.027) 0.035 (0.027) 0.002 (0.027) − 0.168 (0.100) − 0.028 (0.061) − 0.004 (0.062) 0.009 (0.074) − 0.032 (0.085) 0.114 (0.116) IV
-5 Urban Primar
y sc hool − 0.029 (0.021) − 0.026 (0.023) − 0.049 * (0.023) − 0.055 * (0.027) 0.007 (0.028) − 0.014 (0.024) 0.017 (0.145) − 0.047 (0.066) − 0.036 (0.066) − 0.069 (0.080) − 0.104 (0.115) 0.072 (0.129) Middle sc hool − 0.036 (0.020) − 0.019 (0.028) − 0.017 (0.038) 0.061 (0.072) − 0.061 (0.106) 0.045 (0.194) − 0.178 (0.099) − 0.022 (0.067) 0.031 (0.077) 0.160 (0.131) 0.088 (0.202) 0.222 (0.331) High sc hool − 0.024 (0.027) − 0.018 (0.026) − 0.011 (0.032) 0.000 (0.044) 0.338 * (0.170) 0.084 (0.130) − 0.178 (0.106) − 0.022 (0.063) − 0.005 (0.067) 0.082 (0.107) − 0.067 (0.141) 0.205 (0.348) Colleg e 0.023 (0.030) 0.005 (0.038) 0.211 * (0.080) 0.176 (0.118) 0.089 (0.305) − 0.047 (0.065) 0.015 (0.070) 0.049 (0.094) 0.152 (0.156) 0.244 (0.318) R ur al Pr imar y sc hool − 0.027 (0.021) − 0.035 (0.022) − 0.065 * (0.022) − 0.062 * (0.025) − 0.030 (0.023) 0.023 (0.017) − 0.041 (0.133) − 0.056 (0.065) − 0.017 (0.068) − 0.003 (0.080) − 0.070 (0.094) 0.084 (0.099) Middle sc hool − 0.044 * (0.019) − 0.025 (0.029) 0.007 (0.048) − 0.046 (0.074) 0.135 (0.260) − 0.035 (0.075) − 0.172 (0.099) 0.002 (0.070) 0.063 (0.085) 0.070 (0.116) 0.029 (0.228) 0.440 (0.475) High sc hool − 0.036 (0.026) − 0.041 (0.027) − 0.081 * (0.030) 0.132 (0.110) 0.411 (0.379) − 0.250 * (0.101) − 0.032 (0.065) 0.001 (0.070) − 0.066 (0.097) 0.599 (0.334) 3.233 (2.294) Colleg e − 0.015 (0.031) 0.036 (0.056) 0.101 (0.122) − 0.039 (0.071) − 0.427 (0.681) − 0.028 (0.069) 0.011 (0.078) − 0.161 (0.093) 0.112 (0.265) 0.615 (0.480)
education, effects that are stronger in rural (6.5 and 6.2% points respectively) than in urban areas (4.9 and 5.5% points respectively). IV-5 also suggests that high school educated women in rural areas would be 8.1% points less likely to start smoking if they saw 100 more articles.
Finally, there are two anomalous results from IV-3 for women age 40–49 who are college educated and for women 50–59 who have a high school education. These anomalies can be explained by the limited number of observations, observing fewer articles until 1980s, changes in the socio-economic conditions of women with the changes in social norms and financial liberalization in 1980 as well as the entrance of international tobacco companies with aggressive marketing activities.
We formally test whether people react differently to information flows by education, age group, and urban/rural residence by testing for the equality of coefficients on the information flow variable interacted with each of these cat-egories. We report the Chi-square statistics in an Appendix that readers may request.
Those tests reject the hypothesis that the coefficient on information flow is equal across women in rural areas. For women with a given level of education, we reject the hypoth-esis that the coefficient on the information flow variable is the same for women age 30–39 and 40–49 relative to women in other age groups and the hypothesis that the coefficients on the information flow variable are equal across women in different age groups living in urban areas and with either primary school or high school education.
Taken together, these results present a pattern that is consistent with the hypothesis that exposure to health risk information affects decisions of women to start smoking. We find a consistent and statistically significant effect for women who are middle-aged or young in 2008, less educated, and living in rural areas. While we also find anomalous results, the overall pattern suggests that information matters.
Smoking cessation
Table 7 presents selected coefficients from the smoking ces-sation models. Results for females and males are in the top and bottom panels, respectively. The column headings indi-cate the model which we use to estimate the coefficients. The F-statistics on the US articles in the first-stage IV models of the models differ statistically from zero at the 0.1% signifi-cance level, as reported in the Appendix.
In the OLS and IV models, the coefficient on the informa-tion stock is negative for both men and women and statisti-cally differs from zero. The OLS results suggest that men and women are much less likely to quit smoking in years they get more information even after we instrument the flow of information in the first IV model, IV-1. The coefficient on the cigarette price is positive but not statistically different
from zero for women. For men, the price coefficient is sta-tistically significant in the OLS and IV-1. However, it is not significant in the models that include the information flow interactions.
In Table 8, we present the predicted effect of a change in information flow. The estimates represent the implied change in the probability of smoking cessation that would occur if a person in each demographic group saw an additional 100 articles about the health risks of smoking. We test the joint significance of all coefficients involving the information flow and test the hypothesis that the coefficients on the infor-mation flow variable are equal across demographic groups. We report those statistics in Appendix readers which may request.
Results in Table 8 suggest that seeing 100 more articles about the health risks of smoking raises the probability of quitting for both women and men. A greater flow of infor-mation raises the cessation probability among the average female smoker age 20–39 and average male smoker age 20–59. In these age groups, extra 100 articles will increase the predicted cessation probability by 8–11.3 and 4.2–8.7% points for women and men, respectively. Information affects cessation decisions of men across all levels of education attainment and in both urban and rural areas of Turkey and women in young cohorts (aged 20–39) regardless of their education level or rural/urban location.
Formal tests of equality of the effect of information across age/education/place of residence groups reject the hypoth-esis that information affected smoking cessation behavior equally for women of different ages (IV-2) and across rural and urban areas (IV-4). We cannot reject the hypothesis that information affects cessation decisions of men equally across age groups and separately in rural and urban areas. The tests suggest that information affects cessation decisions differ-ently for men of different ages and education (IV-5). The tests suggest that information affects cessation decisions differently across women with primary school education of different ages regardless of their location (IV-5).
Robustness checks
A potential challenge to our interpretation is that the flow of information varies in the same way as do unobserved determinants of smoking. For example, starting in 1984, the government not only allowed foreign firms to sell cigarettes in Turkey and allowed cigarette advertising, they also lib-eralized markets more generally. We test whether smokers reacted differently to articles published between 1950–1983 and 1984–2008. Restricting our initiation and cessation samples to people 9–26 in 1950 or later and smokers who had already started in 1950 or later, we add an interaction between a dummy variable that equals 1 after 1983 and the information flow variable and all information interaction
terms. None of the coefficients on the interaction terms dif-fer from zero at the conventional levels of statistical signifi-cance. These findings suggest that health risk information, not tobacco control policies, increased the probability that smokers quit in the second sub-period.
To check whether the results depend on the linear prob-ability estimation, we re-estimate all models using probit and logit methods. Results are similar. However, while, in the OLS estimations, the stock of information statistically predicts both initiation and cessation probabilities, in the non-linear models, it only predicts the initiation probability. The information flow statistically explains cessation prob-abilities. Furthermore, variation in the flow of information explains difference in the probability of cessation of different cohorts, education levels, or rural/urban locations. The flow of information is not statistically associated with the initia-tion probability of different cohorts.
In recent years, the Turkish government has devoted sig-nificant resources to tobacco control with informational cam-paigns that sought to reduce the smoking prevalence rate. Some of the increase in the number of articles about adverse effects of smoking from 2005 to 2008 may have its origins in the activities of the Ministry of Health.2 As a robustness check, we estimate the models by restricting the sample before 2005 and eliminate the later period. Results indicate that the stock of information still affects the initiation decision of females in some models, but the coefficient on the information stock vari-able is no longer statistically significant. This finding suggests
that the increase in information in the later period contributes to smoking cessation. We find similarly consistent results on the information flow variable. The flow of information nega-tively affects the probability women start smoking but does not affect whether or not men start. Interestingly, when we exclude the later years, results indicate that youth (cohort aged 10–19) are more likely to start smoking when they are exposed to more information. Results for cessation probabilities of males and females in different cohorts, education levels, and rural/urban locations remain largely unchanged.
Conclusion
It is natural to ask—“Does information provided through pub-lic health campaigns reduce smoking?” Our evidence suggests that it might. However, narrowly interpreted, we cannot infer whether or not people will react to public health information campaigns, because our estimates are based on information that private newspapers provide. In our finer-grained insight into the smoking-information relationship, we separately analyze how information affects initiation and cessation decisions. Our results show when people get more information about health risks of smoking, women will be less likely to start smoking, and both male and female smokers will be more likely to quit.
Our findings should be interpreted cautiously. Most obvi-ously, our information flow variable tracks articles published in only one of Turkey’s newspapers, albeit the most widely distributed. Furthermore, fewer people read newspapers today than in past years. That may mean that our results understate the true effect of information, because we do not
Table 7 Selected results: model of smoking cessation
All models control for variables listed in the note to Table 5 plus the age of initiation, the interaction
between price and the heaping indicators. Standard errors are in parentheses ***, ** and * denote coefficients with p values ≤ 0.01, 0.05, and 0.10 respectively
Variables OLS IV-1 IV-2 IV-3 IV-4 IV-5
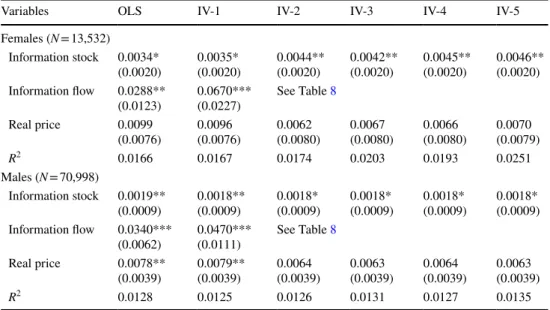
Females (N = 13,532) Information stock 0.0034* (0.0020) 0.0035*(0.0020) 0.0044**(0.0020) 0.0042**(0.0020) 0.0045**(0.0020) 0.0046**(0.0020) Information flow 0.0288** (0.0123) 0.0670***(0.0227) See Table 8 Real price 0.0099 (0.0076) 0.0096(0.0076) 0.0062(0.0080) 0.0067(0.0080) 0.0066(0.0080) 0.0070(0.0079) R2 0.0166 0.0167 0.0174 0.0203 0.0193 0.0251 Males (N = 70,998) Information stock 0.0019** (0.0009) 0.0018**(0.0009) 0.0018*(0.0009) 0.0018*(0.0009) 0.0018*(0.0009) 0.0018*(0.0009) Information flow 0.0340*** (0.0062) 0.0470***(0.0111) See Table 8 Real price 0.0078** (0.0039) 0.0079**(0.0039) 0.0064(0.0039) 0.0063(0.0039) 0.0064(0.0039) 0.0063(0.0039) R2 0.0128 0.0125 0.0126 0.0131 0.0127 0.0135
2 We would like to thank the referee for bringing this issue to our
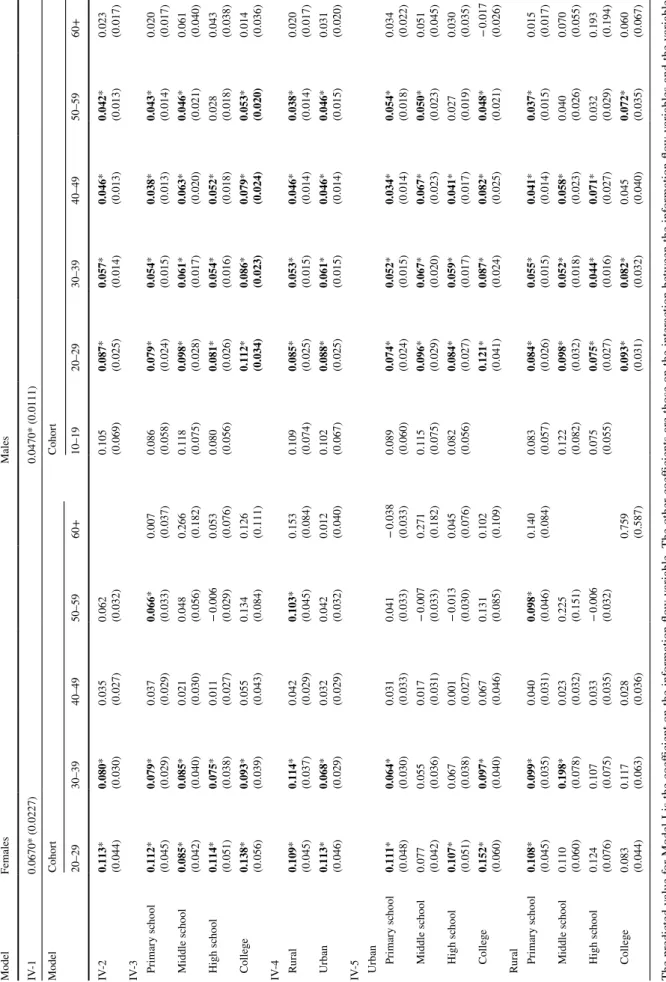
Table 8 Pr edicted c hang e in cessation pr obability giv en incr ease of 100 anti-smoking ar ticles, b y ag e, education, bir th cohor t, and r esidence The pr edicted v alue f or Model I is t he coefficient on t he inf or mation flo w v ar iable. The o ther coefficients ar e t hose on t he inter action be tw een t he inf or mation flo w v ar iables and t he v ar iables lis ted in t he no te t o T able 5 St andar d er rors in par ent heses * and boldf ace te xt deno tes coefficients t hat s tatis ticall y differ fr om zer o wit h p v alues ≤ 0.05 Model Females Males IV -1 0.0670* (0.0227) 0.0470* (0.0111) Model Cohor t Cohor t 20–29 30–39 40–49 50–59 60+ 10–19 20–29 30–39 40–49 50–59 60+ IV -2 0.113 * (0.044) 0.080 * (0.030) 0.035 (0.027) 0.062 (0.032) 0.105 (0.069) 0.087 * (0.025) 0.057 * (0.014) 0.046 * (0.013) 0.042 * (0.013) 0.023 (0.017) IV -3 Primar y sc hool 0.112 * (0.045) 0.079 * (0.029) 0.037 (0.029) 0.066 * (0.033) 0.007 (0.037) 0.086 (0.058) 0.079 * (0.024) 0.054 * (0.015) 0.038 * (0.013) 0.043 * (0.014) 0.020 (0.017) Middle sc hool 0.085 * (0.042) 0.085 * (0.040) 0.021 (0.030) 0.048 (0.056) 0.266 (0.182) 0.118 (0.075) 0.098 * (0.028) 0.061 * (0.017) 0.063 * (0.020) 0.046 * (0.021) 0.061 (0.040) High sc hool 0.114 * (0.051) 0.075 * (0.038) 0.011 (0.027) − 0.006 (0.029) 0.053 (0.076) 0.080 (0.056) 0.081 * (0.026) 0.054 * (0.016) 0.052 * (0.018) 0.028 (0.018) 0.043 (0.038) Colleg e 0.138 * (0.056) 0.093 * (0.039) 0.055 (0.043) 0.134 (0.084) 0.126 (0.111) 0.112 * (0.034) 0.086 * (0.023) 0.079 * (0.024) 0.053 * (0.020) 0.014 (0.036) IV -4 Rural 0.109 * (0.045) 0.114 * (0.037) 0.042 (0.029) 0.103 * (0.045) 0.153 (0.084) 0.109 (0.074) 0.085 * (0.025) 0.053 * (0.015) 0.046 * (0.014) 0.038 * (0.014) 0.020 (0.017) U rban 0.113 * (0.046) 0.068 * (0.029) 0.032 (0.029) 0.042 (0.032) 0.012 (0.040) 0.102 (0.067) 0.088 * (0.025) 0.061 * (0.015) 0.046 * (0.014) 0.046 * (0.015) 0.031 (0.020) IV
-5 Urban Primar
y sc hool 0.111 * (0.048) 0.064 * (0.030) 0.031 (0.033) 0.041 (0.033) − 0.038 (0.033) 0.089 (0.060) 0.074 * (0.024) 0.052 * (0.015) 0.034 * (0.014) 0.054 * (0.018) 0.034 (0.022) Middle sc hool 0.077 (0.042) 0.055 (0.036) 0.017 (0.031) − 0.007 (0.033) 0.271 (0.182) 0.115 (0.075) 0.096 * (0.029) 0.067 * (0.020) 0.067 * (0.023) 0.050 * (0.023) 0.051 (0.045) High sc hool 0.107 * (0.051) 0.067 (0.038) 0.001 (0.027) − 0.013 (0.030) 0.045 (0.076) 0.082 (0.056) 0.084 * (0.027) 0.059 * (0.017) 0.041 * (0.017) 0.027 (0.019) 0.030 (0.035) Colleg e 0.152 * (0.060) 0.097 * (0.040) 0.067 (0.046) 0.131 (0.085) 0.102 (0.109) 0.121 * (0.041) 0.087 * (0.024) 0.082 * (0.025) 0.048 * (0.021) − 0.017 (0.026) R ur al Pr imar y sc hool 0.108 * (0.045) 0.099 * (0.035) 0.040 (0.031) 0.098 * (0.046) 0.140 (0.084) 0.083 (0.057) 0.084 * (0.026) 0.055 * (0.015) 0.041 * (0.014) 0.037 * (0.015) 0.015 (0.017) Middle sc hool 0.110 (0.060) 0.198 * (0.078) 0.023 (0.032) 0.225 (0.151) 0.122 (0.082) 0.098 * (0.032) 0.052 * (0.018) 0.058 * (0.023) 0.040 (0.026) 0.070 (0.055) High sc hool 0.124 (0.076) 0.107 (0.075) 0.033 (0.035) − 0.006 (0.032) 0.075 (0.055) 0.075 * (0.027) 0.044 * (0.016) 0.071 * (0.027) 0.032 (0.029) 0.193 (0.194) Colleg e 0.083 (0.044) 0.117 (0.063) 0.028 (0.036) 0.759 (0.587) 0.093 * (0.031) 0.082 * (0.032) 0.045 (0.040) 0.072 * (0.035) 0.060 (0.067)
fully measure whether and how much information people get from all of the growing number of sources available to them.
Our study can be improved. In principle, it is possible to account for more of the heterogeneity in information expo-sure with more detailed data on sales to particular demo-graphic groups or geodemo-graphic locations. Future research can also refine our information variable by adding counts of arti-cles in other newspapers or consumer magazines, and stories on television or by measuring and controlling for the content of those articles and stories. Overall, this study suggests that such efforts are likely to be fruitful.
References
1. Avery, R., Kenkel, D., Lillard, D., Mathios, A.: Private profits and public health: does DTC advertising of smoking cessation prod-ucts encourage smokers to quit? J Political Econ. 115(3), 447–481 (2007)
2. Bar, H., Lillard, D.: Accounting for heaping in retrospectively reported event data—a mixture-model approach. Stat. Med.
31(27), 3347–3365 (2012)
3. Cheng, H.G., McBride, O., Phillips, M.R.: Relationship between knowledge about the harms of smoking and smoking status in the 2010 Global Adult Tobacco China Survey. Tob. Control. 24, 54–61 (2015)
4. Christopoulou, R., Han, J., Jaber, A., Lillard, D.R.: Dying for a smoke: how much does differential mortality rates of smokers affect estimated life-course smoking prevalence rates in retrospec-tively reported data? Prev Med. 52, 66–70 (2011)
5. Christopoulou, R., Lillard, D.R.: A novel indicator of life-course smoking prevalence in the united states combining popularity, duration, quantity, and quality of smoking. Am. J. Public Health
106(6) (2016). http://ajph.aphap ublic ation s.org/doi/abs/10.2105/ AJPH.2016.30313 0?af=R
6. Dagtas, B.: Americanization of the Popular Culture in the 1950’s Turkish Magazine: Hayat” Rhetoric and Communications
E-jour-nal, Issue 14, October 2012, rhetoric.bg/. ISSN 1314-4464 (2012). http://rheto ric.bg/wp-conte nt/uploa ds/2014/11/Dagta sh-B-ameri caniz ation -Turki sh-14-issue -octob er-2014-last.pdf
7. Dalbudak, S.: Turkiye’de Basin Isletmeciliginin Dogusu ve Geli-simi. Marmara University, Faculty of Communication, Master Thesis (1996)
8. Demez, G. “Medyada yeni saglik anlayislari ve kadin bedeninin temsili” (A new understanding of health and representation of the female body in the media). Uluslararasi Insan Bilimleri, Dergisi Vol 9(1):512–532 (2012)
9. Global Adult Tobacco Survey—Turkey (GATS).: Copenhagen:
World Health Organization (2008). http://www.who.int/tobac co/
surve illan ce/en_tfi_gats_turke y_facts heet_2009.pdf
10. Hsieh, C., Lin, S.: Health information and the demand for pre-ventive care among the elderly in Taiwan. J Hum Resour 322, 308–333 (1997)
11. Hsieh, C., Yen, L., Liu, J., Lin, C.J.: Smoking, health knowledge, and anti-smoking campaigns: An empirical study in Taiwan. J Health Econ 15, 87–104 (1996)
12. Ilter, M.: Tutun and Tutun Mamullerinde Devlet Tekelince Yapilmis Olan Satis Fiat Ayarlamalari. Sale Price Adjustments on Tobacco and Tobacco Products Made by Government Monopoly (1989) (unpublished manuscript)
13. Ippolito, P.M., Mathios, A.D.: Information, advertising, and health choices: a study of the cereal market. Rand J. Econ. 213, 459–480 (1990)
14. Jones, A.M., Kirigia, J.M.: Health knowledge and smoking among South African women. Health Econ. 8, 165–169 (1999) 15. Kenkel, D.: Consumer health information and the demand for
medical care. Rev. Econ. Stat. 724, 587–595 (1990)
16. Kenkel, D.: Health behavior, health knowledge, and schooling. J. Political Econ. 99, 287–305 (1991)
17. Kenkel, D.L., Chen: Consumer Information and Tobacco Use. In: Jha, P., Chaloupka, F. (eds.) Tobacco Contro lin Developing Countries. Oxford University Press, New York (2000)
18. Kenkel, D., Lillard, D.R., Mathios, A.: Smoke or fire? Are retro-spective smoking data valid? Addiction 989, 1307–1313 (2003) 19. Lillard, D.R.: Health information and smoking: New improved
estimates of how information affects behavior. Working paper, Department of Human Sciences, Ohio State University (2014) 20. Lillard, D.R.: Smoking the United States. In: Lillard, D.R.,
Chris-topoulou, R. (eds.) Life-course smoking behavior: patterns and national context in ten countries. Oxford University Press, New York (2015)
21. Lillard, D.R.: Educational Heterogeneity in the Association between Smoking Cessation and Health Information. In: Bolin, K., Lindgren, B., Grossman, M., Gyrd-Hansen, D., Iversen, T., Kaestner, R., Sindelar, J.L. (eds.) Human Capital and Health Behavior. Advances in Health Economics and Health Services Research, vol. 25. Emerald Publishing Limited, pp. 183–206 (2017)
22. Önder, Z.: Smoking in Turkey. In: Lillard, D.R., Christopoulou, R. (eds.) Life-Course Smoking Behavior: Patterns and National Context in Ten Countries, pp. 141–153. Oxford University Press, New York (2015)
23. Önder, Z., Yürekli, A.A.: Who pays the most cigarette tax in Tur-key. Tob. Control 25, 39–45 (2016)
24. Pauly, M.V., Satterthwaite, M.A.: The pricing of primary care physicians’ services: a test of the role of consumer information. Bell J. Econ. 122, 488–506 (1981)
25. Pratt, C.A., Pratt, C.B.: Comparative content analysis of food and nutrition advertisements in Ebony, Essence, and Ladies’ Home Journal. J. Nutr. Educ. 271, 11–17 (1995)
26. Senyapili, O.: 1970′lerin basinda sayilarla Turk Basini. Amme Idaresi Dergisi 4(4), 67–115 (1971)
27. Yürekli, A., Önder, Z., Elibol, M., Erk, N., Cabuk, A., Fisunoglu, M., Erk, S.F., Chaloupka, F.J.: The Economics of Tobacco and Tobacco Taxation in Turkey. International Union Against Tuber-culosis and Lung Disease, Paris (2010)
![Table 2 Smoking prevalence rate (%) by gender and place of resi- resi-dence. Source: GATS [9]](https://thumb-eu.123doks.com/thumbv2/9libnet/5775380.117172/4.892.75.436.730.932/table-smoking-prevalence-gender-place-dence-source-gats.webp)