THE RELATIONSHIP BETWEEN HIGH SCHOOL STUDENTS’ COGNITIVE STYLE AND SPATIAL ABILITY IN ANKARA
CANKAYA
A MASTER’S THESIS
BY
MERVE AKKAYA
THE PROGRAM OF CURRICULUM AND INSTRUCTION İHSAN DOĞRAMACI BILKENT UNIVERSITY
ANKARA JANUARY 2021 M E RV E AKKAYA 2021
The Relationship Between High School Students’ Cognitive Style and Spatial Ability in Ankara Cankaya
The Graduate School of Education of
İhsan Doğramacı Bilkent University
by
Merve Akkaya
In Partial Fulfilment of the Requirements for the Degree of Master of Arts
in
Curriculum and Instruction Ankara
İHSAN DOĞRAMACI BILKENT UNIVERSITY GRADUATE SCHOOL OF EDUCATION
The Relationship Between High School Students’ Cognitive Style and Spatial Ability in Ankara Cankaya
Merve Akkaya Dec 2020
I certify that I have read this thesis and have found that it is fully adequate, in scope and in quality, as a thesis for the degree of Master of Arts in Curriculum and
Instruction.
---
Assoc. Prof. Dr. Erdat Çataloğlu (Supervisor)
I certify that I have read this thesis and have found that it is fully adequate, in scope and in quality, as a thesis for the degree of Master of Arts in Curriculum and
Instruction.
---
Asst. Prof. Dr. Armağan Ateşkan (Examining Committee Member)
I certify that I have read this thesis and have found that it is fully adequate, in scope and in quality, as a thesis for the degree of Master of Arts in Curriculum and
Instruction.
---
Prof. Dr. Salih Ateş, Gazi University (Examining Committee Member)
Approval of the Graduate School of Education
---
iii
ABSTRACT
The Relationship Between High School Students’ Cognitive Style and Spatial Ability in Ankara Cankaya
Merve Akkaya
M.A. in Curriculum and Instruction Supervisor: Assoc. Prof. Dr. Erdat Çataloğlu
January 2021
In this study the relation between students’ cognitive style and spatial visualization ability was investigated in Ankara, Çankaya. Gender, schools and grade level/age were independent variables of descriptive study. Sample of this research were 393 anatolian high school students from four different schools. Group Embedded Figures Test (Witkin et al., 1971) and Turkish version of Purdue Spatial Visualization Test (Guay, 1976) were used to assess students’ cognitive style and spatial ability. Sevimli (2009) adapted Purdue Spatial Visualization Test into Turkish. Group Embedded Figures Test’ second and third part included in scoring and each part contains nine questions. Five minutes were given for students to answer questions in each part. Purdue Spatial Visualization Test contained three parts. Each parts contain 12 questions. Time were given for the whole test. Descriptive statistical analysis were conducted to investigate the students’ cognitive style and spatial visualization ability with respect to independent variables. Independent samples t-test was
conducted whether gender difference had statistically significant effect on cognitive style and spatial ability. One-way ANOVA test was used to determine whether the mean difference in school and grade level were statistically significant or not. Correlation coefficient between students’ cognitive style and spatial ability was computed. According to results, students’ cognitive style and spatial visualization ability were independent from students’ gender. There were statistically significant difference in students’ cognitive style and spatial visualization ability with respect to students’ schools and grade level/age. There was a statistically significant and positive correlation between students’ cognitive style and spatial visualization ability.
iv
ÖZET
Ankara’nın Çankaya İlçesindeki Lise Öğrencilerinin Bilişsel Stilleri ve Uzamsal Görselleme Becerileri Arasındaki İlişki
Merve Akkaya
Yüksek Lisans, Eğitim Programları ve Öğretim Tez Yöneticisi: Doç. Dr. Erdat Çataloğlu
Ocak 2021
Çalışmanın amacı Ankara Çankaya bölgesinde bulunan lise öğrencilerinin bilişsel stilleri ve uzamsal görselleştirme becerileri arasındaki ilişkiyi araştırmaktır. Cinsiyet, okullar ve yaş/sınıf çalışmadaki değişkenlerdir. Betimleyici araştırma yönteminin kullanıldığı bu çalışmada, dört farklı Anadolu lisesi ve 393 lise öğrencisi örneklem olarak seçilmiştir. Öğrencilerin bilişsel stillerini saptamak amacı ile ‘‘Group Embedded Figures Test’’ ve öğrencilerin uzamsal görselleştirme becerilerini
saptamak amacı ile ‘Purdue Spatial Visualization Test’’ in Sevimli (2009) tarafından uyarlanan Türkçe versiyonu kullanılmıştır. Gömülü figür testi üç kısımdan
oluşmaktadır. İkinci ve üçüncü kısım puanlamaya dahil olan dokuzar sorudan oluşur. Her iki bölüm için de süre beşer dakikadır. Uzamsal görsellem testi üç ayrı bölümden oluşur ve her bölüm için ayrı süre verilmez. Her bölümde 12 soru bulunmaktadır ve toplamda 36 soru vardır. Tek doğru cevaba sahip olan bu test çoktan seçmelidir. Öğrencilerin cinsiyet, yaş ve okul değişkenlerine göre bilişsel stilleri ve uzamsal görselleştirme becerisini belirlemek için betimleyici istatiksel analiz yöntemi
kullanılmıştır. Bu çalışmada cinsiyetin istatiksel olarak anlamlı bir farklılık oluşturup oluşturmadığını analiz etmek için bağımsız örneklem t-testi kullanılmıştır.
Öğrencilerin bulunduğu okulun ve sınıf seviyelerinin istatiksel olarak anlamlı bir farklılık oluşturup oluşturmadığını analiz etmek için tek yönlü varyans analizi kullanılmıştır. Son olarak öğrencilerin bilişsel stilleri ve uzamsal görselleştirme becerileri arasındaki ilişkiyi analiz etmek için korelasyon katsayısı hesaplanmıştır. Analizlerin sonucunda cinsiyet, öğrencilerin bilişsel stilleri ve uzamsal
görselleştirme becerileri üzerinde istatiksel olarak anlamlı bir farklılık
oluşturmamaktadır. Öğrencilerin bilişsel stilleri ve uzamsal görselleştirme becerileri okul ve sınıf düzeyi/yaş değişkenine bağlıdır. Öğrencilerin bilişsel stilleri ve uzamsal görselleştirme becerileri arasında anlamlı ve pozitif bir korelasyon bulunmuştur. Anahtar Kelimeler: Uzamsal beceri, uzamsal görselleştirme becerisi, bilişsel beceri
v
ACKNOWLEDGEMENTS
First and foremost I would like to thank my supervisor Assoc. Prof. Erdat Çataloğlu for his support, knowledge and guidance during my study. His guidance helped me to complete this study without losing my enthusiasm.
I wish to thank all members of Bilkent University Graduate School of Education CITE program for their contributions to this study. I owe my hearty thanks to Ece Güneysu, Ecem Doğdu, Özlem Keser, Ecem Yalım and Hatice Gönül for helping me all the possible ways and for being amazing friends. I am indebted to my colleague Fatma Çiçek for her support during the process of saving my hard disk. She was worried with me like it was her study.
I also thank to committee members of my thesis defense for their valuable feedback and suggestions.
My deepest thanks goes to my family for their unconditional support, endless love and care at each stage of my life. They were my constant source of inspiration.
Lastly and mostly, I would like to thank Emre Demir who holds a special place in my heart. He always support me even if I lose my motivation. His love and support were very special for me to achieve goals in my life.
vi TABLE OF CONTENTS ABSTRACT………iii ÖZET……….. iv ACKNOWLEDGEMENT………v TABLE OF CONTENT………...vi LIST OF TABLES………...………ix LIST OF FIGURES……….xi CHAPTER 1: INTRODUCTION...1 Introduction...1 Background...1 Problem...6 Purpose...8 Research question...8 Significance...9 Limitations...9
Definitions of key terms...10
Field dependent...10
Field independent...10
Spatial visualization ability...10
Ethical considerations...10
CHAPTER 2: REVIEW OF RELATED LITERATURE...11
Introduction...11
The studies conducted with GEFT...11
The studies conducted with PSVT...14
vii
The studies about gender difference in spatial ability...17
The studies in favor of male participants...19
The studies with no gender difference...20
The studies about grade level/age difference in cognitive style...21
The studies about grade level/gender difference in spatial ability...23
Relationship between cognitive style and spatial ability...24 CHAPTER 3: METHOD...27 Introduction...27 Research design...27 Research method...28 Context...30 Participants...31 Instrumentation...32
Method of data collection...38
Method of data analysis...39
CHAPTER 4: RESULTS...40
Introduction...40
Descriptive results of students’ score on GEFT and PSVT...41
By Gender...43
By School...46
By Grade...50
Item analysis...52
viii
CHAPTER 5: DISCUSSION...65
Introduction...65
Overview of the study...65
Major findings...66
Discussion of descriptive data results...66
Discussion about results of gender differences...68
Discussion about results of different schools...70
Discussion about results of grade level...71
Discussion about item analysis...73
Discussion about correlation results...74
General results...75
Implications for practice...77
Recommendation of further research...78
Limitations...79
REFERENCES...80
APPENDICES...89
Appendix A: A Turkish version of Group Embedded Figures Test... ...89
Appendix B: A Turkish version of Purdue Spatial Visualization Test...107
Appendix C: Permission for GEFT...128
ix
LIST OF TABLES
Table Page 1 School names and the number of participants...31 2 Number of participants from different grades...32 3 Descriptive statistical methods for students’ scores in GEFT and
PSVT...41 4 Descriptive statistical methods for students’ scores in GEFT according to
gender...44 5 Descriptive statistical methods for students’ scores in PSVT according to
gender...44 6 Descriptive statistical results of students’ total scores according to different
schools for GEFT and PSVT...50 7 Descriptive statistical results of students’ scores on two different tests according
to students’ grade level...52 8 Descriptive statistical results for most correctly answered questions from
GEFT...57 9 Descriptive statistical results for most incorrectly answered questions from
GEFT...57 10 Descriptive statistical results for most correctly answered questions from
PSVT...58 11 Descriptive statistical results for most incorrectly answered questions from
PSVT...59 12 Independent sample t-test result of total score on GEFT with respect to
x
13 Independent sample t-test result of total score on PSVT with respect to
gender...60
14 Test of homogeneity of variances...61
15 One-way ANOVA results for compare means of different schools...61
16 The mean difference result for GEFT by using Bonferroni post-hoc...62
17 The mean difference result for PSVT by using Bonferroni post-hoc...62
18 Test of homogeneity of variances for grade levels...63
19 One-way ANOVA results for compare means of grade levels...63
20 The mean difference results for GEFT by using Tukey post-hoc...64
21 The mean difference result for PSVT by using Tukey post-hoc...64
xi
LIST OF FIGURES
Figure Page
1 Rod alignment of field dependent and independent individuals...4
2 The percentage of female and male students...31
3 Percentage of students from different grades...32
4 Simple form of X...33
5 Complex figure from GEFT...34
6 Simple form traced over the lines of the complex figure...34
7 Open form of the 3D shapes...35
8 Multiple choice to determine 3D shape of Figure 7...36
9 Rotation of object...36
10 Example 3D shape...36
11 Choices to find the correct result after rotation...37
12 3D shape on 3D box with black dot...37
13 Multiple choices of the perspective question...37
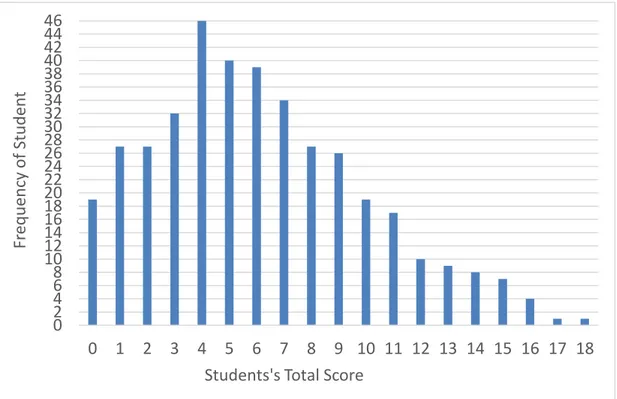
14 GEFT total score frequency distribution...42
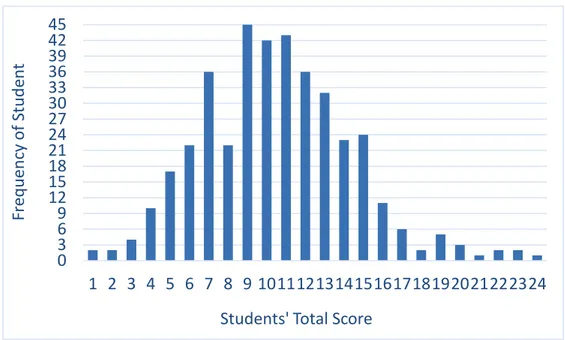
15 PSVT total score frequency distribution...43
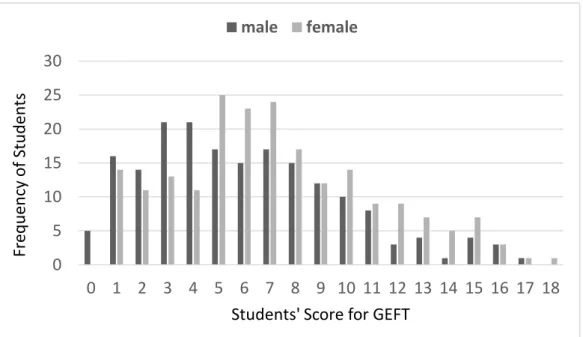
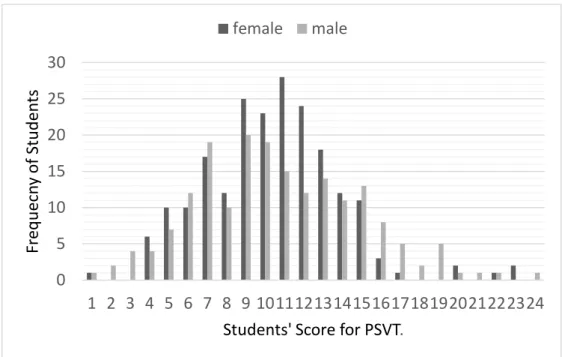
16 GEFT total score frequency distribution according to gender...45
17 PSVT frequency distribution according to gender...46
18 GEFT frequency distribution according to different schools...48
19 PSVT frequency distribution according to different schools...49
20 Distribution of students’ total score according to grade level for GEFT...51
21 Distribution of students’ total score according to grade level for PSVT...52
22 The count of unanswered items in GEFT...53
xii
24 Item difficulty values for each items in GEFT...54
25 Item difficulty values for each items in PSVT...55
26 Item discrimination for each item in GEFT...56
1
CHAPTER 1: INTRODUCTION Introduction
In this research, the relationship between two mental constructs, that is students’ cognitive style and their spatial ability was investigated on Turkish high school physics students. Students - or people in general - have different cognitive styles. The majority of people fall into two distinct categories of cognitive styles namely, field dependent and field independent. When students are required to solve problems while learning a new subject, these two leaning styles become an important part during this process. The spatial ability construct is another important cognitive process utilized during learning, especially in tasks where spatial information such as location, scale, space, shapes and so on is needed to be used. Both of these constructs are related to the successful teaching and learning of abstract concepts required in school subject fields such as physics.
In the light of this very brief information, then, by gaining an understanding through the investigation of a possible relation between students’ cognitive style and spatial ability it might be possible for teachers, science educators and researchers alike, to further understand the complexity of the underlying factors that prevent or enhance the teaching and learning of successful physics.
Background
Individual differences play an important role in the way of living a life. Some of the differences between individuals determines their reactions in different situations. For
2
example, if a car accident happened in front of group of people, some of them just start crying while some others might try to help the accident victims. In the above scenario, the situation was the same for the group of people. However, their behaviors and reactions were different. The reason being is that individuals have different personality, characteristic, intelligence, motivation, and attribution. Obviously, these different characteristics distinguish individuals from one another. Therefore, it comes to no surprise that research has been conducted on the various reasons for different characteristics of individuals. Chen and Miller (2007) tried to unveil this phenomenon and they came to a conclusion that there were factors actually that shape and can explain to an extend individual differences. According to them, the social context as a complex factor was very important one to shape and explain these differences. Social context was defined as the environment constituting the neighborhood, family and its effects, and the social community the individuals were surrounded with.
Individuals most likely think differently and might have their own methods in solving problems during daily live activities. Why should not this approach be true for school life as well. Students deal with different problems in their school life. When students face problems, they most likely think about or approach the problems in different ways, and they try to find solutions by using or utilizing different
problem solving techniques. Sullivan (2009) emphasized this fact by explaining that when individuals start to learn, not only their motivation, personality, attributions for their success and failures played an important role to learn but also their cognitive abilities.
3
These commonsensical approach on individual differences has manifested itself in academic research. Nowadays diversity and inclusion play a key role in education. Terms such as, individual difference, self-paced learning, multiple intelligence, expert vs novice, cognitive styles and so on are all areas of research interest. The relationship between individual differences and cognitive style are very important to achieve the goal of learning effectively. According to Williamson (2018), learners can have different cognitive styles and this result with individual differences among learners. In addition, it was verified that when engineers and scientist were compared to individual from different professions, scientists and engineers had different
cognitive style profiles and personality traits.
On his worked on individual’s cognitive style differences, Sternberg (1997) showed that some students use an analytic and systematic approaches to learning, while others have a more intuitive and global approach. Witkin, a pioneer in this research field, refers to this phenomenon as field dependent and field independent cognitive style (Witkin, 1974; Witkin & Goodenough, 1981).
Witkin’s outcomes on his seminal research (Witkin, 1974; Witkin & Goodenough, 1981) showed that there were two type of individuals, the first group of individuals are classified as those to accept externally provided structure. This group of
individuals are those that are individuals that accept externally provided structure and stay connected to them.
Individuals who are responsive to external reinforcement think and solve problems within these frameworks. These types of individuals are called field dependent. On
4
the other hand, field independent individuals restructure perceived information into a different structure. External structures are not important for field independent
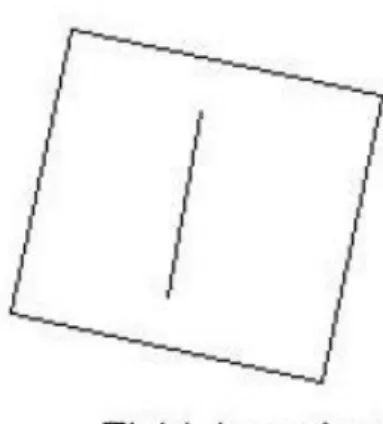
individuals to process their experiences. This type of individuals construct their own framework and they develop their own methodology to solve problems. In order to explain it clearly, Witkin and Goodenough’s (1981) Rod and Frame Test (RFT) can be given as an example. RFT was applied to the participants to explore
characteristics of field dependent (FD) and field independent (FI) individuals. In this test, there were luminous square frame and luminous rod in a dark room. The frame could rotate clockwise (CW) and anticlockwise (ACW) and the rod too, which was placed in the center of the frame could rotate independently from the frame CW and ACW independently from frame. For both, the pivot was the same center. While the frame around the rod remains in its initial position of tilt, participants’ tasks were adjusting the rod to a vertical position with respect to ground. According to result of RFT, although field independent individuals ignore the position of frame and align the rod in vertical position, field dependent individuals were affected by the position of the frame and they failed to align the rod vertically by as much as 30 degrees. It can be seen from below Figure 1.
5
As mentioned above, the characteristics of field dependent and field independent individuals were explained by Witkin. According to him, FD learners have more intuitive and global approaches. Therefore, they tend to think in more broad and passive ways. However, FI learners have analytic and systematic ways of thinking. They perceive and process information methodically. Subsequently, FD and FI learners show different characteristics when they solve problems.
Although individual differences can be affected by the two distinct cognitive styles pointed out above, other cognitive factors such as spatial ability could play an important role in teaching and learning physics. As it is for cognitive styles students show different spatial abilities and this in turn can affect their understanding in their physics lessons (courses). Therefore, both students’ cognitive style and their spatial ability are important for achieving goals in their lessons.
Anastasi (1976) defined spatial ability as a skill which is used to perceive fixed geometric relations and it is also used to apply mental transformations such as rotation and reconfiguration to existing geometric objects and their proximal relations.
These characteristics of learning will affect students understanding in different lessons especially in physics. In physics education, it is important for teachers to explore students’ approaches of learning to provide them with effective lessons. Moreover, the spatial abilities of students are very important for physics lesson. For example, when dealing with vectors, students have to know dimensions and
6
According to research, Einstein’s theory of relativity, Faraday’s electromagnetic field theory, Newton’s law of motion and Maxwell’s laws comprised spatial reasoning (Miller, 1986; Nersessian, 1995; Shepard, 1996). There was a list from United States Employment Service about the occupations which require a high level of spatial ability and physics was also added in this list (Dictionary of Occupational Titles, 1991). It also showed that spatial ability had significant effect on learning and teaching of physics.
Mayer and Sims (1994) investigated that students with high spatial ability do not have difficulty in understanding diagrams and they can easily construct an imagery object in working memory. However, students with low spatial ability have difficulty to understand diagrams. Therefore, teachers need to consider students’ spatial
abilities when they prepare their lessons with graphical representations or diagrams.
The following sections explains the context and need for exploring further the relationship between student’s cognitive styles and their spatial abilities as it relates to physics education.
Therefore, it is important to know if there is a relation between students’ spatial ability and field dependence/independence to prepare effective and meaningful lesson for students
Problem
Physics is an area that relays heavily on problem solving skills. Most of the physics teachers spend a considerable amount of time for solving problems in a typical
7
physics lecture. A high achieving student is usually the one that shows advanced skills in solving problems. Different studies were conducted about the relationship between cognitive style and students’ achievement in physics lessons (Ziane, 1996). According to Ziane’s research FD physics students obtained lower scores in solving physics problems than the students who had FI cognitive style.
Kinematic problems in physics lesson was another area that students had difficulty in solving problems. Kozhevnikov, Motes and Hegarty (2006) investigated the
relationship between spatial ability and problem-solving skills in kinematic problems which include prediction of the motion of two-dimensional object, translating from one reference frame to another. According to result of the study, students who had high spatial visualization ability can integrate several motion parameters and they had the ability of reorganization of the spatial problem into another coordinated. However, the low spatial ability student group could only consider a single motion parameter at a time. Moreover, their interpretation of kinematics related graphs were picture like representation. This research showed that cognitive style and spatial ability had a significant effect on problem solving in physics.
It is important for physics teacher to understand if their students’ ways of thinking are field dependent or independent. In addition, the level of students’ spatial ability was significant for them when solving problems. The literature lacks information about how to help teachers assess and address these differences. Teachers have difficulty to explain topics and they use insufficient materials in their lessons with respect to students’ cognitive styles and their spatial ability. Moreover, especially in physics education, students need to think in three dimensions. However, generally
8
teaching methods and materials are not suitable for students’ abilities and styles. The current study investigated whether students’ cognitive style affects their spatial visualization ability. It has significant effect to know students cognitive style and their spatial visualization ability to improve teaching methods for students. Therefore, it is important to find out the relationship between students’ cognitive style and their spatial visualization ability.
Purpose
The purpose of this study was to explore the relationship between students’ cognitive style and their spatial visualization ability. The Group Embedded Figure Test
(GEFT) was used to measure students’ cognitive style and the Purdue Spatial Visualization Test (PSVT) was used to measure students’ spatial ability.
Research questions This study addresses the following research questions:
1. Is there a statistically significant relationship between students’ cognitive style and their spatial visualization ability in some selected high schools in Ankara?
2. Are there any statistically significant difference between students’ cognitive style by gender?
3. Are there any statistically significant difference between students’ spatial visualization ability by gender?
4. Are there any statistically significant difference between students’ cognitive style by schools?
9
5. Are there any statistically significant difference between students’ spatial visualization ability by schools?
6. Are there any statistically significant difference between students’ cognitive style by grade?
7. Are there any statistically significant difference between students’ spatial visualization ability by grade?
Significance
This study has three significant contributions. First result of this study showed how students’ cognitive style and spatial abilities are related. This relation is important for teachers and also students. Teachers can change their teaching style by using this relationship. They can find different methods to explain topics or they can use different materials to increase students’ understanding. Secondly, students can choose different methods according to their cognitive style and spatial ability when they study individually. According to the results, teachers can use more spatial visuals depend on their students’ cognitive style. Finally, teachers can prepare activities and materials according to the relationship between students’ cognitive style and spatial ability to improve their understanding. This study may increase the effectiveness of lessons.
Limitations
In this research participants are some high school students in Ankara region.
Therefore, it will not be generalized to all high school students at different regions in Turkey.
10
Definition of key terms
Field dependent: acceptation of externally imposed frameworks and staying connected to these frameworks while dealing with problems, thinking or remembering (Witkin, 1974).
Field independent: reconstruction of information into a different framework by do not considering external structures (Witkin, 1974).
Spatial visualization ability: way of thinking in two or three dimensional (Linn & Petersen, 1985).
Ethical considerations
Permission from Ministry of National Education (MoNE) was be obtained for this study. In addition to the permission from MoNE, permissions for using GEFT and PSVT were obtained for this research. Also, utilization permission should be
required to apply tests in schools. Moreover, parent notification and permission letter were prepared for this study.
11
CHAPTER 2: REVIEW OF RELATED LITERATURE Introduction
In the first chapter, background of my research topic, problem and purpose were given. According to the information in the first chapter, the relationship between students’ cognitive style and spatial visualization ability was investigated. Also, difference between cognitive style and spatial ability by gender, schools and grade level analyzed.
This chapter is about the literature review to examine theoretical framework. This framework helped to answer research questions which was given in Chapter 1. The aim of this chapter to investigate main concepts of this research. These were:
Studies conducted with GEFT and PSVT. Cognitive style as it relates to gender Spatial ability as it relates to gender
Studies about the possible relations of cognitive style with grade level or age. Studies about the possible relations of spatial visualization ability with grade
level or age.
The studies conducted with GEFT
GEFT is widely applied and well-known test to measure field dependence/ independence of students. In this section, the studies which is conducted by using GEFT was investigated.
12
Miller (2007) explored the relationship between creativity and cognitive style. In the research cognitive style was measured by using GEFT. Participants of the research was 90 (60 female and 30 male) undergraduate students from Midwestern University and their age range is between 12-32 (M=19.74). In the research two tests were used. One of them was used to assess creative performance of the students. It was collage making test. Another one is GEFT to assess students’ cognitive style. Result of this study showed that, when the students score on creativity was high, students’ GEFT score also high. Therefore, if the students were more field independent, these students were more creative than field dependent students.
It has been debated whether field dependence- independence construct represents intellectual style construct or whether it represents variation in an individual’s spatial preference patterns. Zang (2004) explored the relationship between thinking style construct and field dependence/independence construct. There were 200 (154 female, 46 male) volunteer participants in the research. Participants were from Shangai and 97 of them majoring in Mathematics and 103 of them majoring in the Chinese Language. The range of the students’ age from 18 to 23. There were juniors (58), sophomores (67) freshman (75) students. In this research modified version of the GEFT was used, since the research was conducted on Chinese students. Modification of GEFT done in 3 steps. Then, they did a pilot research by using modified version of GEFT among Chinese university students. GEFT and Thinking Style Inventory (Sternberg & Wagner, 1992) were two inventories of the research. In addition to these, students’ academic achievement was investigated. Zhang examined students’ scores on field dependence-independence scale and their thinking style scales. Also, she compared students’ achievement scores in Mathematics and Chinese Language
13
to their scores on the field dependence-independence scales. As a result of this study, she found that field dependence and field independence construct are related to students’ spatial ability.
Cakan (2003) conducted a research on undergraduate Turkish students about the psychometric data on group embedded figures tests. She investigated the effects of socioeconomic status and sex on the students’ cognitive style performance. GEFT is used to assess field dependence/independence of students. According to Cakan, one of the advantages of GEFT was requirement of minimum language skills. Since, test was nonverbal test, it includes shapes mostly. Research conducted with 534
undergraduate students from two university in Turkey. Participants were from department of teacher education. Age of the participants were from 19 to 21. Students were in their second year of the education faculty when the research was conducted. Result of the study showed that 135 students were field-dependent, and 182 students were field independent. Also, scores of 217 students were in between the cut of values of upper 27% and lower 27%. According to the result of this research, GEFT is an adequate test instrument for Turkish adults. In addition, students had higher score in the second part of the GEFT than the third part. She compared the mean scores of American and Turkish undergraduates, mean scores of Turkish students were lower than American students. It was due to the relationship between culture and field dependence/independence. She concluded that according to research conducted by different researcher (Alvi et al., 1986; Kush, 1996; Nedd & Gruenfeld, 1976; Witkin & Berry, 1965), individuals from nonwestern cultures were found more field dependent than individuals from western culture. Her research in agreement with this argument.
14
Murphy (1997) conducted a research about the measurement characteristics of the GEFT and it provided contribution to normative and psychometric data. Test was administered to undergraduate students from Bachelor of Applied Arts in
Information Management. There were 63 participants in the research. Participants completed demographic survey and then GEFT was administered to students. There were 40 female participants and 23 male participants. Female participants’ ages were in between 18-48 and the male participants’ age range were from 19 to 43.
Participants were full time (83%) and part time (17%) undergraduates. As a result, difference between mean scores of students from information management students and original sample (Witkin et al., 1971) were nonsignificant. Therefore, it agreed with the Witkin et al. research.
The studies conducted with PSVT
PSVT is used to determine the spatial visualization skills of the participant in many studies. In this section, the studies which is conducted with PSVT was explored.
In the study conducted by Turgut, Yenilmez and Balbag (2017), spatial thinking ability of 431 prospective middle school science and mathematics teachers was explored. In this research the effect of department, gender and academic performance on the spatial ability also investigated. The range of participants’ age were 18-25. There were 206 (170 female and 36 male) prospective teachers from science department and 225 (170 female and 55 male) prospective teachers from
mathematics education department. PSVT was used as an instrument for the study. There were three sections in PSVT and the researcher count the number of correct answers in each section. Total scores for the spatial visualization ability included the
15
collection of development and the rotation constructs’ scores. For the measurement of spatial orientation level, scores from views construct included directly. Result of this research indicated that spatial thinking ability of prospective teachers were low. In addition, department and academic performance had an effect on spatial
visualization ability.
Baki, Kosa and Guven (2011) conducted a research about the effects of using dynamic geometry software and physical manipulatives on the spatial visualization skills. They used PSVT as an instrument to determine the spatial visualization skills of pre-service mathematics teachers for pre-test and post-test. There were 96
participants in the research. They divided participants as computer group (34), manipulative group (32) and traditional group (30). According to their research, they found that there was no statistically significant difference in the mean scores of the participants for experimental and control group before training. Before treatment total mean scores of the students for PSVT was found to be approximately 18 (SD =5.43). After the treatment, there were no statistically significant difference between pre-test and post-test results of the traditional group (M=19.37, SD=4.29). However, after the treatment, according to the result of the analysis they conducted, there were positive effect of treatment for computer group (M=23.06, SD=4.72) and
manipulative group (M=21.53, SD=5.66). Result of this study showed that although there was positive effect of manipulative based instruction on the students’ spatial visualization skill, traditional-based instruction did not have any effect on spatial visualization skill.
16
Güven and Kosa (2008) conducted a research about the effect of computer-based activities on the development of prospective mathematics teachers’ spatial abilities. The participants of the study were 40 (18 female and 22 male) prospective
mathematics teachers. Instrument of this study was PSVT and it was used as pre-test and post-test. Students had eight-week training about Cabri 3D software after pre-test. Descriptive analysis was done before and after intervention. Before the
intervention mean score of the participants was 15.7 and after the intervention mean score of the participants was 21.4. Result of this study showed that there was a significant difference on participants’ spatial abilities after the intervention. According to research, teachers can use different methods to increase students’ spatial visualization abilities.
The studies about gender differences in cognitive style There were different research about the effect of gender differences to the performance of students for GEFT. Most of the studies found that there were no effect of gender difference to the performance of students on GEFT.
Cakan (2003) conducted a research about psychometric data of the group embedded figures test for Turkish undergraduate students as explained in the studies about GEFT. In the research she also investigated effects of gender differences on GEFT. There were 354 female and 179 male participants in the research. Researcher used independent sample t-test to investigate the gender differences on GEFT. According to result of the study, there were no statistically significant difference between mean scores of female (M=8.4, SD=4.0) and male (M=9.1, SD=4.4) participants.
17
In Murphy et al. (1997) research, gender differences on GEFT were also
investigated. There were 89 participants fort his research. There were 60 female and 29 male students from accounting, marketing and management department of the university. According to result of the study mean scores of female and male participants was near to each other. While mean score of female participants were 12.0 (SD=4.32), male students’ mean score was 13.0 (SD=5.38). At the end of the research there were no statistically significant difference between mean scores of female and male participants.
There was another research about the differences in sex and curricula on learning the group embedded figures test and it was conducted by Lusk and Wright (1981). This research conducted for 409 participants. Tests were conducted at different classes by selecting courses offered from university. Chemistry, Physics 201, Mathematics 4, Educational Psychology, General Physics, Introduction to General Psychology were examples of this classes. According to result of the research differences in
enhancement within the curriculum groups are not related to gender. Also, there were no evidence of male participants were better than female participants in their
performance or improvement of their scores.
The studies about gender differences in spatial ability Gender differences in PSVT were examined and it was a major concern of the studies related to PSVT. There were studies about gender differences in the history. Some of these studies found no significant difference between female and male participants’ mean score of PSVT. However, some of them found significant effect of gender difference in PSVT.
18
Tzuriel and Egozi (2010) conducted a research with young children to explore the gender differences in spatial ability. There were 116 participants (58 female and 58 male). All the participants were first grade students. There were experimental and control groups for the study. Spatial Relation (Thurstone & Thurstone, 1965) subset and Windows Test were used in the research as an instrument. Windows test were based on mental rotation subset of Cognitive Modifiability Battery (CMB) (Tzuriel, 1995, 2000; Tzuriel & Egozi, 2006). For both tests, before the intervention, males had higher mean score than female participants However, it showed that after the intervention, gender differences between the mean scores of female and male participants can be cancelled out or moderated.
There were another research about the gender differences and the effect of digital pentominoes game on spatial ability. Yang and Chen (2010) conducted a research with fifth grade students. It was an empirical study and there were 34 participants in the research. Spatial Intelligence Scale and pentominoes puzzles were used as an instrument in this study. Result of this study showed that after students took digital pentominoes game, students spatial abilities improved. Also, the gender difference can be reduced by support of digital pentominoes game. In addition, they found that low spatial ability groups had the gender differences.
There were some studies about the effect of gender for spatial visualization ability. Some of the studies show no difference between female and male participants. However, in some of the studies differences occur in favor of male.
19
Studies in favor of male participants
Through the history there were different research to examine the difference of scores between female and male participants. In some studies (Bouchard & McGee, 1977; Harris, 1978; McGee, 1979; Sanders, Soares & D’Aquila, 1982) scores of male participants were higher than the scores of female participants.
There were different theories about the gender difference for spatial ability. Harris (1978) proposed a genetic x-linked model to explain the gender difference in spatial ability. According to him, it was recessive trait and it carried on X-chromosome. This was about the role of biological factors. Another theory is about the brain lateralization. According to research (Buffery & Gray, 1972; Levy, 1976) male had greater degree of lateralization and it was advantage in spatial ability. In addition, timing of puberty was another effect of gender difference in spatial ability. According to Waber (1976, 1977) male matures earlier than female and they had better performance than female participants.
Instructional and environmental factors were another reason for gender differences in spatial ability. According to Ferguson et al. (2008), environment and experience have an impact to spatial abilities of students. Physical environment has a positive effect to increase male participants’ spatial ability since they exposed it more than female participants. Therefore, according to them, male participants had higher spatial ability.
In addition rather than biological factors, academic factors and construction based toys played an important role to develop spatial abilities. Gold et al. (2018)
20
conducted a research to investigate effect of academic training, childhood toys and motivation on spatial ability. In this research they found significant difference in spatial ability between female and male undergraduate students especially in mental rotation. Result of this research showed that spatial ability is related with academic trainings, extra-curricular activities. Spatial ability can be developed by using construction-based toys in childhood and activities which students involved in.
Studies with no gender difference
Although there were research about gender difference in spatial ability, some research showed no gender difference in spatial ability.
Seng and Chan (2000) explored the spatial ability and gender differences in an elementary school. In their research 127 (55 female and 72 male) elementary school pupils were participants. In this research Spatial Relation Orientation Test and the Spatial Visualization Test were used to investigate students’ spatial ability. Result of this study showed that there was no gender difference between students’ spatial ability. Seng and Chan (2000) emphasised that students’ spatial ability can be developed by cultural factors and training sessions last ten years.
Hyde (1981) conducted a research by using meta-analysis techniques to investigate the gender difference in spatial ability which is cited by Maccoby and Jacklin (1974). Maccoby and Jacklin found the well-established gender difference in spatial ability in favor of males. Hyde (1981) conducted a research to assess the magnitude of gender difference and the result showed that gender difference in spatial ability were very small. This showed that gender had minimum influence of students’ scores of
21
spatial ability. Fairweather (1976) explained that there were other factors for the predictor of spatial performance such as birth order, handedness or maturation rate. According to Feingold (1988) relation between gender difference and the year of the study was inversely proportional. He concluded that attitudes toward female was changed over the past several decades and it helped to reduce gender difference in cognitive abilities. Also, tests which is used to investigate the spatial ability of students were important to decide emergence age of sex difference (Voyer, Voyer & Bryden, 1995). Voyer, Voyer and Bryden found that there was gender difference for spatial ability over 18 years old. However, according to them there were no
significant gender difference in spatial ability for participants which was below 18 years old.
In this section, various results were explored. According to results, age, year of the study, cultural factors had an effect of gender difference in spatial ability.
The studies about grade level/age difference in cognitive style Age was an important factor to show different cognitive styles such as field dependent or field independent. Panek, Funk and Nelson (1980) conducted a
research to investigate validity and reliability of group embedded figures test. There were 175 females and their ages from 17 to 72 years. They divided participants into seven different groups depending on their ages. When the mean scores of group 1 (aged 17 to 24, M=5.12, SD=2.79) and group 2 (aged 25 to 32, M=5.36, SD=2.41) participants were considered, mean scores were increased with age for the second part of GEFT. However after the group of 3 (aged 33 to 40, M=3.68, SD=2.84) mean scores were started to decrease. There were statistically significant difference the
22
mean scores of group 1 and group 3 or group 2 and group 3. It was same for the third part of GEFT. It showed that when the age of the participants increased, there were difference in cognitive style. Mean scores of the participants and the age of the participants were inversely proportional. However, according to Panek, Funk and Nelson (1980), it was true for the age above 33 years.
It has been accepted that individuals become relatively more field-independent as they mature. According to Glynn and Stoner (1987), there were positive correlation (0.65) between age and the Children’s Group Embedded Test scores. For the research participants were aged from 5 to 12 years old. There was another research found age difference in Preschool Embedded Test scores between 4 and 5 years old (Hall et al., 1988; Haynes &Miller, 1987). In addition, Massari (1975) found the difference in the mean scores of Children’s Group Embedded Figures test for Grade 1 and Grade 3 students.
Guillot and Collet (2004) conducted a research to analyze the relationship between field dependence/independence and complex motor skills. Participants of this research was athletes and their ages were from 16 to 35 years. They divided athletes into two group according to mean of age. One group involved ages below the mean (M=22.0) and another group involved the ages above the mean. GEFT was used as an instrument to find athletes’ cognitive style. Result of this study showed that there were no significant difference for age over the whole sample. Above 22 years mean score was 11.08 with standard deviation of 4.91 and below 22 years mean score was 12.42 with standard deviation of 4.23. This result was in agreement with Tabernero and Marquez (1999). There were no significant difference for age over the whole
23
sample in their research. On the contrary, Baker et al. (1998) found significant difference with the males in their twenties and the males in other age groups. Males in their twenties were more field-independent than males in other age groups.
The studies about grade level/age difference in spatial ability Many researcher concluded that when the grade level/age of the students was increased their performance on spatial ability also increased. Johnson and Meade (1987) conducted a research with students from kindergarten to grade 12. They adapted seven spatial ability test for use in children. For example, they use simple and clear instruction, interesting items in test and relatively simple test items. Tests were Flags, Hands, Blocks, Hidden Figures, Spatial Relations, Mental Rotations and Cubes. Tests were prepared according to students grade level/age. Lower battery was used for students from kindergarten to grade 4. Middle battery tests were used from grade 4 to grade 6. Upper battery tests were used from grade 7 to grade 12. Result of this study showed that when the grade level of the students’ were increased their performance also increased. According to Johnson and Meade (1987) there were strong tendency for spatial ability performance of students to improve over grade.
There were studies to test age difference in spatial ability and spatial reasoning. Ben-Chaim, Lappan and Houang (1988) explored the influence of instruction on spatial visualization ability of middle school students. There were approximately 1000 students as participant in this study. As pre-test and post-test, Middle Grades
Mathematics Projects (MGMP) Spatial Visualization test were applied. After the pre-test were completed, MGMP Spatial Visualization Unit was taught for three weeks. According to finding of this study, increase in grade level results with increase in
24
spatial visualization ability before the instructional intervention. Researcher related that with the maturity level of students. When maturity level increased, spatial ability of individual also increased. It was consisted with previous research (Fennema & Sherman, 1977, 1978; Guay & McDaniel, 1977). In addition, after the intervention gains were close to each other both female and male participants.
There was more recent research about the spatial ability of fifth to eighth graders. Michaelides (2002) conducted a research with 107 students from fifth to eighth graders. Spatial ability of mental rotation was assessed by using 19 multiple choice items. Result of this study revealed that when the students’ grade level/age was increased, they scored significantly higher than the students from lower grade level for the three dimensional subset. He argued that designing instructional assessment material for special age groups can be guided by knowledge about the effect of age in spatial reasoning and it was the developmental point of view of this research.
Relationship between cognitive style and spatial ability
Almost two decades later, Macleod, Jackson and Palmer (1986) investigated whether field dependence is related to an individual’s spatial ability. They selected 60
subjects from 134 undergraduate students from the University of Toronto. There were 30 male and 30 female in this research. Their ages ranged between 19 and 24. They used the Embedded Figure Test and the Rod and Frame Test for field
dependence. The Spatial Relation Subsets of the Multiple Aptitude Test and the Block Design Subsets of the Wechsler Adult Intelligence Scale were used for spatial ability. As a result of this study, spatial field dependence and spatial ability exhibited a median correlation of 0.51. Generally, correlation cannot be found due to random
25
error and method factor in these type of researches. However, they used statistical methods to help them avoid understating intertrait correlations. In this article researchers use confirmatory factor analysis technique to eliminate biases. They found that spatial ability and field dependence are strongly correlated.
In addition, a recent study, which is conducted by Taskon, Boccia, Piccardi and Cimadevilla (2017), is about the relationship between cognitive style and spatial performance. The purpose of this study was to find the effect of cognitive style and gender on spatial recognition. There were 40 participants which are undergraduate College students from Sapienza University, Rome. Half of these participants were male and half of them were female. Firstly, the Familiarity and Spatial Cognitive Style scales were used to confirm that participants did not have any topographical orientation disorders. Then, they used the Embedded Figure Test for assessing cognitive styles of participants. In addition to these, they used the Almeria Spatial Memory Recognition Test for assessing participants’ spatial recognition. ANOVA was used to analyze data. Also, Statistica 10 was used to operate analysis. In that research it is found that field dependent individuals could not deduce spatial
information. Field independent individuals are more proficient than field dependent individuals in extracting information and put these information to look at different perspectives. Also, they found that there is no gender difference in individuals’ performance on spatial memory tasks.
To conclude, there are different studies about individual’s spatial ability and field dependence-independence. They investigated their abilities in different perspectives. Researches were conducted at different countries. Also, gender effect was studied in
26
previous years. Embedded Figure Test is a good instrument for measuring field dependence. These studies shed light on the current research topic. Moreover, the result of the current research may provide teachers to use different ways for their teaching according to abilities of students in physics education.
27
CHAPTER 3: METHOD Introduction
The purpose of this study was to investigate the relationship between high school students’ cognitive style and their spatial visualization ability. This study provided an overall view of relationship between students’ cognitive style and spatial
visualization ability and how was the relationship between gender and different age or different grade levels with cognitive style and spatial ability.
Research design, context, participants, instrumentation, data collection and data analysis are the six sections comprising this chapter. In the research design section, research method and related constructs were described. A rational for choosing the method is described in this section as well. The context section provides information about the schools used in this research and the participants. Participant section included the population description and sampling strategy. In the instrumentation section, validity and reliability of the instrument were clarified. Data collection procedure and the ethical issues regarded regulation of Ministry of National Education (MoNE) was explained in the data collection section. Moreover, in data analysis section, analysis of this research was explained.
Research design
The purpose of this study was to explore the relationship between students’ cognitive and their spatial visualization ability. Therefore, this study is classified as a
28
quantitative research and it is correlation research. In this study three variables were measured by using two different tests and then statistical relations between them were assessed. Therefore, I choose correlation research design. In addition, it is a descriptive study and instrument is testing in this study. There are two different tests to measure students’ cognitive style and spatial ability separately. In two different tests following research questions were addressed:
1. Is there a statistically significant relationship between students’ cognitive style and their spatial visualization ability in some selected high schools in Ankara?
2. Are there any statistically significant difference between students’ cognitive style by gender?
3. Are there any statistically significant difference between students’ spatial visualization ability by gender?
4. Are there any statistically significant difference between students’ cognitive style by schools?
5. Are there any statistically significant difference between students’ spatial visualization ability by schools?
6. Are there any statistically significant difference between students’ cognitive style by grade?
7. Are there any statistically significant difference between students’ spatial visualization ability by grade?
Research method
This study looked at existing relations between variables. Therefore, Creswell (2014) explained that, although it was correlation research, it can be refereed as descriptive
29
research. According to Ayiro (2012), descriptive research method explores information about existing events, situations or conditions. Descriptive research method describes the facts and characteristics of a given population or area of interest (Isaac & Michael, 1979). It helps the determining the frequency with which something occurs or help to categorize information (Burns & Grove, 1987).
In Turkey, any research conducted in schools needs an official approval by the Ministry of Education. This will grant that the research can be conducted in schools. However, final say has the school teacher. In other words, the MoNE approval is just the initial step. After having the approval of MoNE, schools was decided to conduct research by calling the head of the schools. If they permit to apply test in their schools, day was decided with them. However, some schools do not give permission to do tests because it was exam week and teachers should prepare their schedule according to it. In the decided day, first the head of the schools was visited first and according to guidance and suitability of teachers, test applied at different grades and classrooms. However, before tests were applied, the head of the school informed parents and signed informed consent form which includes the purpose of the research and rights of this research. Also, researcher’s e-mail address and the phone number included in this permission paper to answer parents’ questions about the research if they have questions.
Moreover, this study took place at four different Anatolian high schools in Çankaya region. There were two different tests to examine students’ cognitive style and spatial visualization ability. Students’ responses were analysed to find the
30
Moreover, how students’ cognitive style and spatial visualization ability can change according to their gender, age or grade levels were investigated at four different schools. The data collection was done in March 2019. Tests were done in a week and one day was allocated for each school.
Context
The study took place at four Anatolian High Schools in Ankara. In this research four different high schools were chosen to apply tests in order to have different range of students according to their success. Using different high schools can be better for having variety result. In this test School 2 was highest ranked school according to high school entrance exam. Then School 4 followed it and afterwards School 3 was coming. School 1 was the last one as compared to others when the results of high school entrance exam was considered. Also, since before 2018 students went to high school according to their success. However, students started to enter the high schools starting from the previous year according to their home address. Therefore, in this study 10 and 11 graders entered high schools according to their success and 9 graders entered high school according to their home address.
Tests were applied during the spring term of 2018-2019 school year. All students participated in tests in a class. Tests were conducted under the same condition. All participants were given 40 minutes to complete the two tests. The Group Embedded Figure Test (GEFT) took 15 minutes and Purdue Spatial Visualization Test (PSVT) took approximately 25 minutes. Information about each school were given in Table 1.
31
Table 1
School names and the number of participants
Schools Number of participants
School 1 94
School 2 110
School 3 81
School 4 108
Participants
Participants of this study was Anatolian high school students in Çankaya. Participants of this research was grades 9, 10, and 11.
In this study, there were 183 students from ninth grade, 114 students from tenth grade and 96 students from eleventh grade. Totally, participants were 393 students from four different high schools. Moreover, 187 of participants were male and 206 of participants were female. In Figure 2 percentage of female and male students were given.
Figure 2. The percentage of female and male students
Moreover, number of students from different grades are given in table 2. In addition to this, percentages of students’ grades are given in Figure 3. According to this table,
Female; 52% Male; 48%
32
47 % of students were from grade 9 (n =183), 29 % of students were from grade 10 (n=114) and 24 % of students were from grade 11 (n=96).
Table 2
Grade levels and the number of participants
Grade level Number of participants
Grade 9 183
Grade 10 114
Grade 11 96
Figure 3. Percentage of students from different grades
Instrumentation
In this research two tests were used. The first test, named as Group Embedded Figure Test (GEFT), assessed cognitive styles. The second test was Purdue Spatial
Visualization Test (PSVT) assessed students’ spatial abilities. 47%
29% 24%
33
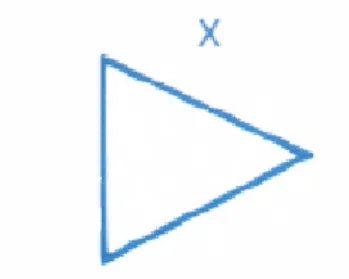
In this research instrument is testing. The Group Embedded Figure Test is developed by Witkin, Oltman, and Raskin (1971), and the Purdue Spatial Visualization Tests is developed by Guay (1976). The original English version of the GEFT is given in Appendix A. This test consists of three parts and there were 25 questions. In the first part, there are seven questions and two minutes were given to students for the first part. For the second and third part, there are nine questions in each part and 5 minutes were given to students for each part. In each part, students found simple form which is hidden in a complex pattern. Simple forms were given at the end of the booklet. Turkish version of the GEFT is used in this research to apply test in schools. In Appendix B, the Turkish translated version of the test is given. Bilkent University Library had the right of the use of GEFT and had this test in the university catalogue of the library. In this test, simple forms and complex figures are given to participants. In Figure 4 example of simple form was given and it was labelled by X.
34
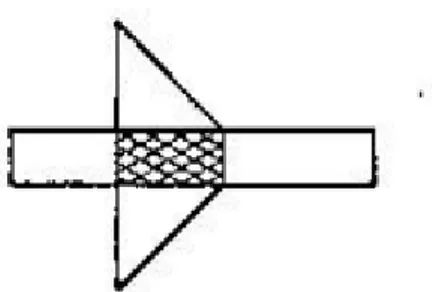
The simple of X is hidden within the more complex figure below Figure 5.
Figure 5. Complex figure from GEFT
In this test participants tried to find the simple form X in the complex figure and they traced it with pencil directly over the lines of the complex figure like Figure 6.
35
Participants were asked to find the simple form in same size, same proportion and facing in the same direction.
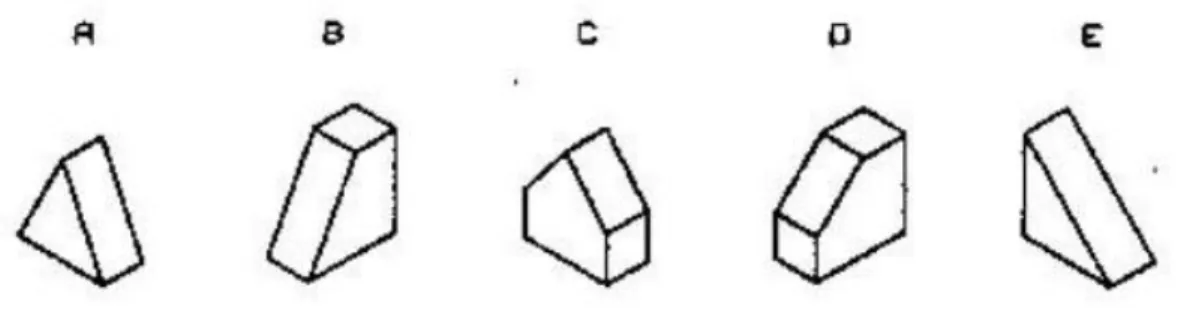
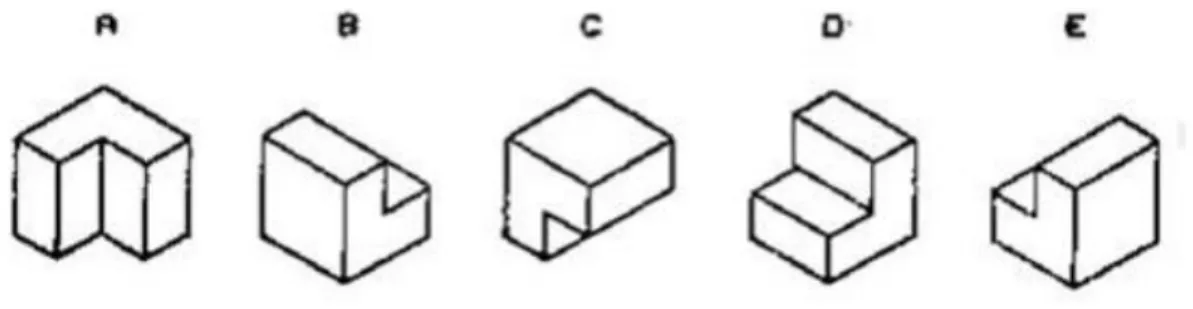
For the second test, PSVT, Turkish translated version of the test is given in Appendix C which is translated by Sevimli (2009) for his master thesis. It was used in this study to assess students’ spatial visualization ability. Permission was obtained from Sevimli to use the translated version of PSVT in this research in July 2018 via e-mail. This test consists of three parts, and in each part, there are 12 questions. The test begins with examples in the beginning of each part of the test. First part is about formation of 3D shapes. In this part students formed 3D shape by using the open form of given shapes. Example of PSVT was given in Figure 7 and Figure 8. In this test Figure 7 was given. It was the open form of the 3D shape and Figure 8 consisted of the multiple-choice shapes. In this part participants determined 3D shape by analyzing the Figure 7. Students answered these questions by using answer sheet which was distributed them. Correct answer was E from Figure 8.
36
Figure 8. Multiple choice to determine 3D shape of Figure 7
Second part is about the rotation of 3D shapes. In this part of the test, example of the rotation is given for one shape. Then, participant should rotate given shape by
rotating in the same direction as the example one. In Figure 9, rotation of an object is given.
Figure 9. Rotation of object
In Figure 10 another 3D shape was given. Then in this part, participant was supposed to rotate 3D shape given in Figure 10 in the same direction as the example from Figure 9. According to this rotation, participants chose one of the choices from Figure 11. Correct answer of this example was D.
37
Figure 11. Choices to find the correct result after rotation
Moreover, third part is about looking the 3D shape from different perspective. Students looked 3D shape from different points of another 3D shape. In Figure 12, 3D shape was given inside the 3D box. Also, the black dot was given on the right side of the box.
Figure 12. 3D shape and 3D box with black dot
In this part, participants supposed to look the 3D shape in the box by using the perspective of the black dot. In Figure 13, multiple choices are given and one of them was the correct answer. Correct answer of this example was E.
38
Moreover, a panel study conducted with students from Curriculum and Instruction with Teaching Certificate master students from Bilkent University. GEFT and PSVT was administered to 10 master students to check for possible misunderstanding during GEFT and PSVT. This study was the validation of GEFT and PSVT. Moreover, reliability analysis was conducted by using Statical Package for Social Science (SPSS).
Method of data collection
Before tests were applied in schools, permission from Ministry of National Education (MoNE) were obtained by submitting a research proposal to MoNE. In this proposal, problem, purpose, research question, significance, limitations,
participants, instruments, data collection methods, permission from tests developers to use their tests in this study, list of the schools were submitted to MoNE. After having the permission from MoNE for the 2018-2019 academic year, researcher contacted to the principals of the selected schools to get another permission from them. It is important to get permission from not only from MoNE but also from the principals or the vice principals of the schools since they have right to not allow to do tests in their schools. Therefore, the principals or the vice principals of the schools are called to get another permission from them. After getting permission from both MoNE and the principals of the four different schools, tests were applied in four different schools by the researcher.
After getting permission from principals of the schools, four different days was planned to apply tests at schools. Question booklets, the answer sheets and pencils are prepared for participants. Tests were applied with the guidance of teachers.
39
Introduction of the researcher and the introduction of the tests were the steps of applying tests. Students are informed about tests. GEFT was started with the explanation part and then the first section. Students asked their questions after the explanation part and the first section if there were misunderstanding since the first part of the GEFT was pilot part. Also for PSVT, students asked questions after examining the examples before tests started.
Methods of data analysis
After data were gathered from participants, statistical analysis was done by using SPSS and data were investigated by using descriptive statistical methods. Mean, median, mode, skewness, kurtosis, range, standard deviation and frequency was computed by using descriptive statistical methods. Also, descriptive statistical methods were applied based on gender, grade level and school type. In addition, independent sample t-test and ANOVA was conducted in this research.
In this chapter, the research method and how it applied was explained. The timeline and participants were explained. Context, instrumentation, data collection and data analysis methods are provided in this chapter. In the next chapter the results of data analysis were detailed.