MULTITASK LEARNING OF GENE RISK
FOR AUTISM SPECTRUM DISORDER AND
INTELLECTUAL DISABILITY
a thesis submitted to
the graduate school of engineering and science
of bilkent university
in partial fulfillment of the requirements for
the degree of
master of science
in
computer engineering
By
˙Ilayda Beyreli
October 2020
MULTITASK LEARNING OF GENE RISK FOR AUTISM SPEC-TRUM DISORDER AND INTELLECTUAL DISABILITY
By ˙Ilayda Beyreli October 2020
We certify that we have read this thesis and that in our opinion it is fully adequate, in scope and in quality, as a thesis for the degree of Master of Science.
Abdullah Erc¨ument C¸ i¸cek(Advisor)
Can Alkan
Tunca Do˘gan
Approved for the Graduate School of Engineering and Science:
Ezhan Kara¸san
ABSTRACT
MULTITASK LEARNING OF GENE RISK FOR
AUTISM SPECTRUM DISORDER AND
INTELLECTUAL DISABILITY
˙Ilayda Beyreli
M.S. in Computer Engineering Advisor: Abdullah Erc¨ument C¸ i¸cek
October 2020
Autism Spectrum Disorder (ASD) and Intellectual Disability (ID) are comorbid neurodevelopmental disorders with complex genetic architectures. Despite large-scale sequencing studies only a fraction of the risk genes were identified for both. Here, we present a novel network-based gene risk prioritization algorithm named DeepND that performs cross-disorder analysis to improve prediction power by exploiting the comorbidity of ASD and ID via multitask learning. Our model leverages information from gene co-expression networks that model human brain development using graph convolutional neural networks and learns which spatio-temporal neurodevelopmental windows are important for disorder etiologies. We show that our approach substantially improves the state-of-the-art prediction power. We observe that both disorders are enriched in transcription regulators. Despite tight regulatory links in between ASD risk genes, such is lacking across ASD and ID risk genes or within ID risk genes. Finally, we investigate frequent ASD and ID associated copy number variation regions and confident false findings to suggest several novel susceptibility gene candidates. DeepND can be general-ized to analyze any combinations of comorbid disorders.
Keywords: Autism Spectrum Disorder, Intellectual Disability, Comorbidity, Mul-titask Learning, Graph Convolutional Networks, Deep Learning.
¨
OZET
OT˙IZM SPEKTRUM BOZUKLU ˘
GU VE ZEKA
GER˙IL˙I ˘
G˙I ˙IC
¸ ˙IN C
¸ OK G ¨
OREVL˙I GEN R˙ISK ¨
O ˘
GREN˙IM˙I
˙Ilayda Beyreli
Bilgisayar M¨uhendisli˘gi, Y¨uksek Lisans Tez Danı¸smanı: Abdullah Erc¨ument C¸ i¸cek
Ekim 2020
Otizm Spectrum Bozuklu˘gu (OSB) ve Zihinsel Engel (ZE) karma¸sık genetik yapıları olup birbirlerine e¸slik eden n¨orogeli¸simsel bozukluklardır. B¨uy¨uk ¨
ol¸cekli gen sıralamaları ara¸stırmalarına ra˘gmen iki bozukluk i¸cin de sorumlu risk genleinin ancak k¨u¸c¨uk bir y¨uzdesi belirlenebilmi¸stir. Bu ara¸stırmada OSB ve ZE i¸cin e¸slik bilgisini de kullanarak ¸capraz hastalık analizi ile tahmin g¨uc¨un¨u arttıran DeepND adında yeni bir ¸cizge tabanlı gen risk ¨
onceliklendirme algoritması tasarladık. Model insan beyin geli¸simini mod-elleyen gen e¸s ifade ¸cizgelerini ¸cizge evri¸simsel sinir a˘gları ile i¸sleyerek iki hastalık i¸cin de ¨onemli mekansal-zamansal n¨orogeli¸simsel aralıkları ¨o˘grenebilir. Sonu¸clarımız sundu˘gumuz mimarinin alandaki son teknolojinin sa˘gladı˘gı tah-min g¨uc¨un¨u arttırdı˘gını g¨ostermektedir. ˙Iki bozukluk i¸cin de transkripsiyon regulat¨orlerinindeki zeginle¸stirilmeler g¨ozlemlendi. OSB genleri arasındaki sıkı d¨uzenleyici ba˘glantılara ra˘gmen, bu ba˘glantıların OSB ve ZE genleri ile sadece ZE genleri arasında aynı derecede olmadı˘gı belirlendi. Son olarak, OSB ve ZE ba˘glantılı kopya numara varyasyonlarını ve modelin emin oldu˘gu yanlı¸s bulguları inceleyerek birka¸c yeni ¸s¨upheli risk geni belirlendi. DeepND mimarisi kolayca birbirlerine e¸slik eden bir¸cok hastalık i¸cin genellenebilir.
Anahtar s¨ozc¨ukler : Otizm Spektrum Bozuklu˘gu, Zihinsel Engel, E¸slik Eden Hastalık, C¸ oklu G¨orev ¨O˘grenme, C¸ izge Evri¸simsel A˘glar, Derin ¨O˘grenme.
Acknowledgement
First and foremost, I would like to express my sincere gratitude to my advisor Asst.Prof. A. Erc¨ument C¸ i¸cek for his guidance, support, and help throughout my master’s studies. It was a great honor to work with him. With his guidance, I was able to conduct this study and discover a way to turn my interest into a career path.
I also would like to thank my jury members Can Alkan and Tunca Do˘gan for reading my thesis and accepting to be on my thesis committee. I also thank Simons Foundation Autism Research Initiative for supporting this research via SFARI 640935 pilot grant awarded to A. Erc¨ument C¸ i¸cek.
I would like to thank O˘guzhan Karakahya for his valuable friendship, support, and efforts throughout this study. His work created the baseline for this thesis and I am grateful for his contributions.
I also thank Mustafa, Emre, G¨ul¸sah, and other friends I am yet to mention for their support, encouragement, and wonderful memories. I would also like to thank Alpay for his immense support, understanding and always being by my side through highs and lows.
Last but not least, I would like to thank my family for their support and love. They have presented me opportunities for my education which I cannot repay all along.
Contents
1 Introduction 1
2 Background Information 4
2.1 Copy Number Variations, De Novo Loss-of-function and Missense
Mutations . . . 4
2.2 The Transmission and De Novo Association Test (TADA) . . . 5
2.3 Gene Co-expression Networks . . . 6
2.4 Biological Pathways and Transcription FactorsAssociated with ASD or ID . . . 7
3 Related Work 8 3.1 DAWN . . . 8
3.2 DAMAGES . . . 9
3.3 SVM Based Genome-wide Risk Prediction for ASD . . . 10
3.4 ST-Steiner . . . 11
CONTENTS vii
4 Methods 13
4.1 Problem Description . . . 13
4.2 DeepASD . . . 14
4.2.1 Graph Convolutional Network Model . . . 14
4.2.2 Mixture of Experts Model . . . 15
4.3 Proposed Algorithm . . . 15
4.3.1 Multitask Learning Model . . . 15
4.4 Experimental Setup . . . 17
4.4.1 Ground Truth Risk Gene Sets . . . 17
4.4.2 Gene Features . . . 18
4.4.3 Spatio-Temporal Gene Co-expression Networks . . . 19
4.4.4 Learning and the Cross Validation Setting of DeepND . . . 19
4.4.5 Computational Unit . . . 20
5 Results 21 5.1 Genome-wide Risk Predictions for ASD and ID . . . 21
5.2 Critical Neurodevelopmental Windows for ASD and ID . . . 23
5.3 Enrichment Analysis of the Predicted Risk Genes . . . 29
CONTENTS viii
5.5 Identification of Novel Candidates within ASD and ID Associated with CNV Regions . . . 36
5.6 Evaluation of Novel Predictions . . . 39
6 Conclusion 43
List of Figures
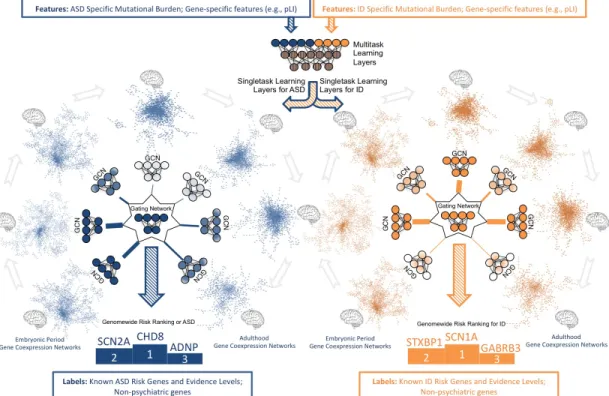
4.1 System model of the proposed deep learning architecture for genome-wide cross-disorder risk assessment (DeepND). The fea-tures are passed through fully-connected multitask layer that learn shared weights for both disorders and produces a new feature rep-resentation. This new representation is then input to singletask GCNs, each processing one of fifty-two gene co-expression net-works that represent different brain regions and neurodevelopmen-tal time windows. The output of GCNs are then weighted by the Gating Network to learn which networks are informative for the gene risk assessment for each disorder’s etiology. The final out-put is a genome-wide risk probability ranking per disorder, which are then used for various downstream analyses to understand the underlying functional mechanisms and to compare/contrast both disorders. The singletask layers are exclusively trained with the ground truth genes of the disorder they belong. Thus, they learn only disorder specific parameters and disorder-specific networks that implicate risk. . . 16
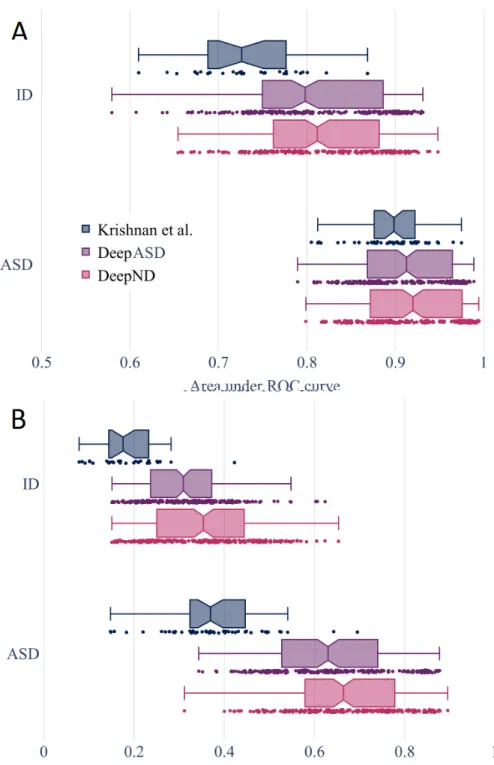
5.1 (A) The area under the receiver operating characteristic curve (ROC AUC) distribution of 200 results for DeepND, DeepASD and Krishnan et al. (B) The area under precision-recall curve (AUPRC) distributions for the same methods as in (A) . . . 22
LIST OF FIGURES x
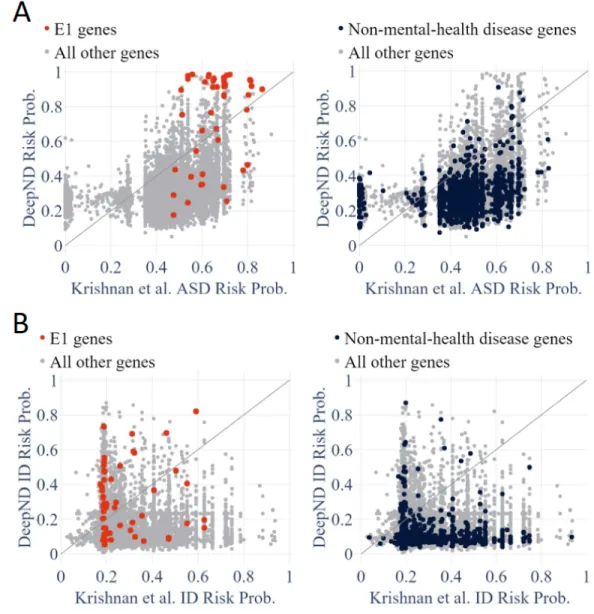
5.2 Scatter plots that presents assigned probabilities for each gene by DeepND and et al. for ASD (A) and ID (B). Red: E1 genes; Black: Non-mental-health disease genes; and Grey: all other genes. A better assessment method would have the E1 genes towards its side of the diagonal and have the black genes on the other side of the diagonal. . . 24 5.3 Precision - Recall curves to compare DeepND, DeepND - ST,
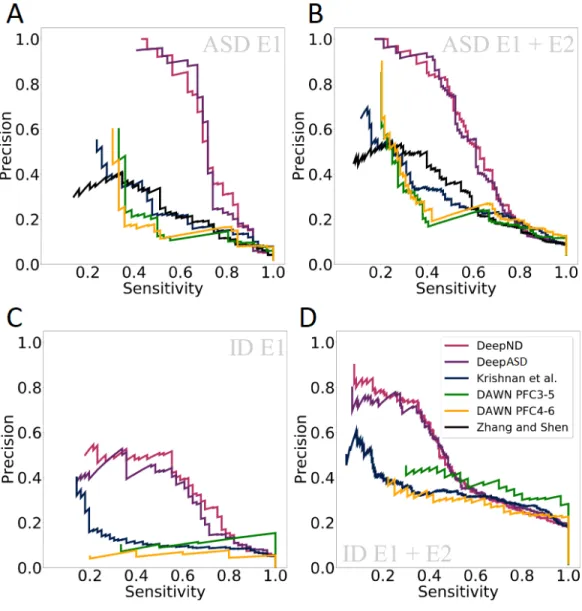
Evi-dence weighted SVM of Krishnan et al., DAWN, and DAMAGES score of Zhang and Shen. Results for ASD (A & B) and ID (C & D) shown when (i) E1 genes are used as the true risk genes and (ii) E1+E2 genes are considered as the true risk genes. . . 25 5.4 Neuroevelopmental windows (A) and brain regions clusters (B)
used for generating co-expression networks from Brainspan RNA-Seq dataset . . . 27 5.5 Normalized average probabilities assigned to top percentile risk
genes by DeepASD (top) and DeepND (bottom) for ASD . . . . 28
5.6 Normalized average probabilities assigned to top percentile risk genes by DeepASD (top) and DeepND (bottom) for ID . . . 28 5.7 Heapmap shows average weights assigned by MoE module of
Deep-ASD (top) and DeepND (bottom) to each spatio-temporal window for the top percentile genes for ASD. . . 30 5.8 Heapmap shows average weights assigned by MoE module of
Deep-ASD (top) and DeepND (bottom) to each spatio-temporal window for the top percentile genes for ID. . . 30
LIST OF FIGURES xi
5.9 The summary of co-expression relationship between top percentile genes in each disorder on MDCBC2-4 network which is observed to be the weakest source of information. Although the full MDCBC2-4 network has 37.5m edges, only approximately 12.5k of them are between top percentile risk genes. . . 31 5.10 The summary of co-expression relationship between top percentile
genes in each disorder on MDCBC9-11 network. The full MD-CBC network contains 13m edges and 30k of them are between top percentile risk genes. The ratio of links between top percentile genes to total edges also indicate the importance of MDCBC9-11 for both disorders’ ethiologies. . . 32 5.11 The enrichment of DeepND ASD and ID rankings in various disease
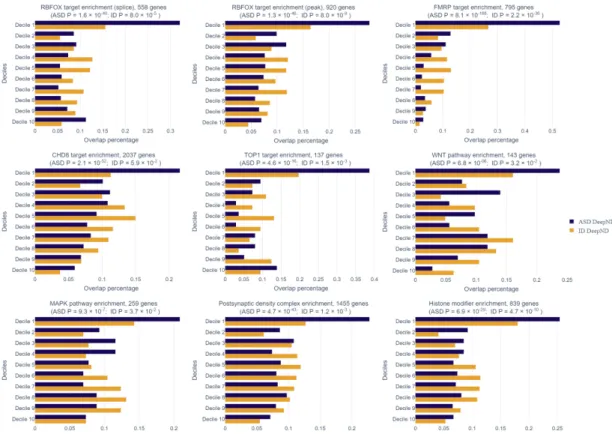
related gene sets is given in each panel. The horizontal axis shows the percentage of genes in the corresponding gene set. The results for genome-wide risk ranking for ASD and ID are shown in blue and yellow respectively. The considered gene sets are as follows: (i) Targets of RBFOX (splice), (ii) Targets of RBFOX (splice target), (iii) Targets of FMRP (all peak), (iv) Targets of CHD8, (v) Targets of TOP1, (vi) WNT Pathway, (vii) MAPK Signaling Pathway, (viii) GTPase regulator activity, (x) Postsynaptic density complex genes, (xi) Synaptic genes (xii) Histone modifier genes. . . 34
LIST OF FIGURES xii
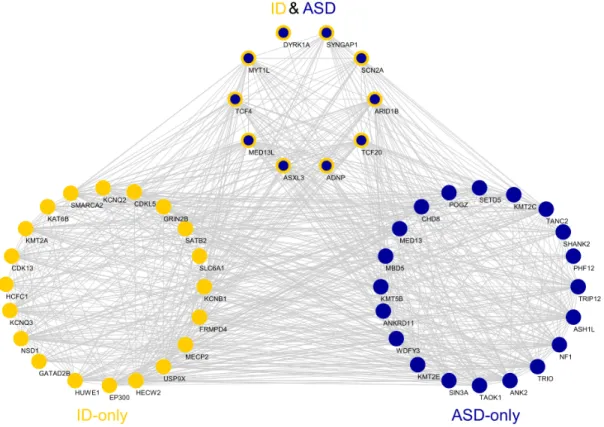
5.12 Network Analyses of the risk genes. (a) The co-expression rela-tionships between top 30 ASD and ID risk genes in MDCBC 9-11 region. Only links for at least 0.95 absolute correlation and genes with at least one connection are shown. (b) The protein-protein interactions between the top percentile risk genes are shown. The PPIs are obtained from the tissue specific PPI network of frontal cortex in DifferentialNet database [1]. (c) The regulatory relation-ships between the top percentile ASD-only and ID-only risk genes in the ChEA transcription factor regulation database are shown. 69 genes are ranked in the top percentile for both disorders. Red arrows indicate that the TFs in the source has more targets than expected by chance in the target group. Cobalt blue arrows in-dicate that the TFs in the source has less targets than expected by chance in the target group and aegean blue arrows indicate expected connectivity. . . 37
5.13 Median RNA expression patterns of GABRG3 (top), MICAL3 (bottom-left) and FOXO3B (bottom-right) across various tissues in the GTEx dataset [2] (transcripts per million). . . 40
5.14 Median RNA expression patterns for confident novel predictions of DeepND across various tissues in the GTEx dataset [2] (tran-scripts per million): SLC9A9 (top-left), CACNA1H (top-right), TAT (bottom-left) and GIGYF2 (bottom-right). . . 42
List of Tables
A.1 Neurodevelopmental time periods proposed by Willsey et al. [3]. Sliding window approach is used to create 13 temporal windows
which is presented in Figure 5.4(A). . . 58
A.2 Brain region clusters formed by using hierarchical clustering based on transcriptional similarity of these brain regions (Willsey et al., 2013). The cross section of brain which shows these regions is presented in Figure 5.4(B). . . 59
A.3 The positive ground truth genes for ASD . . . 60
A.4 The negative ground truth genes for ASD . . . 67
A.5 The positive ground truth genes for ID . . . 74
A.6 Genes discarded from the negative set for ID . . . 77
A.7 DeepND ranking and posterior risk for selected genes located in 16p11.2 . . . 78
A.8 DeepND ranking and posterior risk for selected genes located in 15p11-13 . . . 79
A.9 DeepND ranking and posterior risk for selected genes located in 15p13.3 . . . 80
LIST OF TABLES xiv
A.10 DeepND ranking and posterior risk for selected genes located in 1q21.1 . . . 80
A.11 DeepND ranking and posterior risk for selected genes located in 22q11 . . . 81 A.12 DeepND ranking and posterior risk for selected genes located in
22q11.21-22 . . . 82
A.13 DeepND ranking and posterior risk for selected genes located in 17p11.2 . . . 83 A.14 DeepND ranking and posterior risk for selected genes located in
Chapter 1
Introduction
Comorbidity refers two or more physiological or psychological conditions co-occuring independently or related to one another. In the context of neuropsy-chiatric disorders, comorbidity refers to coexisting disorders in the same person. Overwhelming evidence suggests that genetic architectures of neuropsychiatric disorders overlap [4, 5, 6]. For instance, out of the twenty five SFARI Cat I Autism Spectrum Disorder (ASD) risk genes (i.e., highest risk), only five are solely asso-ciated with ASD. Intellectual Disability (ID), characterized by impaired mental capabilities, is one of such comorbid disorders with ASD [7]. Both ID and ASD have complex genetic backgrounds with hundreds of risk genes involved and iden-tified by rare de novo disruptive mutations observed in whole exome and genome sequencing studies [8, 9, 10, 11, 12, 13, 14]. In , CDC reported that 31% of chil-dren with ASD were also diagnosed with ID and 25% were borderline [15]. They also share a large number of risk genes [16]. Despite these similarities, Robinson et al. also point to differences in genetic architectures and report that intelligence quotient (IQ) positively correlates with family history of psychiatric disease and negatively correlates with de novo disruptive mutations [17]. Yet, the shared functional circuitry behind is mostly unknown.
The current lack of understanding on how comorbid neuropsychiatric dis-orders relate mostly stems from the incomplete profiling of individual genetic
architectures. Statistical methods have been used to assess gene risk using excess genetic burden from case-control and family studies [18] which are re-cently extended to work with multiple traits [19]. It is often of interest to use these as prior risk and obtain a posterior gene interaction network-adjusted risk which can also assess risk for genes with no prior signal. Network-based com-putational gene risk prediction methods come handy for (i) imputing the in-sufficient statistical signal and providing a genome-wide risk ranking, and (ii) finding out the affected cellular circuitries such as pathways and networks of genes [18, 20, 21, 22, 23, 24, 25, 26, 27, 28]. While these methods have helped unraveling the underlying mechanisms, they have several limitations. First, by design, they are limited to work with a single disorder. In order to compare and contrast comorbid disorders such as ASD and ID using these tools, one approach is to bag the mutational burden observed for each disorder assuming two are the same. However, disorder specific features are lost as a consequence [20]. The more common approach is to perform independent analyses per disorder and intersect the results. Unfortunately, this approach ignores valuable source of information coming from the shared genetic architecture and lose prediction power as per-disorder analyses have less input (i.e., samples, mutation counts) and less statis-tical power [29, 30, 22]. Second, current network-based gene discovery methods can work with one or two integrated gene interaction networks [24, 31, 22, 32, 27]. This means numerous functional interaction networks (e.g., co-expression, protein interaction etc.) are disregarded which limits and biases the predictions. Gene co-expression networks that model brain development are a promising source of diverse information regarding gene risk, but currently cannot be fully utilized, as the signal coming from different networks cannot be deconvoluted. Usually, inves-tigating such risky neurodevelopmental windows is an independent downstream analysis [3, 32].
In this thesis, we address these challenges with a novel cross-disorder gene discovery algorithm (Deep Neurodevelopmental Disorders algorithm - DeepND.) DeepND analyzes comorbid neurodevelopmental disorders simultaneously over multiple gene co-expression networks and explicitly learns the shared and disorder-specific genetic features using multitask learning. The proposed DeepND
architecture uses graph convolution to extract associations between genes from gene co-expression networks. This information is processed by a mixture-of-experts model that can self-learn critical neurodevelopmental time windows and brain regions for each disorder etiology which makes the model interpretable.
We provide a genome-wide risk ranking for each disorder and show that the prediction power is improved. DeepND identifies mediodorsal thalamus and cere-bellar cortex brain region and infancy to childhood period as the highest neurode-velopmental risk window for both disorders. We observe that top percentile risk genes for both disorders are enriched in transcription regulators. Despite tight regulatory links in between ASD risk genes, we observe loose connectivity across ASD and ID risk genes or within ID risk genes. Finally, we investigate frequent ASD and ID associated copy number variation regions and confident false findings to suggest several novel risk gene candidates. This neural network architecture can easily be generalized to other disorders with a shared genetic component and can be used to prioritize focused functional studies and possible drug targets.
Chapter 2
Background Information
2.1
Copy Number Variations, De Novo
Loss-of-function and Missense Mutations
Genes are the basic units of heredity that contain the information needed to specify traits by coding for a specific protein or segment of protein leading to a particular characteristic or function within the organism.
Copy number variation (CNV) is a structural variation in genome where a stretch of DNA, where possibly multiple genes are located, are duplicated or deleted [33]. CNVs not only result in changes in the physical arrangement of genes on chromosomes but they also effect the dosage of the products of the genes which are located in the CNV regions. As a result, CNVs in several regions are associated with different types of diseases [34, 35]. However, most of the time these CNVs occur in relatively large regions and it is not clear which genes in particular are the actual driver genes of target diseases.
A genetic alteration that is present for the first time in one family member as a result of either a mutation in a germ cell of one of the parents or a mutation arises in the fertilized egg itself during early embryogenesis is called a de novo mutation
[33]. A missense mutation is single base pair change in DNA which results in substitution of a different amino acid in the resulting protein [33]. While this substitution may have no or very little effect, it also can increase or decrease the effectiveness of the protein [36]. If the missense de novo variant in question disturbs the function of the molecular product coded by the gene, it is classified as de novo gene disrupting or loss-of-function mutation (dnLoF). Such variants are important because they explain why reproductively lethal disorders, such as neurodevelopmental disorders, continue to occur in the population [37, 38, 39, 40].
In this study, we will use information obtained by identification of missense and dnLoF functions as features and several CNV locations previously associated with either ASD or mental retardation to conduct an extended analysis on our results.
2.2
The Transmission and De Novo Association
Test (TADA)
De novo mutations have high importance in gene discovery due to their high signal-to-noise ratio. However, during sequencing studies the majority of the iden-tified mutations are inherited variants and these analyses often fail to incorporate data from case-control studies. The Transmission And De novo Association test (TADA) is a Bayesian model that overcomes these challenges by combining data from de novo mutations, inherited variants in families, and standing variants in the population [41]. The model learns the parameters of disease risk gene and non-risk gene groups by likelihood maximization using a dataset including mu-tation counts and frequency of de novo variants in ASD case and control groups of different cohorts, the probability of loss-of-function intolerance (pLI) of genes and number of inherited and nonhereditary gene disruptive mutations in ASD trios.
disorders: intellectual disability, schizophrenia and epilepsy [26]. The extended TADA (extTADA) provides genome-wide risk probabilities for mentioned disor-ders based on published mutation counts for these disordisor-ders. Results from TADA for ASD and extTADA for ID are used as features for the model that is proposed in this thesis.
2.3
Gene Co-expression Networks
Correlation among genes can be represented in a gene co-expression network, where each node correspond to a gene and genes are paired if a significant co-expression association between them exists. Gene co-co-expression networks are built by scoring similarity among all gene pairs, choosing a score threshold and connecting all gene pairs whose scores exceed this value [42]. The expression level for a gene is measured using the amount of mRNA transcribed from it within a particular cell. Considering the cell differentiation in multicellular organisms, different transcription levels can be measured using cells from different tissues for a particular gene. Also, gene activations change during the life cycle of the organism. Therefore, gene co-expression networks may change depending on the subject tissue and observation time.
There are different strategies to calculate co-expressions among genes, normal-ization of the data and similarity metrics to use to built gene co-expression net-works. We use Pearson correlation coefficient or bivariate correlation to calculate gene similarity from measured expression values. Bivariate correlation measures linear correlation between two genes and ranges from −1 to +1. Then, we set a threshold to obtain the adjacency matrix for the gene co-expression network from calculated correlation values where correlations stronger than the threshold is represented with an undirected and unweighted edge in the network. Since the selected threshold effects the number of total edges (i.e. the size of the network), it can be adjusted according to the memory limitations of the computational unit. In this thesis, we used networks created by using the data from different brain regions of patients with varying ages for our analysis.
2.4
Biological Pathways and Transcription
Fac-torsAssociated with ASD or ID
Biological pathways are series of interactions of molecules and signals in a cell that lead to certain changes. They control the cellular functions and its responses to the environment. The affects of biological pathways can spread on short or long distances such as triggering mitosis on nearby cells or produce hormones to target distance cells [33]. Mutations in the genes that take part in a particular pathway may disturb the functions carried out by that pathway which may cause various diseases such as cancer, diabetes and neurodevelopmental disorders [43, 44, 45]. Analyzing these pathways is important to identify risk genes for diseases, and to develop effective treatments and diagnostic and prognostic markers. Recent studies identified a number of biologic pathways related to ASD and ID as these pathways are shown to distracted commonly in ASD and ID case groups such as WNT signaling [46] and MAPK signaling [47].
There are also proteins such that can be related to neurodevelopmental disor-ders since they regulate expression of genes in the cell. Some of the transcription regulators that are previously linked with ASD or ID includes CHD8 [48], FMRP [49, 50, 51], RBFOX [52, 53, 51] and TOP1 [54]. Enrichment of targets of men-tioned transcription factors and pathways can be used as a performance measure to validate risk predictions for disorders since it provides a comparison within the disrupted circuitries affected by ASD and ID. In this thesis, we also include genes that affect post-synaptic density complex [55, 56], and histone proteins[51, 57]) in our analyses since these two structural molecules highly impact gene expression.
Chapter 3
Related Work
In this chapter, we describe related methods from the literature.
3.1
DAWN
One of the network based gene discovery algorithms in the literature is Detecting Association With Networks (DAWN) [31]. As a Hidden Markov Random Field (HMRF) based model, DAWN consists of three stages: Partial Neighborhood Selection (PNS), HMRF parameter estimation and Bayesian FDR correction. To increase the power of HMRF, the adjacency matrix of the network should be as precise as possible. Due to the the high dimensionality and small sample size, computing the entire adjacency matrix becomes a challenge. PNS stage aims to decrease the size of network to overcome this challenge by screening key genes with relatively small TADA p-value and exclude ones that are not co-expressed with any other measured genes. To screen genes, PNS uses two parameters that are set depending on prior subject knowledge, problem size and computational resources. In the study, the performance of PNS is found to be stable as long as the parameters are not overly small. In the second step, HMRF parameters are estimated on the network where normalized Z-scores ofrisk and non-risk genes
are assumed to have a Gaussian mixture distribution. The mixture membership of a gene is determined by its hidden state which indicates whether it is a risk gene or not. After computing the posterior probability for a gene with HMRF, Bayesian FDR correction is applied to obtain the final risk gene set.
A major setback of DAWN is that it only uses a single network to predict risk scores which cannot utilize evolving gene-interactions over time simultane-ously. Therefore, results from two separate spatio-temporal windows, PFC3-5 and PFC4-6, among 4 brain regions and 13 neurodevelopmental periods covered by BrainSpan trascriptome dataset [58] are reported as these networks are previ-ously reported to be the most critical networks for ASD [3].
3.2
DAMAGES
Disease-associated mutation analysis using gene expression signatures (DAM-AGES) analysis is proposed to investigate autism-susceptibility genes by using cell-type specific gene expression profiles [59]. The study uses gene expression data from central nervous system cells of 24 mice, coming from 6 brain regions where 76% of the genes within the database are orthologous to human genes. Instead of building a co-expression network, the gene expression levels in this set are directly used. For each gene in the set, DAMAGES score (D-score) is cal-culated by adding a constant to the log2-transformed intensity vector of a gene projected onto second principal component which has the highest contribution to prediction according to the lasso analysis on principal components. The constant to be added is determined by leave-one-out cross validation.
To obtain the final scoring, DAMAGES combines D-score with Exome Ag-gregation Consortium (ExAC) metrics by using them as features (Xi) to train a
logistic regression model. After estimating the effect size (βi) for each feature by
each gene, i, is calculated as follows:
S = 1
[1 + e−(β0+PlβiXi)] (3.1)
3.3
SVM Based Genome-wide Risk Prediction
for ASD
One of the state-of-art methods for gene risk assessment is an evidence weighted support vector machine (SVM) based algorithm proposed by Krishnan et al. [32]. Initially, they integrate thousands of large-scale genomic data using a regularized Bayesian approach to obtain the gene interaction network. This network is stored as a weighted edge matrix X, where .Xij is the naive Bayes functional-relationship
posterior probability of genes i and j participating in the same pathway in the brain. The matrix is used to train the SVM classifier to predict autism-association genes. Due to the small number of labeled genes, they use 5-fold cross validation on labeled genes. Given network features Xi and label yi or all the training genes,
the linear SVM solves the following optimization problem:
minw 1 2w Tw + m X i=1 li· max(0, 1 − yiwTw)2 (3.2)
In this equation, m is the number of training samples which is 20% of all labeled genes and li is the penalty parameter that represents how costly it is to
misclassify gene i. In the study, li is set to be equal to the evidence-weight of the
labeled gene which is determined by combining information from various sources. This method does not provide direct information on which development pe-riods or time windows are more informative for ASD risk prediction. However, Krishnan et al. analyzes the enrichment of genes in spatio-temporal brain win-dows and resulting heatmap suggest that genes associated with ASD are more active during early fetal to midfetal periods in almost all brain regions.
3.4
ST-Steiner
ST-Steiner is an algorithm based on prize collecting Steiner trees that tries to utilize evolving gene-interactions over time [23]. ST-Steiner uses a cascade of networks representing spatio-temporal windows of neurodevelopment which are referred as plates. Plate 1 is the precursor network and represents the early fetal time window in development whereas Plate 2 represents the mid-fetal period in general.
ST-Steiner considers a spatio-temporal system G = G1, G2, . . . , GT, a list of
T consecutive time windows. Given a spatio-temporal system G, the problem is finding a minimum spatio-temporal sub-system F = F 1, F 2, . . . , F T by optimiz-ing the followoptimiz-ing equation.
oF(F ) = X e∈EF c(e) + β X v /∈VF p(v) + ωκF, β ≥ 0, ω ≥ 0 (3.3)
In this equation, β is a sparsity parameter to adjust trade-off between node prizes and edge costs, p(v) is the prize function for nodes and c(e) is the cost function for edges. κF ∈ N is the number of connected trees in the subgraph F
and ω is a parameter corresponding penalty. In this setup, the subgraph found in Plate 2 is affected by its precursor as the artificial prize function of a node in Plate 2 is changed depending on whether the same node is included in the subgraph for Plate 1. Although ST-Steiner can model the development of brain with this approach, it does not give a genome-wide ranking since it only provides the optimized subgraph. Also, the method does not have a straight forward policy for the size of this subgraph and the experiments for pruning or extending the graph may be costly and impractical.
3.5
DeepASD
Deep Autism Spectrum Disorder algorithm (DeepASD), proposed by [60], is a deep learning model that prioritizes ASD risk genes and learns important neu-rodevelopmental periods by processing both mutational burden and gene co-expression networks. DeepASD uses graph convolutional (GCN) layers which estimates convolutional filters to be applied on the arbitrarily structured graph data by considering the node features as signals and the filters as approxima-tions of the graph Laplacian. In this thesis, we use 52 spatio-temporal gene co-expression networks constructed from 4 brain region clusters and 15 time win-dows, as explained in Willsey et al. [3]. These are shown in TableA.2 and Table A.1. These networks are used as the input for GCN layers and the mutational burden is used as node features for these networks where each node is a gene and an edge exists between nodes if genes are coexpressed in that neurodevelop-mental window. Then, the mixture of experts (MoE) method is used to combine information from GCN layers as weak learners and produce the final output as a weighted sum of the outputs of these weak learners.
DeepASD improves the performance in terms of area under ROC curve and area under precision-recall curve distributions. In addition, the gating module inside MoE structure enables DeepASD to identify significant spatio-temporal networks during its end-to-end training period. Despite its advantages, DeepASD gives the genome-wide risk ranking for a single disorder at a time and overlooks the comorbidity of neurodevelopmental disorders and the information coming from their shared genetic architectures.
Chapter 4
Methods
This section contains the description of our multitask risk assessment model for comorbid neurodevelopmental diseases.
4.1
Problem Description
In this study, we propose a multitask learning pipeline for comorbid neurodevel-opmental disease to capture shared genetic architecture and increase prediction power for risk assessment. Let the graph representations of each 52 gene co-expression network j be Gj = (V, Ej) where vertices V = (v1, ..., vn) corresponds
to genes in human genome and Ej ∈ {0, 1}n×n is the binary adjacency matrix.
Then, let XD ∈ Rn×d as the feature matrix for disorder D where each row XD[i]
is a list of d features associated with gene and node i, ∀i ∈ [1, n]. Consider two vectors, yASD and yID, of dimension l and m respectively. yASD[i] = 1 if the node
i is a risk gene for ASD and yASD[i] = 0 if the node corresponds to a non-mental
health related gene ∀i ∈ [1, l], l < n. yID is defined similarly where yID[i] is
either 1 or 0 ∀i ∈ [1, m], m < n. In our semi-supervised learning task, our goal is to learn a function f (XASD, XID, yASD, yID, G1, ..., G52) → P ∈ Rn×2 where
4.2
DeepASD
Here, we describe the technical details of the DeepASD method which is an important building block in DeepND architecture [60].
4.2.1
Graph Convolutional Network Model
One of the revolutionary architectures in machine learning and computer vision fields are Convolutional Neural Networks (CNNs). They are widely used on grid-structured n-dimensional regular signals, such as images, to extract local patterns [61]. While applications of the same principle on arbitrarily structured graph data have also improved the state-of-the art [62, 63, 64], these spectral approaches are computationally expensive. DeepASD uses graph convolutional networks (GCNs) proposed by Kipf and Welling as a solution to the excessive computational requirement of previous methods [65]. GCNs approximates the filters in the regular convolution operation as a Chebyshev expansion of the graph Laplacian [66] and let them operate on the 1-hop neighborhood of each node by limiting the order of Chebyshev polynomials in the expansion. GCN modules in DeepASD inputs the normalized adjacency matrix ˆEj with self loops (i.e.,
ˆ
Ej[i, i] = 1, ∀i ∈ [1, n]) of gene co-expression network Gj and the feature vector
XD[i], for gene i and for disorder D. Then, each subsequent layer k of a GCN
module is defined as:
Hk[i] = ReLU ( ˆD−0.5E ˆˆD−0.5Hk−1[i]Wk−1) (4.1)
where W0 is the weight matrix at the input layer to be learnt, H0 is the feature
vector XD, ReLU is the rectified linear unit function and ˆD is the normalized
version of a diagonal matrix where ˆDii = PjEˆij. In DeepASD, 2 GCN layers
are stacked with embedding dimensions d1 = 4 and d2 = 1. The final layer uses
softmax as the activation function that outputs probabilities for positive class. The final output of a GCN module j for a gene i is given as:
4.2.2
Mixture of Experts Model
In order to combine the information from 52 GNC modules, DeepASD uses the mixture of experts model (MoE) which is used to determine informative models among a collection [67]. MoE module for disease D inputs the feature vector XD and consider 52 GCN modules which act on gene co-expression networks
(G1, · · · , G52) as individual experts. For every gene i, MoE produces a vector w
of length 52 by which GCNs are weighted after it is passed through a softmax layer (i.e., P52
h=1wi[h] = 1). Then, the weighted sum of expert results are used
to assign the final risk probability for every gene i using softmax. That is, the M oE(XD[i]) = wi ∈ R52 and the final risk probability of gene i for disorder D is
found by wi· vi = P [i][D].
4.3
Proposed Algorithm
4.3.1
Multitask Learning Model
Above-mentioned GCN and MoE cascade inputs XD[i] and co-expression
net-works G1, .., G52along with labels for a single disorder to predict the risk
probabil-ity for every gene. We hypothesize that analyzing comorbid neurodevelopmental disorders simultaneously can increases the prediction power since the prediction for the disorders depend on each other’s genetic architecture. To analyze multiple disorders simultaneously, we propose a pipeline that utilizes multitask learning (MTL). In MTL paradigm, the algorithm first learns a shared component for all task at hand and then also focuses on specific tasks. Learning the shared component has shown to boost the performance in various tasks such as lan-guage and image processing [68, 69]. Our proposed algorithm, DeepND uses the MTL paradigm where multiple tasks are solved concurrently (i.e., genome wide risk assessments for ASD and ID.) The system figure of the proposed method is described in Figure 4.1
Figure 4.1: System model of the proposed deep learning architecture for genome-wide cross-disorder risk assessment (DeepND). The features are passed through fully-connected multitask layer that learn shared weights for both disorders and produces a new feature representation. This new representation is then input to singletask GCNs, each processing one of fifty-two gene co-expression networks that represent different brain regions and neurodevelopmental time windows. The output of GCNs are then weighted by the Gating Network to learn which networks are informative for the gene risk assessment for each disorder’s etiology. The final output is a genome-wide risk probability ranking per disorder, which are then used for various downstream analyses to understand the underlying functional mechanisms and to compare/contrast both disorders. The singletask layers are exclusively trained with the ground truth genes of the disorder they belong. Thus, they learn only disorder specific parameters and disorder-specific networks that implicate risk.
DeepND employs one DeepASD cascade per disorder and puts a multi-layer perceptron (MLP) as a precursor to two DeepASD subnetworks. The weights learnt on these subnetworks are only affected by the back-propagated loss of the corresponding disorder, and hence, these are single task parts of the architecture. On the contrary, the weights learnt on the MLP part are affected by the loss back-propagated from both subnetworks. Thus, this part corresponds to the multitask component of the DeepND architecture. The MLP layer inputs the union of XASD and XID and passes it through a fully connected layer followed by Leaky
ReLU activation (negative slope = −1.5) to learn a weight matrix WM LP and
output a d0 dimensional embedding to be input DeepASD instead of XASD[i] and
XID[i]. The function learned by MLP module is defined as:
M LP (XASD[i] ∪ XID[i]) = LRELU (WM LP| · (XASD[i] ∪ XID[i]) + bM LP) (4.3)
4.4
Experimental Setup
4.4.1
Ground Truth Risk Gene Sets
DeepND is based on a semi-supervised learning framework in which only a subset of the samples are labeled as either positive or negative. The algorithm uses a different gold set for each disorder considered. For ASD, the ground truth set from Krishnan et al. [32] is used. The ASD related genes are collected from various sources and classified into four evidence levels (E1-E4, E1 indicating the highest risk). The final risk contains 46 E1, 67 E2 and 525 E3 and E4 genes as positively labeled ASD-risk genes. The negative set 1185 non-mental health related genes from Krishnan et al. [32]. In Table A.3 and A.4, the final positive and negative gold standards for ASD are presented.
For ID, we have curated a positive gold set from various review studies from the literature as the provide in depth analyses of ID risk genes. The base set contains known gene ID risk genes from 2 landmark reviews [10, 70] and these genes are divided into evidence level according considering information from 3
other studies [71, 72, 73] where the genes marked as ID risk gene by all 5 studies are assigned as E1 genes and the genes marked as ID risk gene by 4 studies are assigned as E2 genes. The negative gene set is kept the same as ASD as they are non-mental health related genes. However, the overlapping genes within E1 and E2 are discarded from the negative set. The final list contains 56 E1, 131 E2 and 1074 negative genes for ID. In Table A.5 and A.6, the final positive and negative gold standards for ASD are presented.
The weighted losses for both disorders are calculated according to the following weights: E1 genes (1.0), E2 genes (0.50), E3-E4 genes (0.25) and negative genes (1.0). The validation and test performance are evaluated and reported only on E1 genes.
4.4.2
Gene Features
Each branch (subnetwork) of DeepND uses the mutation burden information for related disease as the node features for 52 GCN modules. For ASD branch, the mutational burden from the largest whole exome study to date is used to generate features [29]. The feature matrix for ASD, XASD ∈ Rn×d where n = 25, 825 and
d = 17 contains the following information from multiple case-control studies: (i) the number of de novo loss of function mutations, (ii) the number of damaging missense loss of function mutations, (iii) the number of protein protein truncating variants (PTVs) for ASD case and control groups, (iv) the number of transmitted loss of function mutations, (v) the number of de novo protein truncating variants (PTVs) and missense mutations in published ASD probands, (vi) frequency of de novo variants in ASD individuals, and (Vii) pLI of the gene.
For ID branch, a similar set is obtained from [26]. The feature matrix for ID, XID ∈ Rn×d where n = 25, 825 and d = 8 contains the following features for each
gene i, ∀i ∈ [1, n]: (i) the number of de novo loss of function mutations, (ii) the number of damaging missense loss of function mutations, (iii) extTADA Bayes factor which is calculated using an extension of TADA, (iv) the number of de novo PTVs and missense mutations in published ID/DD (developmental delay)
probands, (v) frequency of de novo variants in ID/DD individuals, and (Vi) pLI of the gene.
The MLP architecture which facilitates information sharing between two dis-orders uses the union of these two feature sets for each gene i, ∀i ∈ [1, n] as its input.
4.4.3
Spatio-Temporal Gene Co-expression Networks
BrainSpan dataset of Allen Brain Atlas [74, 58] contains gene expression levels in samples from 16 regions of 57 postmortem brains that span 15 consecutive neu-rodevelopmental period from 8 post-conception weeks to 40 years. We constructed 52 spatio-temporal networks by partitioning the the dataset into developmental periods and clusters of brain regions as explained in Willsey et al. [3]. Brain regions clusters and development windows are given in Table A.1 and Table A.2. Each spatio-temporal windows contains three consecutive time periods as shown in Figure 5.4. Consider the graph representations of a gene co-expression net-work, G = (V, E) where vertices V = (v1, ..., vn) corresponds to genes in human
genome and E ∈ {0, 1}n×n is the binary adjacency matrix. For two genes i and j, ∀i, j ∈ [1, n] where n = 25, 825, Eij = Eji = 1 if their absolute Pearson
corre-lation coefficient |rij| is greater or equal to 0.8 in the related partition of the data
set.
4.4.4
Learning
and
the
Cross
Validation
Setting
of
DeepND
We use a five-fold cross-validation scheme where all labeled genes are uniformly and randomly distributed to the folds. At each training session, one fold for vali-dation and one fold for testing are left out and the remaining three folds are used for training. The model uses categorical cross entropy loss (evidence weighted) which is compatible with binary-classification nature of the problem. The model
weights are initialized using Xavier initialization [75] to avoid vanishing gradi-ents problem which is a concern for multi layer neural network models such as DeepND. All weights are updated by ADAM optimizer [76] up to 1000 epochs with early stop which is determined with respect to the loss calculated on the validation fold using only E1 genes as the positives and all negative genes. The ADAM optimizer provides a faster learning as it uses first and second moments to calculate the step direction on the hyperplane defined by high dimensional loss function.
DeepND uses the learning rates of 7 × 10⁻⁴, 7 × 10⁻⁴ and 7 × 10⁻³, for the shared layer, ASD single task layer, and ID single task layer, respectively. To ensure proper and balanced convergence of DeepND, an overfit flag for each single task module is assigned and tracked. Once a flag for a single task module is set, meaning that the subnetwork is converged, the layers of that subnetwork and the shared layer are frozen. This lets the yet underfit subnetwork to keep learning till its own overfit flag is set or the epoch limit is reached. Once both overfit flags are set, i.e. the model converges, the test performance is reported on the test fold in the same manner as in the validation fold.
Following the procedure which is mentioned above, 4 results are reported as for every left-out test fold. This process is repeated 10 times with random ini-tialization and a total of 200 results are used for performance comparison.
4.4.5
Computational Unit
All experiments for DeepND are run on a SuperMicro SuperServer 4029GP-TRT with 2 Intel Xeon Gold 6140 Processors (2.3GHz, 24.75M cache), 251GB RAM, 6 NVIDIA GeForce RTX 2080 Ti (11GB, 352Bit) and 2 NVIDIA TITAN RTX GPUs (24GB, 384Bit). For all training and testing, we used 5 RTX 2080 and 1 TITAN RTX cards and the cross validation setup took approximately 16 hours.
Chapter 5
Results
5.1
Genome-wide Risk Predictions for ASD and
ID
Our results show that the genome-wide risk assessment of DeepND is robust, precise and sensitive and substantially improves the state of the art both in terms of performance and interpretability of the predictions.
We benchmark the performances of DeepND and other gene discovery algo-rithms for neurodevelopmental disorders. First, we compare DeepND and the state of the art algorithm by Krishnan et al. using their experimental set-tings. To quantify the contribution of the co-analyzing comorbid disorders (i.e., multitask) as opposed to individual analysis (i.e., singletask), we also compare our results with DeepASD. Evaluating performances of the algorithms using E1 genes through 5-fold cross shows that DeepND achieves a median AUC of 92% (Wilcoxon rank-sum test, P = 1 × 10⁶) and a median AUPR of 66% (Wilcoxon
rank-sum test, P = 1 × 10⁶) for ASD, which correspond to 2% and 30%
improve-ments over the evidence weighted SVM algorithm of Krishnan et al., respectively (Figures 5.1). Similarly for ID, DeepND achieves a median AUC of 81% and a median AUPR of 35%, which improves the state of the art by 9% and 18%,
Figure 5.1: (A) The area under the receiver operating characteristic curve (ROC AUC) distribution of 200 results for DeepND, DeepASD and Krishnan et al. (B) The area under precision-recall curve (AUPRC) distributions for the same methods as in (A)
respectively. As expected, the multitask setting of DeepND performs better than DeepASD and leads to improved AUC (up to 1.4%) and AUPR (up to 5%) for both disorders.
We also compare DeepND and Krishnan et al.’s approach gene-by-gene for both disorders. Figure 5.2C shows the probabilities assigned to each gene (red: E1 genes; black: non-mental health genes; and grey: all other genes). The better performing algorithm would have the E1 genes on its own side of the diagonal (i.e., relatively higher risk probability assigned) and have the black genes on the other side (i.e., relatively lower risk probability assigned). We observe that DeepND consistently assigns higher probabilities to E1 genes and lower probabil-ities to non-mental health relate genes and thus, provides a better risk assessment (Wilcoxon Rank Sum test, DeepND ASD P = 3.35 × 10⁻²², DeepND ID P = 5.07 × 10⁻¹⁹, Krishnan et al. ASD P = 5.07 × 10⁻²⁰ and Krishnan et al. ID P = 7.12 × 10⁻⁹).
Finally, we compare DeepND, DeepASD and Krishnan et al. with other neu-rodevelopmental disorder gene discovery algorithms from the literature that had output a genome-wide risk ranking: DAWN [31] and DAMAGES [59]. We com-pare them using precision-recall (PR) curves over the final genome-wide predic-tions of all methods. We consider 2 scenarios, where in the first one E1 genes are considered as true risk genes and in the second both E1 and E2 genes are consid-ered as the ground truth. (Figure 5.3). For both disorders, DeepND consistently performs better than others.
5.2
Critical Neurodevelopmental Windows for
ASD and ID
To further investigate the shared genetic component between ASD and ID, we fo-cus on the spatio-temporal neurodevelopmental windows that are found to be important by DeepND for accurate ranking of risk genes for both disorders.
Figure 5.2: Scatter plots that presents assigned probabilities for each gene by DeepND and et al. for ASD (A) and ID (B). Red: E1 genes; Black: Non-mental-health disease genes; and Grey: all other genes. A better assessment method would have the E1 genes towards its side of the diagonal and have the black genes on the other side of the diagonal.
Figure 5.3: Precision - Recall curves to compare DeepND, DeepND - ST, Evidence weighted SVM of Krishnan et al., DAWN, and DAMAGES score of Zhang and Shen. Results for ASD (A & B) and ID (C & D) shown when (i) E1 genes are used as the true risk genes and (ii) E1+E2 genes are considered as the true risk genes.
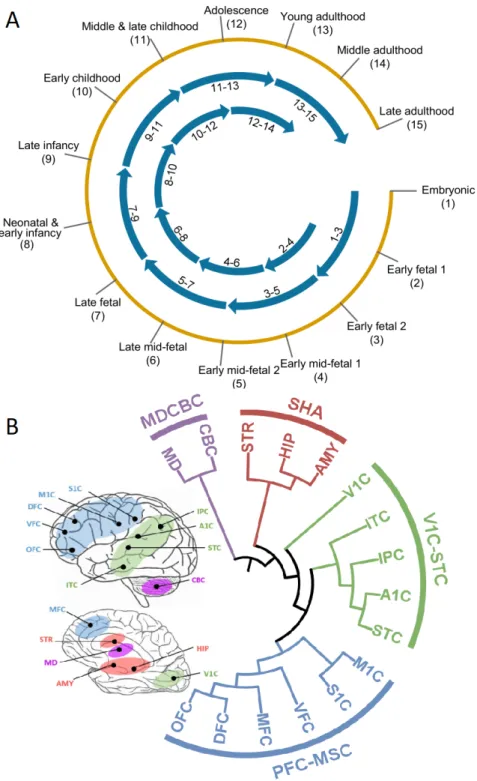
Our method analyzes co-expression networks that represent 13 neurodevelop-mental time windows (from embryonic period to late adulthood; Figure 5.4) and 4 brain region clusters (PFC-MSC: Prefrontal and motor-somatosensory cortex; MDCBC: Mediodorsal nucleus of the thalamus and cerebellar cortex; V1C-STC: Primary visual and superior temporal cortex; SHA: Striatum, Hippocampus, Amygdala) generated using Brainspan RNA-Seq dataset [58] in accordance with Willsey et al. [3] (Figure 5.4).
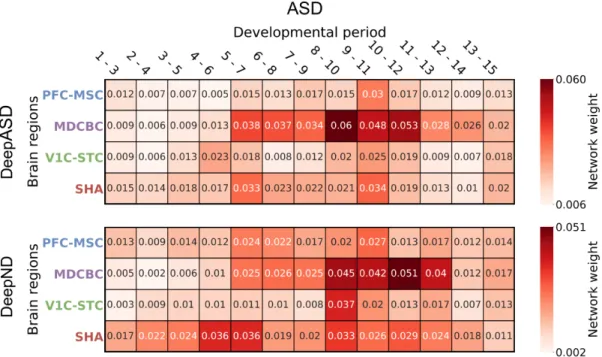
We investigate which neurodevelopmental windows more confidently distin-guish disorder risk genes. Figure 5.5 and Figure 5.6 show normalized average probabilities assigned to top percentile risk genes for ASD and ID, respectively. For each gene i, the average risk probability assigned by the corresponding GCN is calculated considering all iterations where gene i is in the test fold. Results of DeepASD shows that the networks of the MDCBC brain region, spanning several time windows from late/late-mid fetal to young adulthood (9-11) periods consis-tently are better predictors for ASD and ID risk. This is inline with the fact that ID or ASD linked genes are highly expressed during prenatal and early postnatal time windows in development [77, 78]. The period 8-10 (from neonatal and early infancy to early childhood) was also previously indicated as one of the highest risk regions and was subject to network analyses for ASD gene discovery [3, 31]. Prefrontal cortex mid-fetal (PFC-MSC 3-5) window was another region deemed important in the same study for ASD, but no such significant signal is picked up by DeepASD. Overall, we observe that earlier time windows are relatively more important for ID compared to ASD.
To compare the effect of co-analyzing comorbid disorders, we compare the results from DeepND and DeepASD for both disorders. In the multitask setting of DeepND, the change in the informativeness of networks for ASD is subtle compared to the singletask setting. For ID, we see a more scattered picture and a more diverse set of networks are more informative when cross-talk among ID and ASD genes are considered. This is also evident in the higher prediction performance gain in ID compared to ASD (Figure 5.1). Although the later periods become more informative, MDCBC infancy - childhood region is still one of the most important windows.
Figure 5.4: Neuroevelopmental windows (A) and brain regions clusters (B) used for generating co-expression networks from Brainspan RNA-Seq dataset
Figure 5.5: Normalized average probabilities assigned to top percentile risk genes by DeepASD (top) and DeepND (bottom) for ASD
Figure 5.6: Normalized average probabilities assigned to top percentile risk genes by DeepASD (top) and DeepND (bottom) for ID
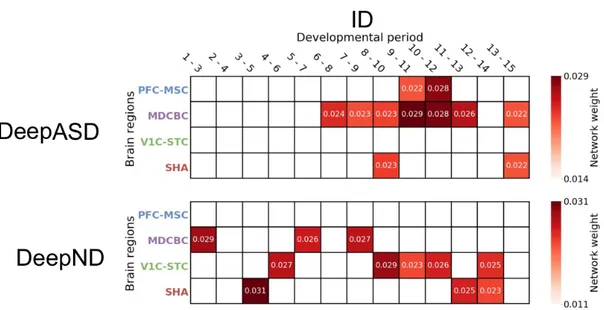
Using the MoE model, DeepND architecture associates a weight with each network which is proportional to its informativeness for the ranking task at hand. Assigned weights for each network for ASD and ID are shown in Figure 5.7 and Figure 5.8 respectively. It is observed that MDCBC late/late-mid fetal to late childhood/adolescence periods are consistently selected to be highly informative as these periods are associated with high weights. MDCBC 9-11 window is the top in 3 out of 4 analyses indicating that this spatio-temporal window is critical for the etiology of both disorders.
MDCBC 2-4 and MDCBC 9-11 networks which are marked as weakest and strongest sources of information by DeepND are visualized in Figure 5.9 and 5.10. There are roughly 12.5k links between top percentile ASD and ID genes in MDCBC 2-4 network, although the network contains close to 37.5m links in total. On the other hand, MDCBC 9-11 contains close to 13m edges. Yet, there exists close to 30k links between top percentile ASD and ID genes which is the reason behind DeepND focusing on this window as its top predictor.
5.3
Enrichment Analysis of the Predicted Risk
Genes
We also analyze enrichment of the ASD and ID risk gene rankings in gene sets which are previously shown to be related to these disorders. Enrichment of mem-ber genes of these gene lists in higher deciles of the genome-wide ranking given by DeepND indicates the wellness of the predicted ranking. These gene sets consist of (i) targets of transcription regulators (CHD8 [48], FMRP [49, 50, 51], RBFOX [52, 53, 51] and TOP1 [54]); (ii) Susceptibility pathways (WNT signaling [46] and MAPK signaling [47]); and (iii) affected biological processes and molecular functions ( post-synaptic density complex [55, 56], histone modification [51, 57]). Figure 5.11 shows the enrichment of ASD and ID risk rankings in mentioned gene sets. We observe a similar trend for top decile ASD and ID genes such that
Figure 5.7: Heapmap shows average weights assigned by MoE module of Deep-ASD (top) and DeepND (bottom) to each spatio-temporal window for the top percentile genes for ASD.
Figure 5.8: Heapmap shows average weights assigned by MoE module of Deep-ASD (top) and DeepND (bottom) to each spatio-temporal window for the top percentile genes for ID.
Figure 5.9: The summary of co-expression relationship between top percentile genes in each disorder on MDCBC2-4 network which is observed to be the weakest source of information. Although the full MDCBC2-4 network has 37.5m edges, only approximately 12.5k of them are between top percentile risk genes.
Figure 5.10: The summary of co-expression relationship between top percentile genes in each disorder on MDCBC9-11 network. The full MDCBC network con-tains 13m edges and 30k of them are between top percentile risk genes. The ratio of links between top percentile genes to total edges also indicate the importance of MDCBC9-11 for both disorders’ ethiologies.
the top decile risk genes for both disorders have the highest enrichment in all categories. All enrichments for ASD are shown to be significant with respect to Binomial test, while the P values for ID are more subtle. For example, the fifth decile of the ID risk ranking is the most enriched set among the CHD8 targets and the distribution into deciles is not significant (Binomial test, P = 5.9 × 10⁻²). On the other hand, CHD8 (Chromodomain Helicase DNA Binding Protein 8) is the highest ASD-risk gene known to date with the highest mutation burden in large ASD cohorts [51, 29] and with downstream functional analysis [48]. Accordingly, DeepND ranks CHD8 as the third top risk gene whereas Krishnan et al. ranks it 1943th genome-wide. While it has a solid association to ASD etiology, the ties to
ID is not well-established. Bernier et al. reports that 9 out of 15 ASD probands with mutations in CHD8 also has ID. While it is a comorbid condition to ASD, CHD8 is not a well-established susceptibility gene for ID. Lower enrichment of ID genes in CHD8 targets is in line with this hypothesis. In accordance, DeepND places CHD8 as the 150th highest risk gene for ID.
Another analysis regarding enrichment of genes is performed using Enrichr [79, 80] system for the top percentile risk genes. Enrichr is a platform that contains a large collection of diverse gene set libraries available and enables untargeted enrichment analysis in these gene sets. We find that regulation of transcription from RNA polymerase II promoter is the top enriched Biological Process GO term (Fisher’s exact test, P = 6.4 × 10⁻¹⁹ for ASD and P = 6.1 × 10⁻¹³ for ID) which indicates that transcriptional regulation is a shared function that is disrupted in the etiology of both disorders. As for the Gene Ontlogy (GO) Molecular Function enrichment where genes are assigned to a set of predefined bins based on their functional characteristics, two disorders diverge in the mechanism: the top function affected for ASD is RNA polymerase II transcription co-factor activity whereas for ID the top affected function is histone-lysine N-methyltransferase activity. As the top predicted genes are responsible for regulating gene activity, we further investigate if there are any master transcription regulators upstream that regulate the high risk genes for ASD and ID in the ChEA Database [81]. We find that DMRT1 is the top transcription factor with 77 of its targets coincide with 258 the top percentile DeepND predicted ASD risk genes (Chi-Square test,
Figure 5.11: The enrichment of DeepND ASD and ID rankings in various disease related gene sets is given in each panel. The horizontal axis shows the percentage of genes in the corresponding gene set. The results for genome-wide risk ranking for ASD and ID are shown in blue and yellow respectively. The considered gene sets are as follows: (i) Targets of RBFOX (splice), (ii) Targets of RBFOX (splice target), (iii) Targets of FMRP (all peak), (iv) Targets of CHD8, (v) Targets of TOP1, (vi) WNT Pathway, (vii) MAPK Signaling Pathway, (viii) GTPase regulator activity, (x) Postsynaptic density complex genes, (xi) Synaptic genes (xii) Histone modifier genes.
P = 2.84 × 10⁻¹⁸). It is the top third regulator for ID by regulating 46 of 258 top percentile ID risk genes (Chi-Square test, P = 1.74 × 10⁻⁴), 22 targets are shared among ASD and ID. Note that only 69 genes overlap in top percentile ASD and ID risk genes. This means 30% of the shared set of genes among two disorders are targeted by DMRT1. When the union set of the top percentile genes for ASD and ID are considered (447 genes), we find that the top transcription factor targeting these is again DMRT1 (105 out of 2071 targets; Chi-Square test, P = 2.33 × 10⁻¹⁵).
While DM RT 1 is not ranked as a high risk gene, Pinto et al. report a rare experimentally-validated de novo CNV (deletion) in an ASD proband which en-compasses 9p24.34-p24.2 and DM RT 1 [47]. DM RT 1 is in the 9p region with the following genes: DOCK8, DM RT 2, DM RT 3, V LDLR, and AN KRD15 and several works indicate that mutations affecting these these genes might be related to neurodevelopmental disorders [82, 83, 84, 85]. DMRT1 is a transcriptional regulator and plays role in male sex determination. This finding suggests an in-teresting link between DMRT1 and the strong male bias in ASD [?] and ID [?, ?] prevalence.
5.4
Regulatory Interactions between ASD and
ID Genes
The union of top percentile genes for ASD and ID contains 447 genes. We fur-ther investigate the existence of regulatory relation between these genes by using ChEA Database [81]. 25 of the common top percentile genes are found on this database as transcription factors (TF) with experimental target information (per-mutation test, P < 1 × 10⁻³). 9 of these 25 TFs are ASD-only risk genes whereas 9 of them ID-only and remaining 7 are both ASD and ID risk genes. Using a stringent matched randomization method based on mutation rate, pLI and gene length, we generate 1000 random gene sets for all 3 categories such that the set sizes are preserved and the original TFs are included in their relative risk gene
sets. The strongest connection among these gene sets is observed between ASD-only and ASD and ID gene sets both ways. TFs in both groups regulate each other significantly (permutation test - 1000 draws, P < 1 × 10⁻³; Figure 5.12). While TFs in ASD-only set regulate the genes in its group more frequently than expected by change, the significance is lower (permutation test - 1000 draws, P = 3.1 × 10⁻²). The same is true for TFs in ASD & ID set (permutation test, P = 3.8 × 10⁻²). This is in striking contrast with the relationships between ASD-only/ASD & ID TFs and ID-only risk genes. The strength of the connectivity is significantly less than expected (permutation test, P < 1 × 10⁻³). Similarly, TFs in the ID-only risk set do not significantly interact with other groups.
We further investigate the protein-protein interactions (PPI) between the top percentile risk genes in tissue specific PPI network for frontal cortex obtained from DifferentialNet database [1] using the NetworkAnalyst system [86]. This analysis reveals several hub proteins such as HECW2, EP300, CUL3, and CTTNB1 as shown in Figure 5.12. In this list, HECW 2 gene stands out as it has the highest degree in this network and has very low prior risk for both ASD (TADA P = 0.95) and ID (extTADA Q = 0.97). Yet, it is the top 4th ID risk gene identified
by DeepND and in the top percentile for ASD risk. Note that DeepND did not use any PPI network information in its reasoning, and yet, was able to identify this hub protein which has been linked with ASD [87] and ID [88] via de novo disruptive mutations in simplex families.
5.5
Identification of Novel Candidates within
ASD and ID Associated with CNV Regions
We investigate the DeepND risk ranking within (i) six regions which frequently harbor ASD-related CNVs (16p11.2, 15q11-13, 15q13.3, 1q21.1 and 22q11) [32], and (ii) six regions which were reported to harbor mental retardation related CNVs (16p11.2, 1q21.1, 22q11.21, 22q11.22, 16p13 and 17p11.2) [89]. In addi-tion to supporting the linkage of previously reported confident genes, such as
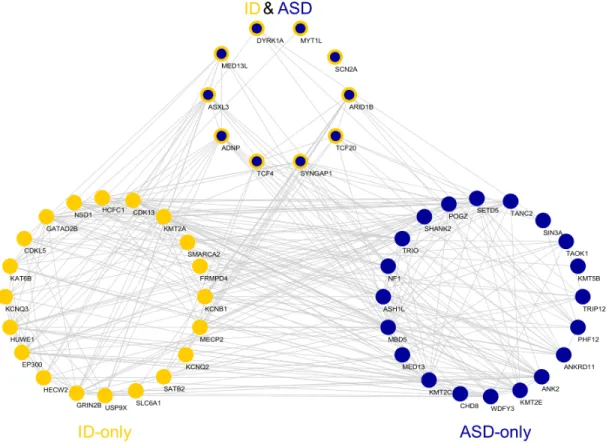
Figure 5.12: Network Analyses of the risk genes. (a) The co-expression relation-ships between top 30 ASD and ID risk genes in MDCBC 9-11 region. Only links for at least 0.95 absolute correlation and genes with at least one connection are shown. (b) The protein-protein interactions between the top percentile risk genes are shown. The PPIs are obtained from the tissue specific PPI network of frontal cortex in DifferentialNet database [1]. (c) The regulatory relationships between the top percentile ASD-only and ID-only risk genes in the ChEA transcription factor regulation database are shown. 69 genes are ranked in the top percentile for both disorders. Red arrows indicate that the TFs in the source has more targets than expected by chance in the target group. Cobalt blue arrows indicate that the TFs in the source has less targets than expected by chance in the target group and aegean blue arrows indicate expected connectivity.
CREBBP, ARID1B, CUX2 and FOXP1 to autism and intellectual disability, risk ranking of DeepND indicates several new candidate pathogenic genes for ASD and ID located in CNV regions under analysis. DeepND ranking of some selected genes located in these CNV regions are shown in Table A.7 to A.14.
One of the genes located in 16p11.2 as given in Table A.7 and ranked in 1st percentile by DeepND with TADA Q = 0.55, SRCAP, is known to be included in Wnt signaling pathway [90] which is linked to ASD by its functional role in the dysregulation of excitatory/inhibitory neuronal activity [91]. With its multitask nature, DeepND suggests that SRCAP is also an important candidate for ID by ranking it in top 1st percentile for ID. Another gene in importin beta family, XPO6, suggest a new linkage between 16p11.2 and autism as it is related to Arts syndrome according to evidence from [92].
DeepND also highly ranks several genes with low prior risk and low posterior risk assigned by other methods within these CNV regions.GABRG3 is one of such genes with low prior risk (TADA P = 0.75) located in 15p11-13 as shown in Table A.8. Despite being an E3-E4 level risk gene for ASD, it does not participate any relevant gene set. Although none of the other algorithms rank it in the top thousand (Krishnan et al., 1297th, DAWN 3257th, DAMAGES score 1472nd),
DeepND ranks GABRG3 within top percentile (250th) for ASD.
Similar to GABRG3, MICAL3, a gene related to actin and Rab GTPase bind-ing, ranked in as the 352nd for ASD risk despite having TADA Q = 0.77 and not
being in relevant risk gene groups. Krishnan et al. rank it 3165thand DAMAGES
score ranks it 1916th as DAWN provides no ranking since it is not co-expressed
with any other gene in networks of interest for DAWN. While disruption in Rab GTPase cycle gene could lead intellectual disability [93], there are no established ties between MICAL3 and ASD or ID. However, MICAL family genes are re-lated to cytoskeletal organization which recently has been deemed an important molecular function in ASD etiology [29, 23]. Another gene from the same family, MICAL2, is an ASD-risk gene and also ranked in the top percentile by DeepND since it utilizes multiple co-expression networks concurrently and is able to cap-ture the link between MICAL2 and MICAL3 in 7 networks spanning late fetal
to adolescence in SHA and V1C-STC regions. This enables DeepND to predict it as a risk gene in a relevant CNV region (22q11, shown in Table A.11).
FOXO3B is located in 17p11.2 (Table A.13) which is one of the ID related CNV regions. While this gene does not even have a prior TADA score in Nguyen et al. [26], DeepND marks it as the 57th risk gene. Deletion of FOXO
tran-scription factors is shown to cause axonal degeneration and elevated mTORC1 activity [94] which was previously associated with several neurological and neu-rodevelopmental disorders including autism and epilepsy. Krishnan et al. ranks this gene in the fifth decile and DAWN cannot capture it due to lack of corre-lation in prefrontal cortex during mid-fetal period. Interestingly, all discussed genes, GABRG3, MICAL3 and FOXO3B have similar RNA expression patterns in brain. The RNA expression patterns of these genes are shown in Figure 5.13. All genes are either most expressed or second most expressed in cerebral cortex and have significant expression levels in several other brain regions and major endocrine glands [2].
5.6
Evaluation of Novel Predictions
While it is always important to classify ground truth samples correctly in machine learning, it is also interesting to investigate false positives and false negatives since it can highlight the specificity and explain a different aspect of the problem, such as overlapping relation between many neurodevelopmental disorders. As a result, we also focus on the most confident predictions of DeepND which are clashing with the current consensus in our analyses.
One of E1 risk genes for ASD, SLC9A9, is a sodium/hydrogen exchange pro-tein. Although it has a record of rare variants in ASD cohort, it is ranked in the last decile by DeepASD [60] as other algorithms rank it in the fifth decile at the lowest. The protein and RNA expressions of SLC9A9 are enriched most in the spinal cord, as shown in Figure 5.14, which suggest that it is unlikely for this gene to be an ASD risk candidate. DeepND also ranks this gene in the last decile which
Figure 5.13: Median RNA expression patterns of GABRG3 (top), MICAL3 (bottom-left) and FOXO3B (bottom-right) across various tissues in the GTEx dataset [2] (transcripts per million).