APPLICATION OF FUZZY TOPSIS METHOD AND DOPGA ALGORITHM IN PURCHASING DECISION PROCESS: 3D TELEVISION EXAMPLE
Engin Ufuk ERGUL
Amasya University, Faculty of Technology, Department of Electrical and Electronics Engineering, 05100, Amasya, Turkey
(Geliş/Received: 24.01.2018; Kabul/Accepted in Revised Form: 01.05.2018)
ABSTRACT: Nowadays, television is at the head of devices where people can have fun in their homes, and
people spend most of their time on television. So, they want to purchase a pretty good television. At the head of these televisions are three-dimension televisions (3D TVs). Since purchasing a television is a long-term shopping, it is necessary to evaluate it with great care and to determine its best before purchasing it. Evaluation of the best 3D TV is a complex problem with no definite structure and it depends on the features of the 3D TVs. There are many performance indicators as dynamic contrast ratio, refresh rate, power consumption on mode, depth, weight, cost, response time etc. affecting the decision-making process about 3D TVs. Therefore, evaluation of 3D TVs is a complex decision- making process. Hence, this problem can be solved by multi-criteria decision-making (MCDM) methods. In this paper, eight popular 3D TVs considered to be purchased in technology markets are compared by using six specifications obtained from its catalog and the experts’ opinion. In this study, in order to determine the best 3D TV, alternative 3D TVs were first sorted by using Fuzzy Techniques for Order Preference by Similarity to Ideal Solution (TOPSIS) method, and then, the sensitivity analysis was performed. Secondly, to compare the 3D TV ranking obtained from Fuzzy TOPSIS method, 3D TVs were ordered by using Domination Power of an Individual Genetic Algorithm (DOPGA) method and necessary comparisons and evaluations were made and the best 3D TV was selected. Key Words: Decision making, Evolutionary algorithms, Fuzzy TOPSIS, MCDM, Sensitivity analysis, 3D TV
Satın Alma Karar Sürecinde Bulanık Topsis Yöntemi ve Dopga Algoritmasının Uygulanması: 3D Televizyon Örneği
ÖZ: Günümüzde insanların evlerinde eğlenceli vakit geçirebilecekleri aygıtların başında televizyon
gelmektedir ve vakitlerinin çoğunu televizyon karşısında geçirmektedirler. Bu yüzden oldukça iyi bir televizyon satın almak isterler. Bu televizyonların başında üç boyutlu televizyonlar (3D TV) gelmektedir. Televizyon satın alma, uzun vadeli bir alışveriş olduğu için satın almadan önce oldukça titiz bir çalışmayla değerlendirme yapmak ve en iyisini belirlemek gerekmektedir. En iyi 3D TV’ nin değerlendirilmesi, kesin bir yapıya sahip olmayan karmaşık bir problemdir ve 3D TV’ nin özelliklerine bağlıdır. 3D TV’ nin karar verme sürecini etkileyen, dinamik karşıtlık oranı, tazeleme oranı, güç tüketimi, derinlik, ağırlık, maliyet, cevap süresi gibi birçok performans göstergesi vardır. Bu yüzden, 3D TV’ nin değerlendirilmesi karmaşık bir karar verme sürecidir. Bu nedenle, bu problem çok kriterli karar verme (ÇKKV) yöntemleri ile çözülebilir. Bu makalede, teknoloji marketlerinden satın alınması düşünülen sekiz popüler 3D TV, kataloglarından ve uzmanların görüşlerinden elde edilen altı özelliği kullanılarak kararlaştırılmıştır. En iyi 3D televizyonu belirlemek için yapılan çalışmada ilk olarak Bulanık İdeal Çözüme Benzerlikle Tercih Sıralama Tekniği
(TOPSIS) metodu uygulanarak 3D TV’ ler sıralanmış ve daha sonra duyarlılık analizi yapılmıştır. İkinci olarak, Fuzzy TOPSIS yönteminden elde edilen 3D TV sıralamasını karşılaştırmak için Bireyin Baskınlık Gücü Genetik Algoritma (DOPGA) yöntemi uygulanarak 3D TV’ ler sıralanarak gerekli karşılaştırmalar ve değerlendirmeler yapılmış ve en iyi 3D TV seçilmiştir.
Anahtar Kelimeler: Karar verme, Evrimsel algoritmalar, Bulanık TOPSIS, MCDM, Duyarlılık analizi, 3D TV
INTRODUCTION
TV technologies are developed very fast in every day. Therefore, more specific TVs appear in technology markets. Every year millions of televisions are sold in the technology markets. According to Che (2009), “Due to the changes of the digital signal transmission mode, a display technique revolution has begun in TV market, among the LCD TV having the advantages of slight, electricity-saving, radiation-free and so on. LCD TV products are very popular nowadays”. So, the LCD TVs are the best-selling TVs in technology markets.
When customers are buying a TV, generally they look its appearance, its smartness and whether it has 3D or not except its performance parameters. Therefore, TV sellers start not to share the real performance parameters and also they use various terms instead of its (high dynamic contrast ratio, ultra-dynamic contrast ratio etc.). So, customers must consider a lot of parameters when purchasing a TV. The parameters taken into consideration in TV purchasing are: dynamic contrast ratio, refresh rate, power consumption on mode, depth, weight, cost, response time, brightness, static contrast ratio, number of connections (HDMI, DVI etc.), smartness (internet connection), type (passive or active) and number of 3D glasses.
Because of TV sellers’ not sharing the real TV parameters with the customers, people who consider buying a TV are indecisive during the purchase process. Because of various TVs and a lot of parameters, TV customers have to make a multi-criteria selection. So, TV purchasing process must be thought a MCDM problem and MCDM methods must be used to solve it.
Determining the optimal solution among alternatives is a very difficult situation for the decision makers (Grobbelaar and Visser, 2015). Conventional methods cannot achieve a certain solution in this selection operation. Nevertheless, Multi-Criteria Decision-Making (MCDM) methods can solve the problem easily. Fuzzy logic and fuzzy set theory are very effective methods to solve multi-criteria decision-making issues. Techniques for Order Preference by Similarity to Ideal Solution (TOPSIS), Fuzzy TOPSIS, Analytic Network Process (ANP), Fuzzy ANP (FANP), Analytic Hierarchy Process (AHP), ELECTRE, Data Envelopment Analysis (DEA) and genetic algorithms (GA) are often used for MCDM (Yayla and Yildiz, 2013). A comprehensive literature review about MCDM methods can be found in (Yildiz and Yayla, 2015).
Shahanaghi and Yazdian (2009) applied the fuzzy TOPSIS method for the best supplier selection according to the determined criteria, in terms of purchasing of main components from alternative suppliers in the application performed in the automotive company and the best supplier was selected at the end of the calculations performed after the assessment of four alternative suppliers by three decision makers, according to the determined criteria. In the study of Wang et al. (2009), three suppliers were assessed and arranged by three decision makers according to four selection criteria in the study of supplier selection, which was performed according to hierarchical fuzzy TOPSIS. It was indicated that this method was more reasonable than other methods and could be applied for the calculation of the weights. Yayla et al. (2012) used fuzzy TOPSIS method to select the most suitable supplier in a textile firm in Turkey. According to results, ranking of three suppliers determined by in terms of closeness index values. Roshandel et al. (2013) used fuzzy TOPSIS to select the best supplier from four suppliers that supply a big healthcare products manufacturer in Iran. Vinodh et al. (2014) developed a model and technique based on TOPSIS and AHP to evaluate the performance in fuzzy environment. In this study, it was aimed to select the best plastic recycling between
various processes of plastic recycling and the combined approach which was determined the best one. Cheng
et al. (2006) used genetic algorithms and TOPSIS for calibration of conceptual rainfall-runoff models in a new
framework and they compared the results of two methods. Ic (2014) studied the application of a new approach, Design of Experiment and TOPSIS method (DoE–TOPSIS) together make company ranking as frequently encountered in the real-time financial environment. Bas (2013) proposed an integrated framework for the analysis of an electricity supply chain using an integrated SWOT-fuzzy TOPSIS methodology combined with AHP. Kim et al. (2013) proposed a new framework that prioritized the best sites for treated wastewater (TWW) in stream use by fuzzy TOPSIS. Rouyendegh and Saputro (2014) provided an overview of the fuzzy TOPSIS and Multi-Choice Goal Programming (MCGP) methods for MCDM problem under uncertain environments. Kannan et al. (2014) used this method to select the best green suppliers for an electronics company. Lee et al. (2014) used fuzzy TOPSIS to improve the general flood vulnerability approach. Taylan et al. (2014) combined fuzzy decision tree, fuzzy TOPSIS, and DEA for selecting Air Traffic Controllers (ATCs).
Yeh and Chuang (2011) used two MOEAs to find a mathematical planning model for green partner selection and they used the weighted sum approach to obtain much more Pareto-optimal solutions. Chan and Chung (2004) proposed a multi-criterion genetic algorithm for an orderly distribution in a demand-driven supply chain. Yan (2009) proposed an integrated approach adopting a genetic algorithm and AHP to accomplish green supplier optimization. Altiparmak et al. (2006) proposed a new solution procedure based on genetic algorithms to find a Pareto-optimal set for multi-objective supplier chain design problem. Chiang (2012) used a MOEA to search for the optimal design chain partner combination to minimize product development cost and time and maximize product reliability and employed it for a digital TV box. Bandyopadhyay and Bhattacharya (2013) used a NSGA-II based MOEA and applied it to a novel multi-objective problem for a two-echelon serial supply chain. Ozcan et al. (2017) used ANP and TOPSIS methods for evaluating alternative renewable energy investments in Turkey.
In this study, Fuzzy TOPSIS and DOPGA (Domination power of an individual genetic algorithm) which is one of the MOEA algorithms are used to evaluate the best 3D TV through the alternative 3D TVs. Afterwards, the results are compared and the best 3D TV is determined.
The rest of this paper is organized as follows. In Section 2, general information about fuzzy TOPSIS, MOEA and DOPGA are given. In Section 3, these methods are applied to the evaluation of the best 3D TV problem separately, and the results are given. Finally, Section 4 contains concluding remarks, assessments, and future directions.
MATERIALS AND METHODS Fuzzy Topsis
Techniques for Order Preference by Similarity to Ideal Solution(TOPSIS) is a method that ranks the preferences by using similarity to the optimum solution. This method is currently one of the most useful MCDM methods (Dymova et al.,2013; Chiu et al.,2015). TOPSIS aims to reach the closest truth (Chen and Tsai, 2007).
Kim et al. (2013) stated that “TOPSIS method is used to solve multiple-attribute decision making problems in which preference information is not articulated. In this method, the ideal alternative has the best values for all attributes, whereas the negative ideal is the alternative with all of the worst attribute values”. In TOPSIS method, first, the positive and negative ideal solutions are defined and after that, the distance of the alternatives from the ideal solutions are found. TOPSIS method identifies a closeness coefficient index to the positive ideal solution (PIS) and remoteness to the negative ideal solution (NIS). TOPSIS selects the best alternative according to maximum closeness coefficient to the PIS (Kannan et al., 2014).
Fuzzy TOPSIS method, which has demonstrated very successful application examples of real-world problems in which especially personal judgment are expressed with linguistic data, can be utilized in making group decisions in fuzzy environments. Classical TOPSIS method is given superiority because the fuzzy TOPSIS method ensures freedom for expressing experts’ thoughts in a certain range, as well as being a mathematical method handling the judgments of TOPSIS method experts with quantitative data (Chen, 2000).
Chen (2000) extended TOPSIS to the fuzzy case. The linguistic expressions of the fuzzy theory are considered as natural presentations of preferences, the fuzzy importance weights of the criteria and the fuzzy rating of alternatives at criteria are inputs and located in a matrix form in the fuzzy TOPSIS approach. The TOPSIS algorithm is given below (Chen, 2000):
Step 1: Inputs are given in a decision matrix format:
D~ x x x x x x x x x mn m m n n ~ ~ ~ ~ ~ ~ ~ ~ ~ 2 1 2 22 21 1 12 11 (1)
w w , ,w~n
2 ~ , 1 ~ W~ (2) Here, ij x~ are fuzzy ratings of the alternatives,
j
w~ are fuzzy importance weights of the criteria, m is the number of alternatives, n is the number of criteria. (
i
1
,
2
,...,
m
,
j
1
,
2
,...,
n
)Step 2: Compute the normalized fuzzy decision matrix R~:
R~= mx n ij r ~ (3)
For the benefit criteria, the normalized value of
r~
ij is computed as: j ij j ij j ij ij u u u m u l r , , ~ (4) where; ij i j u u max (5) Normalized value of
r~
ij for the cost criteria is computed as: ij j ij j ij j ij l l m l u l r , , ~ (6) Here; ij i j l l min (7)
Step 3: Compute the weighted normalized fuzzy decision matrix is V~:
vij mn ~V~ (8)
The weighted normalized fuzzy value
v~
ij is computed as:j ij ij
r
w
v
~
~
~
(9) Herew
j~
is the fuzzy weight of jthcriterion.Step 4: Define the fuzzy PIS (FPIS) and the fuzzy NIS (FNIS):
n v v v A ~1,~2,...,~ (10)
n v v v A ~1,~2,...,~ (11) In Eqs(10)-(11), ~
1,1,1
j v and ~
0,0,0
j v .Step 5: Compute the distances of each alternative to the FPIS and FNIS by using:
~ ~ d d 1 n j ij j i v v (12)
n j j ij i v v 1 ~ ~ d d (13)In Eqs(12)-(13), d
~va,~vb)shows the distance between two fuzzy numbers.Step 6: Compute the relative closeness to the ideal solution. The relative closeness of the alternative Ai is computed: ) d (d d Ci i_ i_ i (14)
Here 0
Ci
1, an alternative i is closer to the FPIS and far from the FNIS as Ci approaches to 1.Step 7: Rank the alternatives according to Ci. Then, an alternative which has maximum Ci is selected.
Multi-Objective Evolutionary Algorithm (MOEA)
Evolutionary Algorithm (EA) is a global search method that mimics the process of natural evolution. EAs have been successful to solve many multi-objective real-world optimization problems that have several conflicting objectives. Solving a multi-objective optimization problem (MOP), it can be found many Pareto-optimal solutions. The set of all the Pareto-optimal solutions is called the Pareto set (PS) and its image in the objective space is the Pareto front (PF). MOEAs aim to find reasonable numbers of solutions to approximate the PF. Finding PF is not enough for solving a MOP all alone, after that, a decision maker must choose a single solution within PF. There are a lot of MOEA methods proposed in the literature. Interested readers may refer to Deb (2001), Ghosh and Dehuri (2004) and Coello et al. (2007) for detailed information regarding the MOEA methods.
In this paper, a newly proposed fitness assignment scheme is used for ranking some 3D TV brands using their six specifications (refresh rate, dynamic contrast ratio, power consumption on mode, weight, depth, and cost). DOmination Power of an individual Genetic Algorithm (DOPGA) ranks among all the solutions (Ergul and Eminoglu, 2014). Furthermore, DOPGA does not use fitness sharing, niching and crowding distances etc. to rank the solutions.
In literature, there are a lot of fitness assignment scheme for ranking the Pareto-optimal solutions (Fonseca and Fleming, 1993; Srinivas and Deb, 1994; Zitzler and Thiele, 1999; Zitzler et al., 2001; Deb et al., 2002). They ranked solutions using their schemes to find the best solutions to the multi-objective problems. These methods did not use only fitness assignment to solve MOPs but also used GA operators (crossover and mutation), selection mechanisms, elitism strategies, and archive management. Detailed surveys of MOEAs can be accessed in Coello(2006) and Zhou et al.(2011).
The fitness values of the solutions are calculated by using a two-phased algorithm in DOPGA. In the first phase, the population is separated into several subpopulations and the rank values of the solutions in the subpopulations are determined by MOGA (Multi-objective Genetic Algorithm) (Fonseca and Fleming, 1993). In MOGA, the rank of a solution is found by the number of solutions by which it is dominated. All Pareto solutions are assigned rank 1, while dominated ones are penalized according to the population density of the corresponding region of the trade-off surface. In the second phase, the solutions in each subpopulation are re-ranked according to the domination power. The fitness assignment approach of DOPGA only uses the neighborhood of the solutions. Therefore, a decision maker can easily select the best solution. Because, DOPGA can order the solutions from the best one to the worst one in a unique order.
In this paper, DOPGA is only used to rank the solutions, so we use only fitness assignment (or ranking) scheme. After the DOPGA, solutions have a unique rank and DOPGA can sort them the best one to the worst one. In the MOEA literature, the use of priori methods in decision making is very popular. In these methods, MOPs are transformed to SOPs (Single Objective Optimization Problems) using aggregation methods like weighted sum approaches.
Domination power of an individual genetic algorithm (DOPGA)
DOPGA is a recently proposed fitness assignment scheme for MOEAs (Ergul and Eminoglu, 2014). DOPGA assigns a fitness value to a solution in a two-phased algorithm. In the first phase, the main population is separated into several subpopulations by using MOGA (Fonseca and Fleming, 1993). In the next phase, solutions are re-ranked according to the domination power algorithm. In this paper, we use only the fitness assignment (or ranking) scheme of DOPGA. The whole algorithm of DOPGA can be found in Ergul and Eminoglu(2014). The ranking or fitness assignment algorithm of DOPGA is given as:
Step 1: Assign dummy fitness to each solution inversely proportional to their sub-population number (obtained from MOGA algorithm):
) ( 1 ) ( j population sub sol df i (15)
where solisubpopulation(j),i
1, ,p
, and.
means the number of elements in the set.Step 2: Calculate relative domination power of a solution. To do so, find out how many solutions are dominated by this particular solution and sum all the dummy fitnesses of dominated solutions. This will determine: r k k i df sol sol rdp( ) 1 ( ) (16)
where solk is dominated by soli and k
1, ,r
,k i.Step 3: Repeat Step 2 for the rest of the solutions within the same subpopulation. Sum the rdp of all solutions within the same sub-population and obtain total domination power for that sub-population as formulated below:
p i rdp soli j population sub tdp( ( )) 1 (17)where i in
1,,p
represents all solutions inside the subpopulation( j).Step 4: Calculate the real fitness or rank for the i-th solution with the following formula (where 1e-6 is added to the denominator to avoid divide by zero):
( ( )) 1 6
) ( ) ( ) ( e j population sub tdp i rdp j population sub i rfi (18)Step 5: Repeat Step 2 to Step 4 until all solutions are ranked.
For the sake of clarity, there is a population of solutions ranked by DOPGA in Fig.1. First, solutions are ranked by using MOGA. So, the solutions have identical ranks. In Fig. 1a; solution A, B, C, and D are in the first Pareto-optimal front and their fitness values are one (1). Solution E and F are on the second front and their fitness values are two (2). Solution G has fitness value of three (3) and Solution H has fitness value of eight (8).
Second, each solution in all subpopulations is re-ranked by using the domination power concept. The final (or real) rank values of the solutions are found by using the above algorithm. An example population is depicted in Fig. 1b.
For a better understanding, the rank of solution B is computed step by step below. Step 1: Solution B is on the first Pareto-optimal front (the first subpopulation)
1 1 1 ) ( 1 ) ( B population sub B df
Step 2: Solution B dominates three solutions (F, G, and H), therefore the relative domination power of B is calculated as:
9583
.
0
)
(
1250
.
0
3333
.
0
500
.
0
)
(
)
(
)
(
)
(
B
rdp
H
df
G
df
F
df
B
rdp
Step 3: Total domination power of the first subpopulation is found by summing the relative domination powers of all solutions on this front.
1666 . 2 125 . 0 625 . 0 9583 . 0 4583 . 0 ) , , , ( )) 1 ( ( pop st rdp A B C D sub tdp
4423 . 1 6 1 1666 . 2 9583 . 0 1 ) ( 6 1 )) 1 ( ( ) ( ) ( ) ( e B rfi e st pop sub B B pop sub B rfi tdp rdp
Solutions in the first Pareto-optimal front have different fitness values in Fig. 1b.
Figure 1. (a) Raw fitness values and, (b) ranks or real fitness (rfi) values THE CASE STUDY
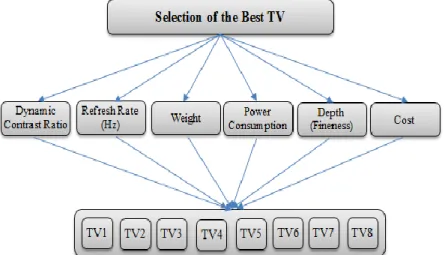
In this paper, Fuzzy TOPSIS and DOPGA are implemented for evaluating the best 3D TV through the alternative 3D TVs. Eight 55 inch Full HD 3D LED TVs are used in the evaluation/decision process. TV catalogs have been utilized to determine the criteria for evaluating the best 3D TV. It is benefited from three experts’ opinion to determine the TV parameters used in this paper. The TV parameters used in this study are dynamic contrast ratio, refresh rate, weight, power consumption, depth, and cost. Hierarchy of the 3D TV evaluation problem is depicted in Fig. 2.
Figure 2. Hierarchy of the 3D TV selection problem
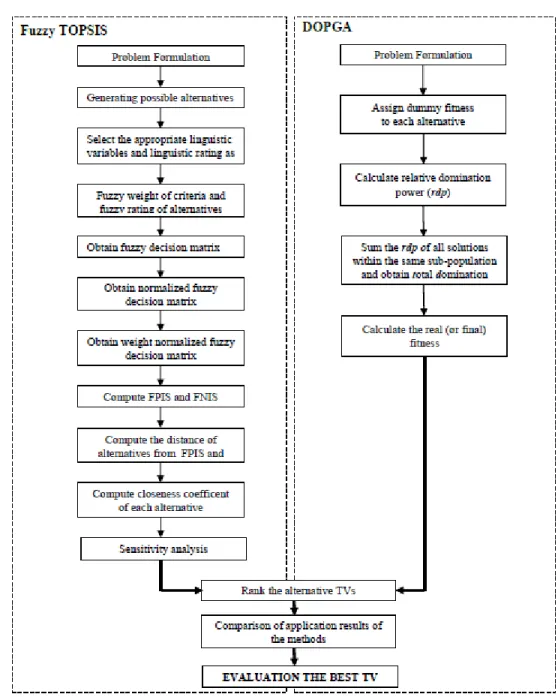
Flowchart of the methods applied to the 3D TV evaluation problem is shown in Fig. 3.
Figure 3. Flowchart of the methods applied to the TV selection problem. Application of Fuzzy TOPSIS Method to 3D TV Evaluation Problem
The catalog values of selected parameters of eight alternative 3D TVs are given in Table 1. Since the criteria of weight, power consumption on mode, depth, and cost ($) are generally known; only the dynamic contrast ratio and refresh rate criteria are briefly explained below.
Table 1. The catalogue values of alternative 3D TVs
CRITERIA ALTERNATIVE 3D TVs
TV1 TV2 TV3 TV4 TV5 TV6 TV7 TV8
Dynamic Contrast Ratio 9.000.000:
1 1.000.000: 1 1.000.000: 1 2.000.000: 1 5.000.000: 1 500.000: 1 1.000.000: 1 7.000.000: 1 Refresh Rate (Hz) 240 240 240 240 400 200 600 400 Weight (kg) 21.3 16.8 18.4 17 36,8 19.5 20,4 22,1 Power Consumption on Mode (W) 160 70 59.25 82.3 120 90 112 185 Depth (Fineness-mm) 33 35 46 27 60 32,5 36 43 Cost ($) 1.259,99 2.497,99 1.598,00 1.695,00 6.351,85 3.052,00 1.601,00 1.639,00
Dynamic contrast ratio is a rating used to determine the image quality of a TV. The static contrast ratio denotes the luminance of the brightest possible white colors on the screen versus the deepness and darkness of black shades. The refresh rate is the number of times in a second that display hardware updates its buffer. After determining the criteria and hierarchy of the problem, people who are considering the purchase of 3D TV have used the linguistic variables in Table 2 to determine importance weights of the 3D TV selection criteria (Table 3).
Table 2. Linguistic variables for the importance weight of criteria Linguistic variable Triangular Fuzzy Numbers (TFNs)
Very low (VL) (0,0,0.1) Low (L) (0,0.1,0.3) Medium low (ML) (0.1,0.3,0.5) Medium (M) (0.3,0.5,0.7) Medium high (MH) (0.5,0.7,0.9) High (H) (0.7,0.9,1) Very high (VH) (0.9,1,1)
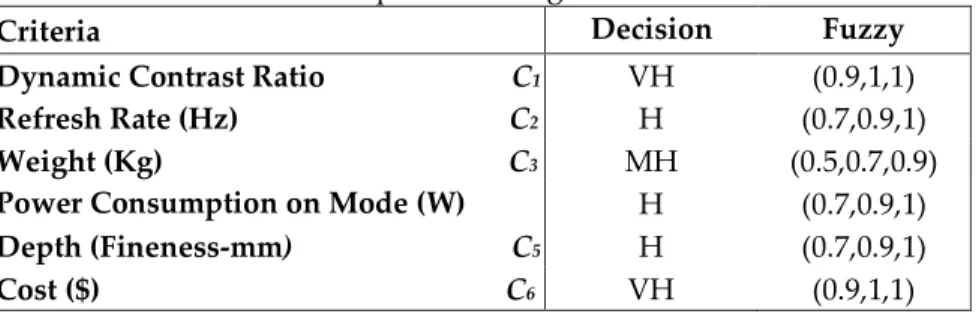
Table 3. Importance weights of criteria
Criteria Decision
Maker
Fuzzy Numbers Dynamic Contrast Ratio C1 VH (0.9,1,1)
Refresh Rate (Hz) C2 H (0.7,0.9,1)
Weight (Kg) C3 MH (0.5,0.7,0.9)
Power Consumption on Mode (W) C4
H (0.7,0.9,1)
Depth (Fineness-mm) C5 H (0.7,0.9,1)
Cost ($) C6 VH (0.9,1,1)
Then, the linguistic variables in Table 4 are determined by using a transformation calculation of the catalog values in Table 1. Afterward, the evaluations in Table 5 are done by using the linguistic variables in Table 4.
Table 4. Linguistic variables used in the evaluation of alternative 3D TVs Linguistic
variable
Triangular Fuzzy Numbers (TFNs) Very poor (VP) (0,0,1) Poor (P) (0,1,3) Medium poor (MP) (1,3,5) Fair (F) (3,5,7) Medium good (MG) (5,7,9) Good (G) (7,9,10) Very good (VG) (9,10,10
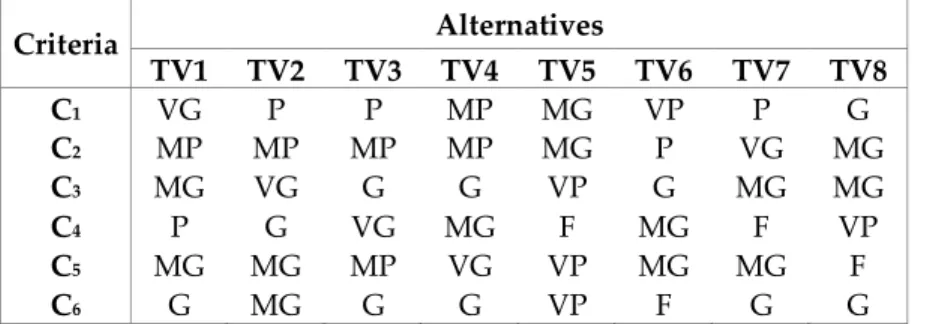
Table 5. Evaluation Results of Alternative 3D TVs According to Six Criteria
Criteria Alternatives TV1 TV2 TV3 TV4 TV5 TV6 TV7 TV8 C1 VG P P MP MG VP P G C2 MP MP MP MP MG P VG MG C3 MG VG G G VP G MG MG C4 P G VG MG F MG F VP C5 MG MG MP VG VP MG MG F C6 G MG G G VP F G G
Fuzzy decision matrix is formed by converting the linguistic evaluations to triangular fuzzy numbers (Table 6).
Table 6. Fuzzy decision matrix and fuzzy weights of eight alternatives
Fuzzy decision matrix is normalized as in Table 7, then weighted normalized fuzzy decision matrix is obtained as given in Table 8.
Table 7. Normalized fuzzy decision matrix
Criteria Alternatives TV1 TV2 TV3 TV4 TV5 TV6 TV7 TV8 C1 (9,10,10 (0,1,3) (0,1,3) (1,3,5) (5,7,9) (0,0,1) (0,1,3) (7,9,10) C2 (1,3,5) (1,3,5) (1,3,5) (1,3,5) (5,7,9) (0,1,3) (9,10,10 (5,7,9) C3 (5,7,9) (9,10,10 (7,9,10) (7,9,10) (0,0,1) (7,9,10) (5,7,9) (5,7,9) C4 (0,1,3) (7,9,10) (9,10,10 (5,7,9) (3,5,7) (5,7,9) (3,5,7) (0,0,1) C5 (5,7,9) (5,7,9) (1,3,5) (9,10,10 (0,0,1) (5,7,9) (5,7,9) (3,5,7) C6 (7,9,10) (5,7,9) (7,9,10) (7,9,10) (0,0,1) (3,5,7) (7,9,10) (7,9,10) Criteria Alternatives TV1 TV2 TV3 TV4 TV5 TV6 TV7 TV8 C1 (0.9,1,1) (0,0.1,0.3) (0,0.1,0.3) (0.07,0.2,0.4) (0.5,0.7,0.9) (0,0,0.1) (0,0.1,0.3) (0.7,0.9,1) C2 (0.1,0.3,0.5) (0.1,0.3,0.5) (0.1,0.3,0.5) (0.1,0.3,0.5) (0.5,0.7,0.9) (0,0.1,0.3) (0.9,1,1) (0.5,0.7,0.9) C3 (0.5,0.7,0.9) (0.9,1,1) (0.7,0.9,1) (0.7,0.9,1) (0,0,0.1) (0.7,0.9,1) (0.5,0.7,0.9) (0.5,0.7,0.9) C4 (0,0.1,0.3) (0.7,0.9,1) (0.9,1,1) (0.5,0.7,0.9) (0.3,0.5,0.7) (0.5,0.7,0.9) (0.3,0.5,0.7) (0,0,0.1) C5 (0.5,0.7,0.9) (0.5,0.7,0.9) (0.1,0.3,0.5) (0.9,1,1) (0,0,0.1) (0.5,0.7,0.9) (0.5,0.7,0.9) (0.3,0.5,0.7) C6 (0.7,0.9,1) (0.5,0.7,0.9) (0.7,0.9,1) (0.7,0.9,1) (0,0,0.1) (0.3,0.5,0.7) (0.7,0.9,1) (0.7,0.9,1)
Table 8. Weighted normalized fuzzy decision matrix
Distance from FPIS (
d
i) values of each alternative 3D TVs are calculated by Equation 10 and their distance from FNIS (di) values are computed by Equation 11. Then, closeness index is computed for each alternativeby using Equation 14 considering
d
i andd
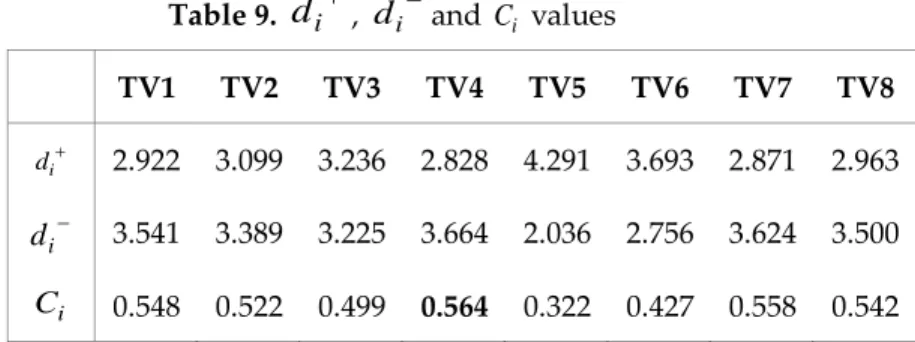
i values. The results are given in Table 9.Table 9.
d
i,d
iand Ci valuesDue to closeness coefficients, the order of the 3DTV alternatives is as TV4> TV7> TV1> TV8> TV2> TV3> TV6> TV5 based on Table 9. According to this result, it will be the best to choose TV4 which has the highest closeness coefficient value among alternative 3D TVs.
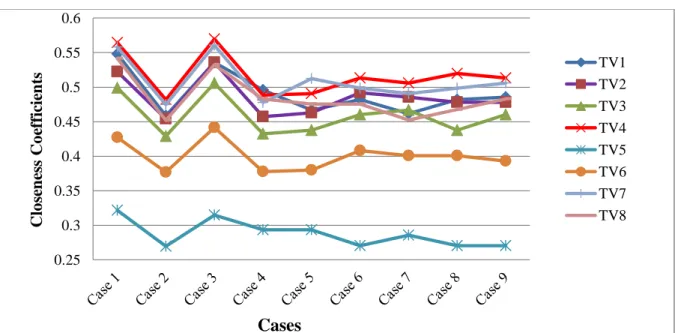
A sensitivity analysis is applied to show how well the alternatives perform with each objective and how sensitive the alternatives are to changes in the importance of the objectives. After the order of the alternatives determined, it must be evaluated that how sensitive the order of alternatives and the final decision against the changes in the judgments in order to check the results of the established model. By changing the weights of the selection criteria in the sensitivity analysis, the variation of the closeness coefficients and the order of the alternatives under the total of 9 different cases shown in Table 10 are examined and the obtained results are shown in Fig. 4 and Fig. 5.
Criteria Alternatives TV1 TV2 TV3 TV4 TV5 TV6 TV7 TV8 C1 (0.81,1,1) (0,0.1,0.3) (0,0.1,0.3) (0.06,0.23,0.43) (0.45,0.7,0.9) (0,0,0.1) (0,0.1,0.3) (0.63,0.9,1) C2 (0.07,0.27,0.5) (0.07,0.27,0.5) (0.07,0.27,0.5) (0.07,0.27,0.5) (0.35,0.63,0.9) (0,0.09,0.3) (0.63,0.9,1) (0.35,0.63,0.9) C3 (0.25,0.49,0.81) (0.45,0.7,0.9) (0.35,0.63,0.9) (0.35,0.63,0.9) (0,0,0.09) (0.35,0.63,0.9) (0.25,0.49,0.81) (0.25,0.49,0.81) C4 (0,0.09,0.3) (0.49,0.81,1) (0.63,0.9,1) (0.35,0.63,0.9) (0.21,0.45,0.7) (0.35,0.63,0.9) (0.21,0.45,0.7) (0,0,0.1) C5 (0.35,0.63,0.9) (0.35,0.63,0.9) (0.07,0.27,0.5) (0.63,0.9,1) (0,0,0.1) (0.35,0.63,0.9) (0.35,0.63,0.9) (0.21,0.45,0.7) C6 (0.7,0.9,1) (0.5,0.7,0.9) (0.7,0.9,1) (0.7,0.9,1) (0,0,0.1) (0.3,0.5,0.7) (0.7,0.9,1) (0.7,0.9,1) TV1 TV2 TV3 TV4 TV5 TV6 TV7 TV8 i d 2.922 3.099 3.236 2.828 4.291 3.693 2.871 2.963 i d 3.541 3.389 3.225 3.664 2.036 2.756 3.624 3.500 i C 0.548 0.522 0.499 0.564 0.322 0.427 0.558 0.542
Table 10. The Case combinations with different criteria weights Cases Combinations
Case 1 Current
Case 2 All Low
Case 3 All Medium
Case 4 Dynamic Contrast Ratio High, The Rest Low
Case 5 Refresh Rate High, The Rest Low
Case 6 Weight High, The Rest Low
Case 7 Power Consumption on Mode High, The Rest Low
Case 8 Depth High, The Rest Low
Case 9 Cost High, The Rest Low
Figure 4. Closeness coefficients changes based on sensitivity analysis
0.25 0.3 0.35 0.4 0.45 0.5 0.55 0.6 C lo se n es s C o ef fi ci en ts
Cases
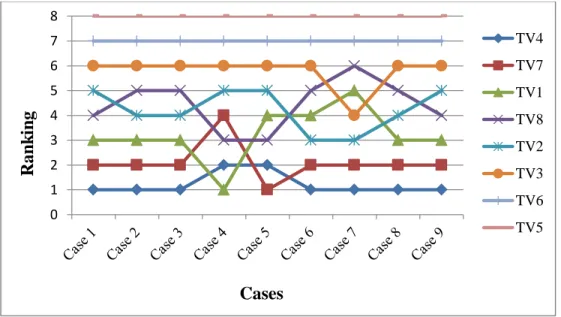
TV1 TV2 TV3 TV4 TV5 TV6 TV7 TV8Figure 5. The ranking changes of the alternative 3DTVs based on the sensitivity analysis
When Fig. 4 and Fig.5 are examined, it is seen that TV4 has the highest closeness coefficient in all cases except Case 4 and Case 5, and TV5 has the lowest closeness coefficient in all cases. Figure 5 shows the order of the alternatives, it is seen that in the Case 4 and Case 5, the dynamic contrast ratio and refresh rate (Hz) criteria have a negative effect on the TV4 and the dynamic contrast ratio criteria on TV7 in a similar way. Also, it is seen that dynamic contrast ratio and depth criteria have a positive effect on the TV1.
Application of DOPGA Method to 3D TV Evaluation Problem
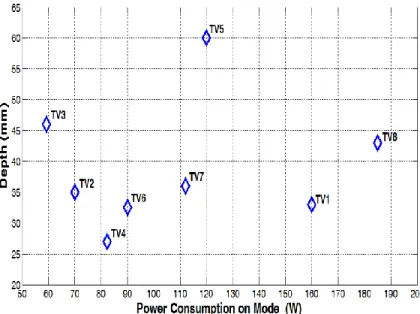
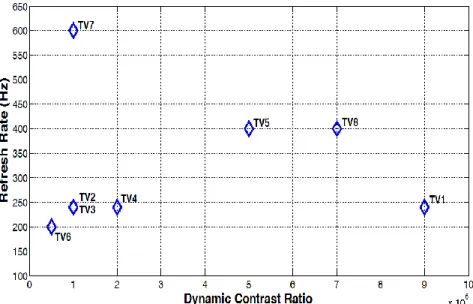
DOPGA is used as MOEA method to rank the alternative 3D TVs. For the best graphical visualizations, criteria are used in DOPGA two by two. Afterward, the real fitness/rank values of alternative 3D TVs are found by ranking or fitness assignment algorithm of DOPGA. The visualizations are shown in Fig. 6, Fig. 7 and Fig. 8. Then, DOPGA is worked by using the real fitness/rank values founded by two by two applications. The results of DOPGA is depicted in Fig. 9 by using the obtained real fitness values of all solutions. The real fitness values or ranks calculated by using Eq.18 are given in Table 11.
0 1 2 3 4 5 6 7 8
R
an
k
in
g
Cases
TV4 TV7 TV1 TV8 TV2 TV3 TV6 TV5
Figure 6. Criteria values of depth and power consumption on the mode of eight alternative 3D TVs
Figure 8. Criteria values of refresh rate and dynamic contrast ratio of eight alternative 3D TVs
The result obtained from DOPGA are given in Table 11. Solution 1,2,3,4 and 7 are Pareto-optimal solutions and DOPGA separated them perfectly. And the decision maker no longer confuses to separate them. DOPGA sorts the solutions from the most desired one to the least desired one.
Figure 9. Real fitness values/ranks found by DOPGA Table 11. Results obtained from DOPGA
Alternative
3DTVs Real fitness (rfi) values Rank
TV1 1.2084 3 TV2 1.2222 4 TV3 1.3175 5 TV4 1.1270 1 TV5 5.0000 8 TV6 3.1667 7 TV7 1.1667 2 TV8 3.0000 6
According to the real fitness values, alternatives are ranked as TV4> TV7> TV1> TV2 > TV3 > TV8 > TV6 > TV5 in descending order shown in Table 11. According to this result, it will be the best to choose TV4 which has the lowest real fitness value among alternative 3D TVs.
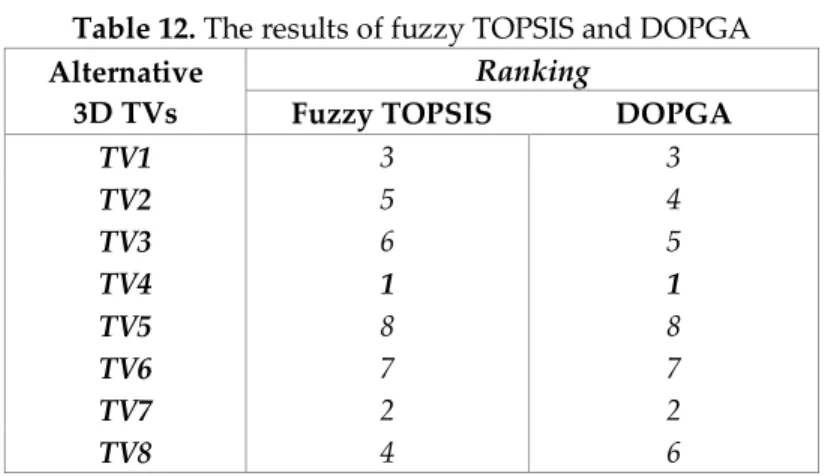
Table 12 is obtained via the results derived by implementing every two methods individually at the 3D TV selection problem.
Table 12. The results of fuzzy TOPSIS and DOPGA Alternative
3D TVs
Ranking
Fuzzy TOPSIS DOPGA
TV1 3 3 TV2 5 4 TV3 6 5 TV4 1 1 TV5 8 8 TV6 7 7 TV7 2 2 TV8 4 6
Table 12 shows the ranks of TVs obtained by the closeness coefficients of fuzzy TOPSIS and the real fitness values of DOPGA. According to these results, TV4 is the first order, TV7 is the second order and TV1 is the third order in both methods. Besides, the last two 3D TVs are the same with both methods. Therefore, it is detected that both methods have a similar ranking. According to these results, someone who purchases a 3D TV should select TV4.
CONCLUSION
Innovative products are developed rapidly. One of them is TV. With the rapid advancement of technology and the continuous increase of customers' needs, a huge increase in the variety of TVs. Thus, TV purchasing becomes a MCDM problem and TV customers confuse in selecting the correct TV among various TVs that have a lot of features. Using MCDM methods as in solving other selection problems will contribute to solving the TV selection problem.
Fuzzy TOPSIS is a MDCM method used in the fuzzy environment and it assigns different importance weight to the decision criteria. Therefore, it makes easy to select a more accurate and more reliable choice among the alternatives for decision makers. In addition, because of fuzzy TOPSIS method gets decision makers thoughts for the preference articulation; it can be avoided possible conflicts among decision makers.
EAs are very popular and useful search tools for optimization. Unlike the classical optimization methods, EAs use a population of solutions to find the optimum of a problem. EAs do not need derivative information, and they are very easy to implement.
In this paper, newly proposed DOPGA method is applied to 3D TV selection problem. DOPGA method can assign a unique rank to all solutions. DOPGA can sort the solutions (TV alternatives) from the best one to the worst one. Due to these reasons, fuzzy TOPSIS and DOPGA are used to solve 3D TV selection problem in this study.
According to the results, TV4 is selected the best 3D TV in fuzzy TOPSIS and DOPGA methods. In both methods, the order of alternative 3D TVs is nearly the same. It can be seen that fuzzy TOPSIS and DOPGA can be used together to solve 3D TV selection problem.
This complex problem is solved by using fuzzy TOPSIS and DOPGA for a customer who purchases a 3D TV. On this count, the people who will purchase 3D TV will no longer be confused. Purchasing problems like this can easily be solved in this way.
This study is the first study for solving 3D TV selection problems in the literature. In a future work, it is planned to use fuzzy ANP and generalized Choquet to solve this problem and to compare the results of this study. Therefore, it can be performed a more precise selection. Also, the TV selection model, the methods and the results used in this study will guide TV customers and researchers.
REFERENCES
Altiparmak, F., Gen, M., Lin L., Paksoy, T.A., 2006, ”Genetic Algorithm Approach for Multi-Objective Optimization of Supply Chain Networks”, Computers & Industrial Engineering, Vol. 51(1), pp. 197– 216.
Bandyopadhyay, S., Bhattacharya, R., 2013, “Applying Modified NSGA-II for Bi-Objective Supply Chain Problem”, Journal of Intelligent Manufacturing, Vol. 24(1), pp. 707-716.
Bas, E., 2013, “The Integrated Framework for Analysis of Electricity Supply Chain Using an Integrated SWOT-Fuzzy TOPSIS Methodology Combined with AHP: The Case of Turkey”, Electrical Power and
Energy Systems, Vol. 44, pp. 897–907.
Chan, F.T.S., Chung, S.H., 2004, “A Multi-Criterion Genetic Algorithm for Order Distribution in a Demand Driven Supply Chain”, International Journal of Computer Integrated Manufacturing, Vol. 17(4), pp. 339-351.
Che, Z.H., 2009, “Pricing Strategy and Reserved Capacity Plan Based on Product Life Cycle and Production Function on LCD TV Manufacturer”, Expert Systems with Applications, Vol. 36, pp. 2048–2061. Chen, C.F.,Tsai, D., 2007, “How Destination Image and Evaluative Factors Affect Behavioral Intentions?”,
Tourism Management, Vol. 28, pp. 1115-1122.
Chen, C.T., 2000, “Extensions of the TOPSIS for Group Decision-Making Under Fuzzy Environment”, Fuzzy
Sets and Systems, Vol. 114, pp. 1-9.
Cheng, C.T., Zhao, M.Y., Chau, K.W., Wu, X.Y., 2006, “Using Genetic Algorithm and TOPSIS for Xinanjiang Model Calibration with a Single Procedure”, Journal of Hydrology, Vol. 316, pp. 129–140.
Chiang, Tzu-An., 2012, “Multi-objective Decision-Making Methodology to Create an Optimal Design Chain Partner Combination”, Computers & Industrial Engineering, Vol. 63, pp. 875–889.
Chiu, M. C., Kuo, M. Y., Kuo, T. C., 2015, “A Systematic Methodology to Develop Business Model of A Product Service System”, International Journal of Industrial Engineering: Theory, Applications and
Practice, Vol. 22(3).
Coello, C.A.C., 2006, “Evolutionary Multi-Objective Optimization: A Historical View of the Field”, IEEE
Computational Intelligence Magazine, Vol. 1(1), pp. 28-36.
Coello, C. A. C., Lamont, G. B., Van Veldhuizen, D. A., 2007, “Evolutionary Algorithms for Solving
Multi-Objective Problems, Vol. 5, New York: Springer.
Dymova, L., Sevastjanov, P., Tikhonenko, A., 2013, ”An Approach to Generalization of Fuzzy TOPSIS Method”, Information Sciences, Vol. 238, pp. 149–162.
Deb, K., 2001, Multi-objective Optimization Using Evolutionary Algorithms, Chichester, U.K, Wiley.
Deb, K., Pratap, A., Agarwal, S.,Meyarivan, T., 2002, “A Fast and Elitist Multi-Objective Genetic Algorithm: NSGA-II”, IEEE Transactions on Evolutionary Computation, Vol. 6(2), pp. 182-197.
Ergul, E.U., Eminoglu, I., 2014, “DOPGA: A New Fitness Assignment Scheme for Multi-Objective Evolutionary Algorithms”, International Journal of Systems Science, Vol. 45(3), pp. 407-426.
Fonseca, C.M., Fleming, P.J., 1993, “Genetic Algorithms for Multi-Objective Optimization: Formulation, Discussion and Generalization”, In Proceedings of the Fifth International Conference on Genetic
Algorithms, pp. 416-423.
Ghosh, A. & Dehuri S. (2004). Evolutionary Algorithms for Multi-Criterion Optimization: A Survey
International Journal of Computing & Information Sciences, Vol. 2 (1), pp. 38-57.
Grobbelaar, S., Visser, J. K., 2015, “Determining the Cost of Predictive Component Replacement in order to Assist with Maintenance Decision-Making”, South African Journal of Industrial Engineering,Vol. 26(1), pp. 150-162.
Ic, Y.T., 2014, “A TOPSIS based Design of Experiment Approach to Assess Company Ranking”, Applied
Mathematics and Computation, Vol. 227, pp. 630–647.
Kannan, D., Jabbour, A.B.L.S, Jabbour, C.J.C., 2014, “Selecting Green Suppliers based on GSCM Practices: Using Fuzzy TOPSIS Applied to a Brazilian Electronics Company”, European Journal of Operational
Research, Vol. 233, pp. 432–447.
Kim, Y., Chung, E.S., Jun, S.M., Kim, S.U., 2013, “Prioritizing the Best Sites for Treated Wastewater Instream use in an Urban Watershed Using Fuzzy TOPSIS”, Resources, Conservation and Recycling, Vol. 73, pp. 23- 32.
Lee, G., Jun, K.S., Chung, E.S., 2014, “Robust Spatial Flood Vulnerability Assessment for Han River Using Fuzzy TOPSIS with A-Cut Level Set”, Expert Systems with Applications, Vol. 41, pp. 644–654.
Ozcan, E. C., Unlusoy, S., Eren, T., 2017, “ANP ve TOPSIS Yontemleriyle Turkiye'de Yenilenebilir Enerji Yatirim Alternatiflerinin Degerlendirilmesi”, Selcuk University Journal of Engineering, Science And
Technology, Vol. 5(2), pp. 204-219.
Shahanaghi, K. S., Yazdian, S.A., 2009, “Vendor Selection Using a New Fuzzy Group TOPSIS Approach”,
Journal of Uncertain Systems, Vol. 3(3), pp. 221-231.
Roshandel, J., Miri-Nargesi, S.S., Hatami-Shirkouhi, L., 2013, “Evaluating and Selecting the Supplier in Detergent Production Industry Using Hierarchical Fuzzy TOPSIS”, Applied Mathematical Modelling, Vol. 37, pp. 10170–10181.
Rouyendegh, B.D., Saputro, T.E., 2014, “Supplier Selection using Integrated Fuzzy TOPSIS and MCGP: A Case Study” Procedia - Social and Behavioral Sciences, Vol. 116, pp 3957–3970.
Srinivas, N., Deb, K., 1994, “Multi-objective Function Optimization Using Nondominated Sorting Genetic Algorithm”, Evolutionary Computation, Vol. 2(3), pp. 221–248.
Taylan, O., Alidrisi, H., Kabli, M., 2014, ”A Multi-Criteria Decision-Making Approach that Combines Fuzzy Topsis and DEA Methodologies”, South African Journal of Industrial Engineering, Vol. 25(3), pp.39-56. Vinodh, S., Prasanna, M., Hari Prakash, N., 2014, ”Integrated Fuzzy AHP–TOPSIS for Selecting the Best
Plastic Recycling Method: A Case Study”, Applied Mathematical Modelling, In press.
Wang, J.V., Cheng, C.H., Kun-Cheng, H., 2009, “Fuzzy Hierarchical TOPSIS for Supplier Selection”, Applied
Soft Computing, Vol. 9, pp. 377-386.
Yan, G., 2009, “Research on Green Suppliers’ Evaluation based on AHP & Genetic Algorithm”, In:
International Conference on SPS, IEEE, pp. 615-619, 15-17 May 2009.
Yayla, A.Y., Yildiz, A., Özbek, A., 2012, “Fuzzy TOPSIS Method in Supplier Selection and an Application in Garment Industry”, Fibres & Textiles in Eastern Europe, 20, 4(93), pp 20-23.
Yayla, A.Y., Yildiz, A., 2013, “Fuzzy ANP based MCDM Methodology for a Family Automobile Purchasing Decision” South African Journal of Industrial Engineering, Vol. 24(2), pp. 167-180.
Yıldız, A., Yayla, A.Y., 2015, “Multi-Criteria Decision-Making Methods For Supplier Selection: A Literature Review”, South African Journal of Industrial Engineering, Vol. 26(2), pp. 158-177.
Yeh, W.-C., Chuang, M.C., 2011, “Using Multi-Objective Genetic Algorithm for Partner Selection in Green Supply Chain Problems”, Expert Systems with Applications, Vol. 38(4), pp. 4244-4253.
Zhou, A., Qu, B.Y., Li, H., Zhao, S.Z., Suganthan, P.N., Zhang, Q., 2011, “Multiobjective Evolutionary Algorithms: A Survey of the State of the Art”, Swarm and Evolutionary Computation, Vol. 1(1), pp. 32-49.
Zitzler, E., Thiele, L., 1999, “Multi-objective Evolutionary Algorithms: A Comparative Case Study and the Strength Pareto Approach. IEEE Trans. on Evolutionary Computation, Vol. 3(4), pp. 257-271.
Zitzler, E., Laumanns, M., Thiele, L., 2001, “SPEA2: Improving the Strength Pareto Evolutionary Algorithm”, TIK-Report 103, Swiss Federal Institute of Technology, Zurich.