https://doi.org/10.1007/s11306-019-1522-5 ORIGINAL ARTICLE
An integrated genomic and metabolomic approach for defining
survival time in adult oligodendrogliomas patients
Caroline Bund1,2 · Mariana Guergova‑Kuras3 · A. Ercument Cicek4,5 · François‑Marie Moussallieh1 ·
Nassim Dali‑Youcef6,7 · Martial Piotto8 · Pilar Schneider3 · Rémy Heller9 · Natacha Entz‑Werle10 · Benoît Lhermitte11 · Marie‑Pierre Chenard11 · Roland Schott12 · François Proust13 · Georges Noël14 · Izzie Jacques Namer1,2,15
Received: 15 October 2018 / Accepted: 1 April 2019 / Published online: 29 April 2019 © Springer Science+Business Media, LLC, part of Springer Nature 2019
Abstract
Introduction The identification of frequent acquired mutations shows that patients with oligodendrogliomas have divergent biology with differing prognoses regardless of histological classification. A better understanding of molecular features as well as their metabolic pathways is essential.
Objectives The aim of this study was to examine the relationship between the tumor metabolome, six genomic aberrations (isocitrate dehydrogenase1 [IDH1] mutation, 1p/19q codeletion, tumor protein p53 [TP53] mutation, O6-methylguanin-DNA
methyltransferase [MGMT] promoter methylation, epidermal growth factor receptor [EGFR] amplification, phosphate and tensin homolog [PTEN] methylation), and the patients’ survival time.
Methods We applied 1H high-resolution magic-angle spinning (HRMAS) nuclear magnetic resonance (NMR) spectroscopy
to 72 resected oligodendrogliomas.
Results The presence of IDH1, TP53, 1p19q codeletion, MGMT promoter methylation reduced the relative risk of death, whereas PTEN methylation and EGFR amplification were associated with poor prognosis. Increased concentration of 2-hydroxyglutarate (2HG), N-acetyl-aspartate (NAA), myo-inositol and the glycerophosphocholine/phosphocholine (GPC/ PC) ratio were good prognostic factors. Increasing the concentration of serine, glycine, glutamate and alanine led to an increased relative risk of death.
Conclusion HRMAS NMR spectroscopy provides accurate information on the metabolomics of oligodendrogliomas, mak-ing it possible to find new biomarkers indicative of survival. It enables rapid characterization of intact tissue and could be used as an intraoperative method.
Keywords HRMAS-NMR spectroscopy · Metabolomics · Oligodendroglioma · Overall survival · IDH · PTEN
1 Introduction
Oligodendrogliomas, divided into low-grade (grade II) and high-grade (grade III) (Louis et al. 2007), are one of the most difficult therapeutic challenges in neurosurgery and neuro-oncology, because of their sensitivity to radio- and chemotherapy, which improve survival in some subtypes. These tumors are frequently diagnosed after convulsive
seizures, although the patients remain asymptomatic, often for several years even if the tumor continues to progress slowly. However, after this period of lull, the tumor inevita-bly turns to aggressive growth. In contrast to this classical evolution, in clinical practice, it is not unusual to observe that some low-grade cases present a poor prognosis with rapid malignant transformation and conversely that some high-grade cases survive beyond 10 years. Although EORTC trial showed the radiotherapy can delay the low-grade tumor progression, this trial failed to demonstrate an overall sur-vival improvement. Consequently, in lack of progression, and in absence of aggressive tumor feature, radiotherapy is often postponed at progression time. Recently a new trial has been open to inclusions for the patients with high-grade oli-godendrogliomas to compare chemotherapy with PCV and
Electronic supplementary material The online version of this article (https ://doi.org/10.1007/s1130 6-019-1522-5) contains supplementary material, which is available to authorized users. * Caroline Bund
immediate radiotherapy and the same chemotherapy with a radiotherapy delayed at progression time. Furthermore, early treatment could expose asymptomatic patients to func-tional risks. So, the choice and the time of the therapeutic intervention are a real issue and obviously are linked to the expected survival.
Over the last few years, the identification of frequent acquired mutations shows that patients with oligodendro-gliomas have divergent biology with differing prognoses. Consequently, since 2016, molecular characteristics are included in the WHO classification (Louis et al. 2016) (Banan and Hartmann 2017), including two new entities: IDH-mutant and 1p19q codeleted oligodendrogliomas and anaplastic oligodendrogliomas, IDH-mutant and 1p/19q codeleted. These molecular features provide prognostic and/or predictive data, which make it crucial for treatment choice because of their relation to survival (Chen et al. 2015) (Wirsching and Weller 2016). Other genetic mutations are being studied in clinical routine, but their impact is not well understood. A better understanding of molecular features as well as their metabolic pathways is essential.
Metabolomics is a technique that has been maturing over the past few years, making it possible to relate genotype and phenotype, providing a better understanding of tumor metab-olism by measuring the metabolite concentration impacted by down- or up-regulation of a specific gene transcript (Grif-fin and Shockcor 2004) (Mörén et al. 2015). HRMAS NMR spectroscopy enables identification and quantification of metabolites in intact tissue samples with excellent resolu-tion (Battini et al. 2016) and can be used in clinical routine (samples are quickly transported by a pneumatic tube system in our hospital).
The aim of this study was to examine the relationship between the tumor metabolome, six genomic aberrations (IDH1 mutation, 1p/19q codeletion, TP53 mutation, MGMT promoter methylation, EGFR amplification, PTEN methyla-tion), and the survival time of patients.
2 Materials and methods
2.1 Patient populationBetween February 2002 and December 2016, 72 patients with an oligodendroglioma, 23 grade II and 49 grade III (WHO 2007), were included. WHO 2016 classification is also provided taking into account molecular biology. Thus, we included 19 low-grade- WHO 2016 and 53 high grade—WHO 2016. All of them underwent surgical sub-total resection followed by temozolomide adjuvant chemo-therapy. Only high-grade (according to WHO 2007) oligo-dendroglioma patients underwent brain radiotherapy. One patient was excluded from survival analysis, because of
a multimetastatic bronchial cancer development leading to death 3 years after the diagnosis of oligodendroglioma grade II. All patients gave their written informed consent. The local Ethics Committee approved the study.
2.2 HRMAS NMR analysis
2.2.1 Sample preparation
Tissue specimens were collected with minimum ischemic delays after resection (average time 2 ± 1 min) and snap-frozen in liquid nitrogen before being stored at − 80 °C. Each brain biopsy sample was prepared at − 20 °C by introducing approximatively 18 mg biopsy into a disposable KelF insert.
2.2.2 HRMAS NMR data acquisition
All HRMAS NMR spectra were acquired on a Bruker (Karlsruhe, Germany) Avance III 500 spectrometer (installed in our University Hospital) operating at a proton frequency of 500.13 MHz. The temperature was maintained at 4 °C throughout the acquisition time. A one-dimensional (1D) proton spectrum using a Carr–Purcell–Meiboom–Gill pulse sequence was acquired with a 285-µs inter-pulse delay and a 10-min acquisition time for each tissue sample. The number of loops was set at 328, giving the CPMG pulse train a total length of 93 ms. The chemical shift was calibrated to the peak of the methyl proton of l-lactate at 1.33 ppm.
To confirm resonance assignments in a few representative samples, two-dimensional (2D) 1H–13C experiments were
also recorded. Metabolites were assigned using standard metabolite chemical shift tables (Wishart et al. 2013).
2.2.3 HRMAS NMR data processing
The region between 4.50 and 0.70 ppm of each 1D HRMAS NMR spectrum was automatically bucketed into integral regions of 0.01 ppm, using AMIX 3.9.14 software (Bruker).
The metabolites were quantified using the PULCON method, a very accurate quantification method (Dreier and Wider 2006; Imperiale et al. 2013). Twenty-eight metabo-lites were quantified using an external reference standard of lactate (3 µmol) scanned under the same analytical condi-tions as the tissue samples. The spectra were normalized according to sample weight. Peaks of interest were automati-cally defined using an in-house program under MATLAB 7.0 (MathWorks, Natick, MA, USA). The peak integration for each metabolite was then compared to the peak integra-tion of the lactate reference and corrected according to the number of protons. The results are expressed in nmol mg−1
2.2.4 Histopathology
After NMR HRMAS analysis, the inserts were cut, and for half the content of each sample, the percentage of tumor cells in the total sample of cells with regard to the total surface were calculated based on frozen hematoxylin & eosin-stained sections.
2.2.5 Biomolecular analysis (detailed in supplemental digital content)
Genetic analysis of IDH1 mutation status was determined on genomic DNA extracted from formalin-fixed paraffin-embedded tumor tissue from the other half of the content of inserts. For the other genetic analyses, the mirror sam-ple of the insert material was used.
MGMT promoter methylation was also studied with a fluorescent semi-quantitative methylation-specific PCR (FSQ-MS-PCR) developed in-house (Nguyen et al.
2015). Genomic alterations of the other genes (IDH1,
1p19q, TP53, EGFR and PTEN) were assessed using
PCR by means of allelotyping of microsatellites located in or flanking each of the different genes or chromosomal regions studied.
Genomic DNA was isolated using the usual techniques with the QIAamp® DNA purification kit (Qiagen,
Courta-boeuf, France). A Nanodrop® (ThermoScientific,
Wilming-ton, DE, USA) spectrophotometer was used to assess the DNA quality and quantification. The genomic DNA concen-trations from tumor or blood paired samples ranged from 50 to 400 ng/µL and from 50 to 150 ng/µL, respectively.
2.3 Statistical analysis
The normality of the distribution of the metabolite results was estimated using the Wilks-Shapiro test. The differences between two independent groups were estimated using the Mann–Whitney U-test. The differences between more than two groups were assessed using the Kruskal–Wallis one-way analysis of variance test. The correlation between continu-ous variables was assessed using the Spearman R calcula-tion, a nonparametric comparison based on the ranks of the observations, rather than on the values themselves (“Hmis” package). The association between mutations was evaluated using the Chi square statistics on the contingency tables gen-erated for each pair of genes.
Survival analysis between groups of patients was per-formed using the Kaplan–Maier method and significance was estimated based on the log-rank test. Single markers as well as combining metabolites and genetic markers were assessed using the Cox proportional hazards model and the
significance level was set as 0.05 using the likelihood ratio test.
All statistical analyses were performed with the statistical software R (R Development Core Team 2008) ( www.cran.r-proje ct.org). To uncover all significant associations between the genetic context of a tumor and the steady-state level of the metabolites, we performed association rules based on data-mining (Hastie et al. 2009). Association rules between metabolites and genetic markers were extracted from a bina-rized data set, where the presence of mutation in a patient’s tumor was labeled 1 and the concentration levels of each metabolite were discretized in two bin1998s applying differ-ent thresholds. The association rules were generated using KEM® software (Jullian and Afshar 2008) (Liquiere and
Sallantin 1998) and filtered using the four usual interesting-ness metrics: support, confidence, lift and p value (Lallich et al. 2006).
2.4 Network analysis
The algorithm to determine expected metabolite level altera-tions (ADEMA) network analyses using mutual information were applied to the metabolite quantification values (Cicek et al. 2013). The network was constructed using the Kyoto Encyclopedia of Genes and Genomes (Kanehisa and Goto
2000; Minoru Kanehisa et al. 2014) and Salway’s work (Sal-way 2014). The ADEMA algorithm evaluates the change in groups of metabolites between concentration data from two experimental groups instead of analyzing metabolite concen-trations one by one. Based on mutual information, the algo-rithm determines whether some metabolites are biomarkers when considered together, and it can predict the direction of the expected change per metabolite depending on the metabolic network topology considered. Various groups of metabolites related to the metabolic pathways involved were compared:
• Taurine, hypotaurine, aspartate, serine, methionine • Aspartate, asparagine, acetate, threonine, NAA • Aspartate, threonine, isoleucine
• Glucose, serine, glycine • Glucose, valine
• Glucose, isoleucine • Glucose, acetate • Glucose, lactate • Valine, lactate, alanine
• Glucose, myo-inositol, ascorbate, glutathione, glycine, glutamate
• Glutamate, histidine, glutamine, 2HG • Aspartate, succinate, fumarate, 2HG • Glutamate, histidine, glutamine, glycine • Glutamate, glycine, creatine
3 Results
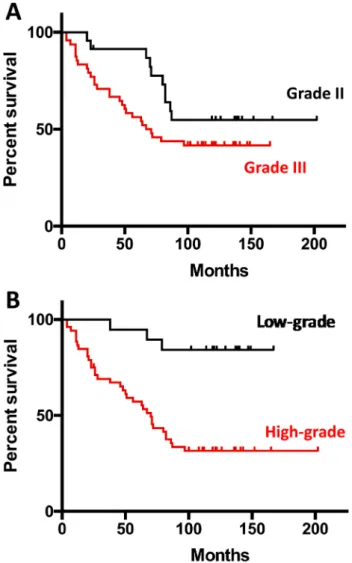
All statistical analysis was done on all oligodendroglio-mas: 72 tissue samples for studying the relationship between genetic mutations and metabolomics and 71 for survival analysis without taking into account the histo-pathological grading of oligodendrogliomas. According to WHO 2016 classification, 19 low-grade and 53 high-grade were included.
For all patients, we measured the concentration of 28 metabolites and also used the ratio between glycerophos-phocholine and phosglycerophos-phocholine (GPC/PC) and total cho-line (chocho-line + GPC + PC) as additional parameters in the statistical analyses.
Figure 1 shows the Kaplan–Meier survival curves accord-ing to WHO 2007 (Fig. 1a) and WHO 2016 (Fig. 1b).
3.1 Impact of genetic mutations on tumor metabolomics
The presence of IDH1 mutation (Fig. 2a) was associated with an elevated concentration for glucose, myo-inositol, GPC, histidine, creatine and 2HG and a low concentration for lactate, serine, glycine, alanine, isoleucine, threonine, aspartate, acetate, methionine, hypotaurine, PC, choline, GSH and glutamate. The accumulation of 2HG, as meas-ured using HRMAS, was strongly dependent on the pres-ence of the IDH1 mutation (p = 1.8 × 10⁻⁷). In the absence
of the IDH1 mutation, the level of 2HG was on the order of 0.42 ± 0.71 nmol/mg, with only three tumors showing levels higher than 1 nmol/mg, whereas in the presence of the IDH1 mutation, the average level of accumulated 2HG in the tissue was found to be more than 2.5 times higher (1.05 ± 1.0 nmol/mg).
The 1p19q codeletion was associated with elevated con-centrations of glucose, myo-inositol, ascorbate, valine, iso-leucine, asparagine, GPC, PC, choline, taurine, histidine, glutamate, glutamine, 2HG and creatine. Alanine, aspar-tate and aceaspar-tate were inversely correlated to the presence of this codeletion.
The presence of MGMT was associated with elevated concentrations of GPC, PC, asparagine, acetate, ascorbate, histidine and 2HG and low levels of glucose, aspartate, glutamate, alanine and hypotaurine.
Glucose and threonine concentrations were elevated for TP53-mutated oligodendrogliomas, and lactate, iso-leucine, asparagine, aspartate, fumarate, methionine, GPC, PC, choline, serine, histidine, glutamate, glutamine and creatine had low rates.
The presence of a PTEN mutation (Fig. 2b) was associ-ated with a rise in alanine, lactate, isoleucine, threonine,
aspartate, methionine, fumarate, PC, choline, serine, hypo-taurine, glycine, GSH and glutamate and a decrease in acetate, NAA, glucose, myo-inositol and creatine and a reduction in glucose, myo-inositol, creatine, acetate and NAA.
The presence of EGFR was associated with a high con-centration for alanine, serine, glycine, lactate, threonine, aspartate, methionine, fumarate, choline, hypotaurine, GSH, glutamate and glutamine and a low concentration for 2HG, creatine, GPC, NAA, glucose and myo-inositol.
3.2 Relationship between genetic mutations and overall survival
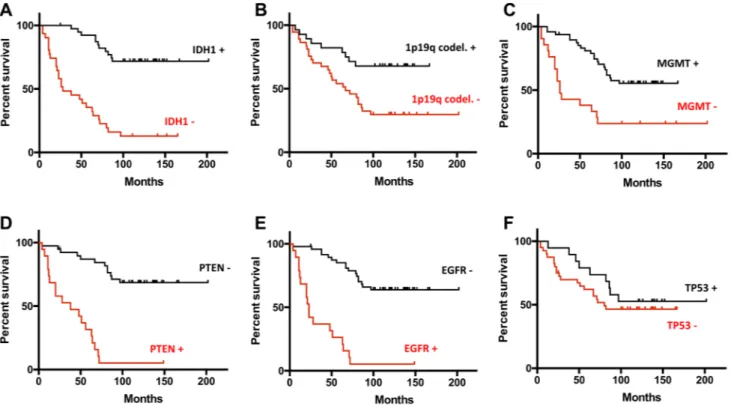
In Fig. 3, Kaplan–Meier survival curves show the relation-ship between genetic mutations and overall survival. ‘28 out of the 71 patients died during the follow-up period (mean,
Fig. 1 Kaplan-Meier survival curves according to WHO 2007 (a) and WHO 2016 (b) classifications: low-grade oligodendrogliomas in black lines and high-grade oligodendrogliomas in red lines
66 ± 34 months; range, 1–125 months). In the univariate sur-vival analysis, all six genetic markers measured on the sam-ples were found as significant prognostic predictors. Pres-ence of a mutation on EGFR and PTEN, which were strongly associated (Chi square test of p = 1.4 × 10⁻¹⁰), increased
the relative risk (RR) (2.675 and 3.078, respectively) of the patients dying. Inversely, the presence of a mutation on IDH1, TP53, 1p/19q codeletion and MGMT methyla-tion reduced the relative risk for the patients (RR = 0.316,
p < 0.0001; RR = 0.902, p = 0.406, RR = 0.457, p = 0.0045;
RR = 0.574, p = 0.0003 respectively). In this patient set we found that the presence of the EGFR mutation is strongly anti-correlated to the presence of the IDH1 mutation (p = 8.9 × 10⁻⁸). The IDH1 mutation also frequently
co-occurred with MGMT methylation (p = 0.0008), TP53 muta-tion (p = 0.005) and 1p/19q codelemuta-tion (p = 0.03).
3.3 Relationship between metabolomics and overall survival
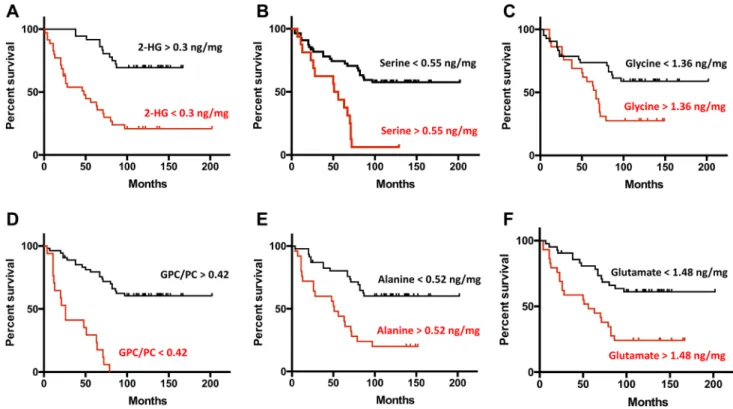
When using the measured concentration of the metabolites as independent continuous variables in the Cox proportional hazards model, 11 out of the 30 metabolite parameters measured were found to be significant prognostic predic-tors. For eight of them (GPC/PC, 2HG, Myo-inositol, NAA, Glycine, Glutamate, Alanine, Serine) the concentrations measured allowed a precise estimate of the relative risks (RR) to be calculated. We also compared patient survival by establishing thresholds (in nmol/mg) for the concentra-tions of each metabolite (Table 1). Increased concentration of 2HG (> 0.3 nmol/mg, RR = 0.396, p < 0.0001), myo-inositol (> 3.12 nmol/mg, RR = 0.415, p = 0.0016), NAA (> 1.35 nmol/mg, RR = 0.438, p = 0.101) and the GPC/ PC ratio (> 0.42 nmol/mg, RR = 0.388, p < 0.0001) were good significant prognostic factors. In contrast, increasing the concentration of serine (> 0.55 nmol/mg, RR = 2.242,
p < 0.0001), glycine (> 1.36 nmol/mg, RR = 1.788, p = 0.0097), glutamate (> 1.48 nmol/mg, RR = 1.991, p = 0.0007) and alanine (> 0.52 nmol/mg, RR = 2.044, p = 0.0001) led to an increased relative risk of death for
patients. When using binary values for the metabolites, we obtained the Kaplan–Meier survival curves shown in Fig. 4.
3.4 Relationship between genomics, metabolomics and overall survival
To summarize the associations between tumor genetic background and the metabolite levels in the tumor tissues, we performed unsupervised data mining using association rules in the entire data set and graphically represented the rules obtained as two networks linked to the overall survival (Fig. 5).
4 Discussion
The high demand of proliferating cells from catabolites in order to meet the increased demand of bioenergetics, maintain homeostasis and generate biomass, produces increased consumption and alterations on the metabolism of two major nutrients, glucose and glutamine. These com-plex metabolic changes occur as a function of the tumor oncogenotype and the microenvironment in different tis-sues. The main objective of the present study was to evalu-ate the relationship between different genetic mutations, tumor metabolism and patient outcome in oligodendro-gliomas in order to find potential metabolic biomarkers to malignancy. In fact, adding biomolecular information led to a better classification of oligodendrogliomas, which is why biomolecular features are now used in WHO 2016 classification (Louis et al. 2016). It allows a better correla-tion with survival. Moreover, the metabolic classificacorrela-tion seems to provide a closer correlation with the patient evo-lution than the histopathological analysis (Erb et al. 2008). In agreement with the literature (Wang et al. 2014; Kong et al. 2015; Ducray et al. 2011; Zou et al. 2013; Cairncross et al. 1998; Smith et al. 2000; Karayan-Tapon et al. 2010; Sanson et al. 2009) the results presented in this study demonstrate that the presence of a mutation on IDH1, TP53, 1p19q codeletion and MGMT methylation slow down cellular metabolism and increase overall sur-vival, particularly with IDH1, which presents a relative risk of 0.316. Since the first report of Parsons et al. (2008), many studies demonstrated that IDH mutations facilitate reduction of α-ketoglutarate to 2HG, reduce nicotinamide adenine dinucleotide phosphate, which is necessary for regeneration of reduced glutathione (Ducray et al. 2011; Dang et al. 2009; Cairns and Mak 2013) and generate com-petitive inhibition for enzymes that regulate DNA methyla-tion and histone demethylamethyla-tions (Siegal 2015). This novel enzymatic activity with overproduction of 2HG does not participate in any known productive metabolic pathway, but does not seem to be an epiphenomena (Koivunen et al.
2012; Losman et al. 2013) and alters cellular genetic and epigenetic programs. The 2HG is involved in oncogenesis through the hypoxia inducible factor 1-α (HIF1-α) in glio-mas and sensitizes tumor cells to chemotherapy, increasing cellular oxidative stress (Wang et al. 2014; Dang et al.
2009; Molenaar et al. 2014). The results reported herein demonstrated several metabolic markers predictive of overall survival and in relation with IDH1 status. The most important are 2HG, GPC, myo-inositol, threonine, alanine, methionine, acetate and glutamate.
Inversely, PTEN and EGFR mutations were associated with up cellular metabolism (glycolysis, lactic acid fer-mentation, amino acid metabolism, lipid metabolism) and
a poor prognosis: increasing the relative risk for death to 3.078 and 2.675, respectively, in accordance with previ-ous reports for the association of these two genes with an adverse prognosis in multiple cancers (de Muga et al.
2010) and gliomas (Altieri et al. 2014; Han et al. 2016). The loss of PTEN function leads to the activation of the AKT/PKB signaling pathway and the activation of HIF1-α, thereby promoting tumor cell growth, survival, migration and neoangiogenesis (Yamada and Araki 2001; Jiang and Liu 2008).
In the present study, we observed that several metabolic markers were in relation with IDH and/or PTEN status (Fig. 5). Among them, six metabolic markers are closely related to overall survival: 2HG, alanine, myo-inositol, gly-cine, glutamate and the GPC/PC ratio (Fig. 4). The relation
between the 2HG level and overall survival confirms the large clinical studies that support the hypothesis that IDH mutations occur early during oncogenesis and subsequently other mutations determine the progression of disease (Ichimura 2012).
Fig. 2 a Association of the level of metabolite accumulation in
oli-godendroglioma tumors and the presence of the IDH1 mutation. The metabolites underlined and written in red and green with an arrows for each one, respectively, indicate the metabolites that are predicted to increase and decrease in oligodendrogliomas, in presence of the IDH1 mutation. The metabolites in blue are present in the mitochon-dria. b Association of the level of metabolite accumulation in oligo-dendroglioma tumors and the presence of the PTEN mutation. The metabolites underlined and written in red and green with an arrows for each one, respectively, indicate the metabolites that are predicted to increase and decrease in oligodendrogliomas in presence of the PTEN mutation. The metabolites in blue are present in the mitochon-dria
◂
Fig. 3 Comparison of the survival rates between groups of patients with different status of genomics markers (a vIDH1, b 1p19q, c MGMT, d PTEN, e EGFR, f TP53) measured in the tumor tissues.
Survival in the presence of the mutation is shown as black lines for genomic aberrations associated to a good prognosis and as red lines for genomic aberrations associated to a poor prognosis and vice versa
Table 1 Univariate survival analysis using genomics markers as binary variables and metabolites concentrations as continuous vari-ables
Parameter Status Relative risk 95% CI P-value
IDH1 + 0.316 0.05–0.3 < 0.0001 1p19q + 0.457 0.15–0.92 0.0045 MGMT + 0.574 0.11–0.53 0.0003 TP53 + 0.902 0.08–0.97 0.406 EGFR + 2.675 3.49–18.64 < 0.0001 PTEN + 3.078 3.51–22.98 < 0.0001 Threshold in nmol/mg GPC/PC > 0.42 0.388 0.027–0.22 < 0.0001 2HG > 0.3 0.396 0.23–0.97 < 0.0001 Myo-inositol > 3.12 0.415 0.554–0.92 0.0016 NAA > 1.35 0.438 0.245–1.03 0.101 Glycine > 1.36 1.788 1.021–1.24 0.0097 Glutamate > 1.48 1.991 1.1–1.953 0.0007 Alanine > 0.52 2.044 1.5–3.26 0.0001 Serine > 0.55 2.242 1.79–15.82 < 0.0001
Myo-inositol, a precursor of phosphatidylinositol, GPC and PC make up the phospholipid membrane involved in cell signaling (Tzika et al. 2007). A high level of GPC is associ-ated with a good prognosis and was observed in low-grade gliomas (Sabatier et al. 1999). The GPC/PC ratio has been reported to positively correlate with survival time and asso-ciated with the expression of the histone deacetylase genes
HDAC1 and HDAC4, influencing tumor aggressiveness in human gliomas (Dali-Youcef et al. 2015).
Glycine, a nonessential amino acid, is a precursor to make proteins, lipid and nucleic acids, and is synthesized through several pathways, principally via intermediate gly-colysis (with serine) and from choline (Giskeødegård et al.
2012). Many cancer cells exhibit increased flux from glucose
Fig. 4 Comparison of the survival rates between groups of patients with different levels of accumulation of six metabolites (a 2HG, b Alanine, c Glycine, d GPC/PC, e Serine, f Glutamate) measured in the tumor tissues
Threonine Myoinositol Choline Glycine Glutamate IDH1 mut 1p/19q codel MGMT met PTEN WT EGFR WT NAA 2HG GPC TP53 mut
A
Methionine Alanine Threonine 2HG GPC Myoinositol Acetate
GSH Glycine Glutamate IDH1 WT 1p/19q no del MGMT WT PTEN
mut EGFR mut
B
Fig. 5 Associations between tumor genetic background and the metabolite levels in the tumor tissues for patients having mutations associated to a good prognosis (a) and a poor prognosis (b)
into serine and glycine biosynthesis (Locasale and Cantley
2010).
Finally, the glutamate–glutamine cycle played a major role in cancer cell metabolism. We have known for some time that cancers used glutamine, whose uptake and metabo-lism are regulated by the MYC oncogene. MYC-transformed cells become addicted to glutamine through increased expression of glutamine transporters and glutamine cata-bolic enzymes (Dang 2010; Lunt and Vander Heiden 2011). Glutamine is the major substrate that is oxidizable by tumor cells (Baggetto 1992) and a major source of nitrogen for nucleotide and amino acid synthesis (Vander Heiden 2011). This amino acid can be used as a precursor for lipid synthe-sis, especially in hypoxic environments.
In conclusion, HRMAS NMR spectroscopy provides accurate information on the metabolomics of oligodendro-gliomas, making it possible to find new biomarkers indica-tive of survival. It enables rapid characterization of intact tissue and could be used as an intraoperative method, open-ing the perspectives of real-time metabolic profilopen-ing duropen-ing surgery and therefore could influence the operative strategy.
Acknowledgments We gratefully acknowledge K. Elbayed for the Mat-lab scripts that he developed to quantify the metabolites. The Mat-laboratory staff of the Tumor Bio-bank (Centre de Ressources Biologiques) of Strasbourg University Hospitals are also gratefully acknowledged for their technical assistance.
Author contributions CB: writer, interpretation of data; MGK: writer, statistical analysis; AEC: network analysis; FMM: NMR data acquisi-tion, spectra analysis; NDY: participation of biochemical construc-tion of network model, manuscript review; MP: spectra analysis; PS: statistical analysis; RH: IDH1 analysis; NEW: genomics analysis; BL: pathological analysis; MPC: pathological analysis; RS: patient onco-logical management; FP: patient surgical management; GN: patient radiotherapy management, manuscript review; IJN: writer, experimen-tal design, data analysis.
Data availability The datasets generated during and/or analysed during
the current study are available through EMBL-EBI MetaboLights, with the accession number MTBLS869.
Compliance with ethical standards
Conflicts of interest The authors declare that they have no conflict of interest.
Ethics approval The Ethics Committee of Strasbourg approved the study (No. 100/2003, 09.12.2003 and No. 2013-37, 12.11.2013).
Informed consent A written informed consent was obtained from all the included patients.
References
Baggetto, L. G. (1992). Deviant energetic metabolism of glycolytic cancer cells. Biochimie, 74(11), 959–974.
Banan, R., & Hartmann, C. (2017). The new WHO 2016 classification of brain tumors-what neurosurgeons need to know. Acta
Neu-rochirurgica, 159(3), 403–418. https ://doi.org/10.1007/s0070 1-016-3062-3.
Battini, S., Imperiale, A., Taïeb, D., Elbayed, K., Cicek, A. E., Sebag, F., et al. (2016). High-resolution magic angle spinning (1)H nuclear magnetic resonance spectroscopy metabolomics of hyper-functioning parathyroid glands. Surgery, 160(2), 384–394. https ://doi.org/10.1016/j.surg.2016.03.002.
Cairncross, J. G., Ueki, K., Zlatescu, M. C., Lisle, D. K., Finkelstein, D. M., Hammond, R. R., et al. (1998). Specific genetic predic-tors of chemotherapeutic response and survival in patients with anaplastic oligodendrogliomas. Journal of the National Cancer
Institute, 90(19), 1473–1479.
Cairns, R. A., & Mak, T. W. (2013). Oncogenic isocitrate dehydroge-nase mutations: Mechanisms, models, and clinical opportunities.
Cancer Discovery, 3(7), 730–741. https ://doi.org/10.1158/2159-8290.cd-13-0083.
Chen, R., Ravindra, V. M., Cohen, A. L., Jensen, R. L., Salzman, K. L., Prescot, A. P., et al. (2015). Molecular features assist-ing in diagnosis, surgery, and treatment decision makassist-ing in low-grade gliomas. Neurosurgical Focus, 38(3), E2. https ://doi. org/10.3171/2015.1.focus 14745 .
Cicek, A. E., Bederman, I., Henderson, L., Drumm, M. L., & Ozsoyo-glu, G. (2013). ADEMA: An algorithm to determine expected metabolite level alterations using mutual information. PLoS
Com-putational Biology, 9(1), e1002859. https ://doi.org/10.1371/journ al.pcbi.10028 59.
Dali-Youcef, N., Froelich, S., Moussallieh, F.-M., Chibbaro, S., Noël, G., Namer, I. J., et al. (2015). Gene expression mapping of histone deacetylases and co-factors, and correlation with survival time and 1H-HRMAS metabolomic profile in human gliomas. Scientific
Reports, 5, 9087. https ://doi.org/10.1038/srep0 9087.
Dang, C. V. (2010). Glutaminolysis: Supplying carbon or nitrogen or both for cancer cells? Cell Cycle (Georgetown, Tex.), 9(19), 3884–3886. https ://doi.org/10.4161/cc.9.19.13302 .
Dang, L., White, D. W., Gross, S., Bennett, B. D., Bittinger, M. A., Driggers, E. M., et al. (2009). Cancer-associated IDH1 mutations produce 2-hydroxyglutarate. Nature, 462(7274), 739–744. https ://doi.org/10.1038/natur e0861 7.
de Muga, S., Hernández, S., Agell, L., Salido, M., Juanpere, N., Lor-enzo, M., et al. (2010). Molecular alterations of EGFR and PTEN in prostate cancer: Association with high-grade and advanced-stage carcinomas. Modern Pathology: An Official Journal of the
United States and Canadian Academy of Pathology Inc, 23(5),
703–712. https ://doi.org/10.1038/modpa thol.2010.45.
Dreier, L., & Wider, G. (2006). Concentration measurements by PUL-CON using X-filtered or 2D NMR spectra. Magnetic Resonance
in Chemistry, 44, S206–S212. https ://doi.org/10.1002/mrc.1838. Ducray, F., Idbaih, A., Wang, X.-W., Cheneau, C., Labussiere, M., &
Sanson, M. (2011). Predictive and prognostic factors for gliomas.
Expert Review of Anticancer Therapy, 11(5), 781–789. https ://doi. org/10.1586/era.10.202.
Erb, G., Elbayed, K., Piotto, M., Raya, J., Neuville, A., Mohr, M., et al. (2008). Toward improved grading of malignancy in oligodendro-gliomas using metabolomics. Magnetic Resonance in Medicine,
59(5), 959–965. https ://doi.org/10.1002/mrm.21486 .
Giskeødegård, G. F., Lundgren, S., Sitter, B., Fjøsne, H. E., Postma, G., Buydens, L. M. C., et al. (2012). Lactate and glycine-potential MR biomarkers of prognosis in estrogen receptor-positive breast
cancers. NMR in Biomedicine, 25(11), 1271–1279. https ://doi. org/10.1002/nbm.2798.
Griffin, J. L., & Shockcor, J. P. (2004). Metabolic profiles of can-cer cells. Nature Reviews Cancan-cer, 4(7), 551–561. https ://doi. org/10.1038/nrc13 90.
Han, F., Hu, R., Yang, H., Liu, J., Sui, J., Xiang, X., et al. (2016). PTEN gene mutations correlate to poor prognosis in glioma patients: A meta-analysis. OncoTargets and Therapy, 9, 3485–3492. https :// doi.org/10.2147/ott.s9994 2.
Hastie, T., Tibshirani, R., & Friedman, J. (2009). Unsupervised learn-ing in the elements of statistical learnlearn-ing. Unsupervised learnlearn-ing
in the elements of statistical learning (pp. 487–501). New York:
Springer.
Ichimura, K. (2012). Molecular pathogenesis of IDH mutations in gliomas. Brain Tumor Pathology, 29(3), 131–139. https ://doi. org/10.1007/s1001 4-012-0090-4.
Imperiale, A., Elbayed, K., Moussallieh, F.-M., Reix, N., Piotto, M., Bellocq, J.-P., et al. (2013). Metabolomic profile of the adre-nal gland: From physiology to pathological conditions.
Endo-crine-Related Cancer, 20(5), 705–716. https ://doi.org/10.1530/ erc-13-0232.
Jiang, B.-H., & Liu, L.-Z. (2008). PI3 K/PTEN signaling in tumorigen-esis and angiogentumorigen-esis. Biochimica et Biophysica Acta, 1784(1), 150–158. https ://doi.org/10.1016/j.bbapa p.2007.09.008. Jullian N., Afshar M (2008) Current Computer-Aided Drug Design.
In Current Computer-Aided Drug Design (Vol. 4, pp. 35–45). Kanehisa, M., & Goto, S. (2000). KEGG: Kyoto encyclopedia of genes
and genomes. Nucleic Acids Research, 28(1), 27–30.
Kanehisa, Minoru, Goto, S., Sato, Y., Kawashima, M., Furumichi, M., & Tanabe, M. (2014). Data, information, knowledge and prin-ciple: Back to metabolism in KEGG. Nucleic Acids Research,
42(Database issue), D199–D205. https ://doi.org/10.1093/nar/ gkt10 76.
Karayan-Tapon, L., Quillien, V., Guilhot, J., Wager, M., Fromont, G., Saikali, S., et al. (2010). Prognostic value of O6-methylguanine-DNA methyltransferase status in glioblastoma patients, assessed by five different methods. Journal of Neuro-Oncology, 97(3), 311–322. https ://doi.org/10.1007/s1106 0-009-0031-1.
Koivunen, P., Lee, S., Duncan, C. G., Lopez, G., Lu, G., Ramkissoon, S., et al. (2012). Transformation by the (R)-enantiomer of 2-hydroxyglutarate linked to EGLN activation. Nature, 483(7390), 484–488. https ://doi.org/10.1038/natur e1089 8.
Kong, D.-S., Kim, H. R., Choi, Y.-R., Seol, H. J., Lee, J.-I., & Nam, D.-H. (2015). Prognostic impact of molecular phenotype in patients with recurrent anaplastic glioma treated with prolonged administration of temozolomide. Journal of Clinical
Neurosci-ence: Official Journal of the Neurosurgical Society of Australasia, 22(9), 1425–1429. https ://doi.org/10.1016/j.jocn.2015.02.036. Liquiere, M., & Sallantin, J. (1998). Structural Machine Learning With
Galois Lattice and Graphs. ICML’98: 5th International
Confer-ence on Machine Learning Madison., 98, 305–313.
Locasale, J. W., & Cantley, L. C. (2010). Altered metabolism in cancer.
BMC biology, 8, 88. https ://doi.org/10.1186/1741-7007-8-88. Losman, J.-A., Looper, R. E., Koivunen, P., Lee, S., Schneider, R. K.,
McMahon, C., et al. (2013). (R)-2-hydroxyglutarate is sufficient to promote leukemogenesis and its effects are reversible. Science
(New York, N.Y.), 339(6127), 1621–1625. https ://doi.org/10.1126/ scien ce.12316 77.
Louis, D. N., Ohgaki, H., Wiestler, O. D., Cavenee, W. K., Burger, P. C., Jouvet, A., et al. (2007). The 2007 WHO classification of tumours of the central nervous system. Acta Neuropathologica,
114(2), 97–109. https ://doi.org/10.1007/s0040 1-007-0243-4. Louis, D. N., Perry, A., Reifenberger, G., von Deimling, A.,
Figarella-Branger, D., Cavenee, W. K., et al. (2016). The 2016 World Health Organization Classification of Tumors of the Central Nervous
System: A summary. Acta Neuropathologica, 131(6), 803–820. https ://doi.org/10.1007/s0040 1-016-1545-1.
Lunt, S. Y., & Vander Heiden, M. G. (2011). Aerobic glycolysis: Meeting the metabolic requirements of cell proliferation. Annual
Review of Cell and Developmental Biology, 27, 441–464. https :// doi.org/10.1146/annur ev-cellb io-09291 0-15423 7.
Molenaar, R. J., Radivoyevitch, T., Maciejewski, J. P., van Noorden, C. J. F., & Bleeker, F. E. (2014). The driver and passenger effects of isocitrate dehydrogenase 1 and 2 mutations in oncogenesis and survival prolongation. Biochimica et Biophysica Acta, 1846(2), 326–341. https ://doi.org/10.1016/j.bbcan .2014.05.004.
Mörén, L., Bergenheim, A. T., Ghasimi, S., Brännström, T., Johansson, M., & Antti, H. (2015). Metabolomic screening of tumor tissue and serum in glioma patients reveals diagnostic and prognostic information. Metabolites, 5(3), 502–520. https ://doi.org/10.3390/ metab o5030 502.
Nguyen, A., Legrain, M., Noel, G., Coca, A., Meyer Ea, N., Schott, R., et al. (2015). An innovative fluorescent semi-quantitative methyl-ation-specific PCR method for the determination of MGMT pro-moter methylation is reflecting intra-tumor Heterogeneity. Current
Cancer Drug Targets, 15(7), 624–640.
Parsons, D. W., Jones, S., Zhang, X., Lin, J. C.-H., Leary, R. J., Angenendt, P., et al. (2008). An integrated genomic analysis of human glioblastoma multiforme. Science (New York), 321(5897), 1807–1812. https ://doi.org/10.1126/scien ce.11643 82.
R Development Core Team. (2008). R: A language and environment
for statistical computing. Vienna: R Foundation for Statistical
Computing. ISBN 3-900051-07-0.
Sabatier, J., Gilard, V., Malet-Martino, M., Ranjeva, J. P., Terral, C., Breil, S., et al. (1999). Characterization of choline compounds with in vitro 1H magnetic resonance spectroscopy for the dis-crimination of primary brain tumors. Investigative Radiology,
34(3), 230–235.
Salway, J. G. (2014). Metabolism at a glance (3rd ed.). Malden (MI)): Blackwell Publishing.
Sanson, M., Marie, Y., Paris, S., Idbaih, A., Laffaire, J., Ducray, F., et al. (2009). Isocitrate dehydrogenase 1 codon 132 mutation is an important prognostic biomarker in gliomas. Journal of
Clinical Oncology: Official Journal of the American Society of Clinical Oncology, 27(25), 4150–4154. https ://doi.org/10.1200/ jco.2009.21.9832.
Siegal, T. (2015). Clinical impact of molecular biomarkers in glio-mas. Journal of Clinical Neuroscience: Official Journal of the
Neurosurgical Society of Australasia, 22(3), 437–444. https ://doi. org/10.1016/j.jocn.2014.10.004.
Smith, J. S., Perry, A., Borell, T. J., Lee, H. K., O’Fallon, J., Hosek, S. M., et al. (2000). Alterations of chromosome arms 1p and 19q as predictors of survival in oligodendrogliomas, astrocytomas, and mixed oligoastrocytomas. Journal of Clinical Oncology: Official
Journal of the American Society of Clinical Oncology, 18(3),
636–645. https ://doi.org/10.1200/jco.2000.18.3.636.
Lallich, S., Teytaud, O., Prudhomme, E., (2006). Association rule inter-estingness: Measure and statistical validation. In F. J. Guillet & H. J. Hamilton (Eds.), Quality measures in data mining (p. 25). Berlin: Springer.
Tzika, A. A., Astrakas, L., Cao, H., Mintzopoulos, D., Andronesi, O. C., Mindrinos, M., et al. (2007). Combination of high-resolution magic angle spinning proton magnetic resonance spectroscopy and microscale genomics to type brain tumor biopsies.
Interna-tional Journal of Molecular Medicine, 20(2), 199–208.
Vander Heiden, M. G. (2011). Targeting cancer metabolism: A thera-peutic window opens. Nature Reviews Drug Discovery, 10(9), 671–684. https ://doi.org/10.1038/nrd35 04.
Wang, X.-W., Ciccarino, P., Rossetto, M., Boisselier, B., Marie, Y., Desestret, V., et al. (2014). IDH mutations: Genotype-phe-notype correlation and prognostic impact. BioMed Research
International, 2014, 540236. https ://doi.org/10.1155/2014/54023 6.
Wirsching, H.-G., & Weller, M. (2016). The role of molecular diagnos-tics in the management of patients with gliomas. Current
Treat-ment Options in Oncology, 17(10), 51. https ://doi.org/10.1007/ s1186 4-016-0430-4.
Wishart, D. S., Jewison, T., Guo, A. C., Wilson, M., Knox, C., Liu, Y., et al. (2013). HMDB 3.0–the human metabolome database in 2013. Nucleic Acids Research, 41(Database issue), D801–D807. https ://doi.org/10.1093/nar/gks10 65.
Yamada, K. M., & Araki, M. (2001). Tumor suppressor PTEN: Modu-lator of cell signaling, growth, migration and apoptosis. Journal
of Cell Science, 114(Pt 13), 2375–2382.
Zou, P., Xu, H., Chen, P., Yan, Q., Zhao, L., Zhao, P., et al. (2013). IDH1/IDH2 mutations define the prognosis and molecular pro-files of patients with gliomas: A meta-analysis. PLoS ONE, 8(7), e68782. https ://doi.org/10.1371/journ al.pone.00687 82.
Publisher’s Note Springer Nature remains neutral with regard to jurisdictional claims in published maps and institutional affiliations.
Affiliations
Caroline Bund1,2 · Mariana Guergova‑Kuras3 · A. Ercument Cicek4,5 · François‑Marie Moussallieh1 ·
Nassim Dali‑Youcef6,7 · Martial Piotto8 · Pilar Schneider3 · Rémy Heller9 · Natacha Entz‑Werle10 · Benoît Lhermitte11 · Marie‑Pierre Chenard11 · Roland Schott12 · François Proust13 · Georges Noël14 · Izzie Jacques Namer1,2,15
1 Service de Biophysique et Médecine Nucléaire, Hôpital de Hautepierre, Hôpitaux Universitaires de Strasbourg, 1, Avenue Molière, 67098 Strasbourg Cedex 09, France 2 ICube, Université de Strasbourg/CNRS, UMR 7357,
Strasbourg, France
3 Ariana Pharmaceuticals SA, Paris, France
4 Lane Center of Computational Biology, School of Computer Science, Carnegie Mellon University, Pittsburgh, USA 5 Computer Engineering Department, Bilkent University,
Ankara, Turkey
6 IGBMC (Institut de Génétique et de Biologie Moléculaire et Cellulaire)/CNRS UMR 7104/INSERM U964, Université de Strasbourg, Strasbourg, France
7 Laboratoire de Biochimie et Biologie Moléculaire, Nouvel Hôpital Civil, Hôpitaux Universitaires de Strasbourg, Strasbourg, France
8 Bruker Biospin, Wissembourg, France
9 Laboratoire de Microbiologie et Biologie Moléculaire, Hôpitaux Civils de Colmar, Colmar, France
10 Service de Pédiatrie Onco-hématologie, Hôpital de Hautepierre, Hôpitaux Universitaires de Strasbourg, Strasbourg, France
11 Service d’Anatomie Pathologique, Hôpital de Hautepierre, Hôpitaux Universitaires de Strasbourg, Strasbourg, France 12 Departement d’Oncologie Médicale, Centre Paul Strauss,
Strasbourg, France
13 Service de Neurochirurgie, Hôpital de Hautepierre, Hôpitaux Universitaires de Strasbourg, Strasbourg, France
14 Departement de Radiothérapie, Centre Paul Strauss, Strasbourg, France
15 FMTS (Fédération de Médecine Translationnelle de Strasbourg), Faculté de Médecine, Strasbourg, France