SOLVING THE CLASSIFICATION PROBLEM OF CIRCULAR METAL OBJECTS WITH ENGRAVED CHARACTERS BY IMAGE PROCESSING METHODS
1Mahmut Sami YASAK , 2Hasan Erdinç KOÇER
1Selcuk University, The Graduate School of Natural and Applied Science, The Degree of Master of Science in Mechatronics Engineering, Konya, TURKEY
2Selcuk University, Faculty of Technology, Electrical and Electronics Engineering Department, Konya, TURKEY 1[email protected], 2 [email protected]
(Geliş/Received: 01.07.2019; Kabul/Accepted in Revised Form: 06.08.2019)
ABSTRACT: In this study, two different solution ways have been developed for the problem of classification of industrial small circular metal objects on the surfaces of engraved metal. It is the first proposed solution to perform the pattern matching with XOR operator by extract the character region of the circular metal objects as a pre-process, making the model of the Daugman’s Rubber Sheet Model (DRSM) and performing feature extraction. As a result, obtained that average processing time is 69,72 milliseconds and 0,9398 accuracy rate in the first proposed solution. The second solution is the optical character recognition (OCR) on the circular metal objects that to be realized character region detection and character segmentation as a result of the Maximal Stabil Extremal Region (MSER) and Stroke Width Transform (SWT) algorithms. Character recognition realized by using the model of Convolutional Neural Network (CNN) class which is a deep machine learning approach of artificial intelligence. The character recognition problem of the circular metal objects provided at the same time solved the problem of object classification. As a result, obtained that average processing time is 1,596 second and 0,9719 accuracy rate in the second proposed solution.
Key Words: Object Character Recognition Problem, Object Classification Problem, Convolutional Neural Network, Machine Learning, XOR Pattern Matching, Daugman’s Rubber Sheet Model, Circular Hough Transform, Maximal Stabil Extremal Region, Stroke Width Transform, Image Processing
Oyma Karakterlere Sahip Dairesel Metal Cisimlerin Sınıflandırma Probleminin Görüntü İşleme Yöntemleri İle Çözümü
ÖZ: Bu çalışmada, endüstriyel üretim olan dairesel küçük çaplı metal cisimlerin yüzeyleri üzerine oyma işlemi gerçekleştirilmiş karakterlere göre sınıflandırılması problemi için 2 farklı çözüm yolu geliştirilmiştir. Dairesel metal cisimlerin görsellerinin ön aşama olarak karakter bölgesinin çıkartılıp, Daugman’s Rubber Sheet (DRSM) modeli haline getirilmesi ve özellik çıkarımı gerçekleştirilerek, XOR operatörü ile şablon eşleştirme gerçekleştirilmesi önerilen ilk çözüm yoludur. İlk önerilen yöntemin sonucunda, ortalama işlem süresi 69,72 milisaniye ve 0,9398 doğruluk oranı başarım parametreleri olarak elde edilmiştir. İkinci çözüm yolu, dairesel metal cisimler üzerindeki karakterlerin Maximally Stabil Extremal Region (MSER) ve Stroke Width Transform (SWT) algoritmaları sonucu karakter bölgesi tespiti ve karakter segmentasyonu gerçekleştirilerek yapay zekanın derin öğrenme yaklaşımlarından Convolution Neural Network (CNN) sınıfı tasarlanan model ile karakter tanınması gerçekleştirilmiştir. Karakter tanınması sağlanan dairesel metal cisimlerin aynı zamanda nesne sınıflandırma problemi çözülmüştür. İkinci olarak önerilen yöntemde ise, ortalama işlem süresi 1,596 saniye ve 0,919 doğruluk oranı başarım parametreleri olarak elde edilmiştir.
Anahtar Kelimeler: Nesne Karakter Tanıma Problemi, Nesne Sınıflandırma Problemi, Evrişimsel Sinir Ağları, Makine Öğrenmesi, XOR Şablon Eşleştirme, Daugman’s Rubber Sheet Modeli, Dairesel Hough Dönüşümü, Maksimum Kararlı Ekstrimal Bölgeler, Kontür Genişliği Dönüşümü, Görüntü İşleme
INTRODUCTION
Image processing algorithms for object detection, object identification, object classification, and object tracking problems and artificial intelligence algorithms in computer vision are frequently used to solve these problems. The problem of recognizing objects, solving speed and success precision factors, in other words, more successful methods are continuously developed. The object classification algorithms used for general purpose are fast and accurate and can recognize a wide variety of objects.
Convolutional Neural Networks (CNN), which is developed as one of the Neocognitron is defined by Fukushima that classes of hierarchical multilayered deep neural networks (Fukushima, 1980). YOLOv2 (YOLO-You Only Look Once), which is frequently used for the object classification problem, or YOLO9000 algorithm with another name, can classify 9000 class objects, it can estimate the real-time changing frames of objects in the VOC metric classification by 73.4% mAP (mean Average Precision - mean Average Sensitivity) (Redmon and Farhadi, 2017). The more advanced YOLOv3 algorithm uses COCO datasets, It has solved the problem of object classification on images having of 51.5% mAP in the COCO mAP metric classification with a resolution of 320x320 in 22 ms (Redmon and Farhadi, 2019). YOLO algorithms with high speed and accuracy rates for classification are trained with images with different data sets to solve problems in different areas. For example; By adding Dense layers to the YOLOv3 algorithm used to classify the real-time maturity of apples in the orchards, apple maturity in the 3000x3000 resolution images with an accuracy of 81.7% was estimated (Tian et al., 2019).
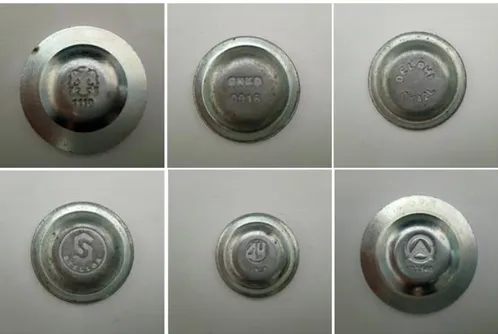
In this study, the classification problem according to the characters on the circular metal objects produced in the industrial environment is presented with two solutions. Circular metal objects have different diameters with respect to shape and are approximately 27.85 mm to 38 mm in diameter. The height varies between 6.07 mm and 6.90 mm, also height values for the flash section located around the body is ranges from approximately 1.90 mm to 3 mm. These measurements have been made by Euroricambi electronic digital caliper measuring device. On the surface of circular metal objects include expressions or characters (letter, number, symbol, punctuation, etc.) that have many purposes, such as brand, model and serial number, to be classified as shown in Figure 1.
These characters are engraved on their surface. The engraving process was carried out by pressing the press machine with certain molds/seals on circular metal objects. As a result of this non-sensitive pressing, the characters are not markedly engraved on the metal surface.
The industrial camera device is used for sampling images of circular metal objects. The visuals obtained with the industrial camera device are expressed as visual results of the camera. Obtained images, image processing algorithms and artificial intelligence fields of CNN with deep learning classes, specified the classification index according to the engraved characters on the metal surfaces, solved by the following methods.
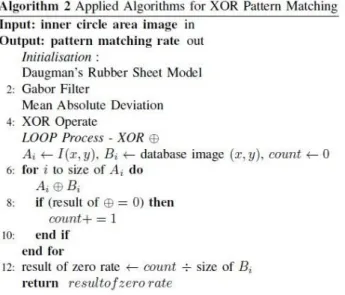
XOR Pattern Matching method is the first method applied to object classification problem in the image processing process. As a priority for this method, respectively, to be applied of Laplace of Gaussian (LoG) filter (Marr and Hildreth, 1980) to the visual results of the camera, Canny (Canny, 1986) edge detection algorithm, Circular Hough Transform (CHT) (Lam and Yuen, 1996) algorithm, extraction of Daugman's Rubber Sheet Model (DRSM) (Daugman, 1997) of obtained image, to be applied of Gabor Filter (GF) (Gabor, 1946) and using the phase image as a result, extraction of Average Absolute Deviation (AAD) of obtained image that showing normalized the image and realized feature extraction. These matrix operations, respectively, Thresholding transform, matrix transposition, an image in order to extend the horizontal alignment from the size 99x750 to 1x74250. This obtained matrix space has uploaded to the database to be paired later for each image to be sampled, thus, the priority processes are completed. For each new raw image taken into the object classification problem, the primary operations are repeated and the XOR operator is processed with each matrix space in the database. Accessible the ratio of logical "1" and "0" values obtained after the XOR operation process located. The ratio of the binary value "0" in the image determines the ratio of the pattern matching. The object classification problem has been solved by matching the pattern name in the database with the highest pattern matching rate. You can see the results in Table 2.
Pretreatment methods for the Optical Character Recognition (OCR) method, which is the second method used in image processing are, respectively, to be applied of LoG Filter, Canny edge detection algorithm and finally CHT algorithm. The characters on the circular metal surfaces are located in the center of the objects and are at a certain height of the objects. The character region expression for the characters in this section will be used. In addition, the visual results of the camera were taken according to these criteria in order to find the character region. According to the results obtained from the applied of CHT algorithm for finding the character area of the identified objects, 3 different circle diameters were obtained. The region within the smallest or innermost circle was found to be the front character region of the circular metal surfaces. To find clearly the characters region and characters segmentation of the extracted pre-character region images, respectively, to be applied of Sharpen Filter (SF), Maximally Stable Extremal Regions (MSER) (Mikolajczyk et al., 2005) algorithm and Stroke Width Transform (SWT)
(Epshtein et al., 2010) algorithm . The MSER and SWT algorithms applied for the situations where the
characters are in the circular, inverse, or polar plane alignment yielded successful results. Character images obtained as a result of character segmentation are made ready for OCR processing. Designed a CNN model from deep learning classes for OCR processing and the model trained with reproducing obtained character images and using EMNIST (Cohen et al., 2017) dataset. The trained model applied to character images and it predicted the characters. For obtained results of output layer (softmax-dense layer-classification layer) of this model. Thus, the solution of optical character recognition for the classification problem of circular metal objects constitutes the second method of this study.
RELATED WORKS AND LITERATURE RESEARCH
XOR pattern matching approach
The template matching method, which is another approach performed by image processing methods for object classification problem, consists of the basis of decision-making based on the matching
percentages by recording the main images as the template as a template and processing them with the images for matching.
In Bala and Tajinder work, solved the problem of object classification or the problem of Content-Based Image Retrieval (CBIR) (Subrahmanyam et al., 2013) with a proposition called HSV (Hue Saturation Value) histogram and a local text on XOR pattern (LTxXORP) (Bala and Tajinder, 2016). The images obtained from the HSV information were navigated with the matrix with the determined structural component using the scale invariant feature transform (SIFT) (Heikkila et al., 2009) method to develop the method of the Local Binary Pattern (LBF) (Ojala et al., 1996) and to obtain the LTxXORP value.
In another study developed by Chawla and Oberoi, that provides solutions to problems such as human discrimination or human identity within the object classification problem, the human eye iris layer was visualized by using the images, respectively, by the image of DRSM (Daugman, 2003), to be applied GF. The resulting image is converted to a binary image and the images in the database are processed by the XOR operator. A mating relationship is established with Hamming distance data. In this study using CASIA data, the average matching time was solved in 133.7 seconds and the human identification problem was determined by the ratio of hamming distance to 0.3486 (Chawla and Oberoi, 2011).
Optical character recognition approach
In order to solve the object classification problem, OCR approach consists of image processing methods, character area detection and character segmentation preprocesses.
A sample study has carried out the regional determination of characters on natural images using the geometry and contour information of the edges-enhanced MSER algorithm for the problem of detection of the character region (Huizhong et al., 2011). In that study, using the combination of Canny edge finding operator and MSER algorithm, it has solved the character zone and segmentation problem of relatively small character and fuzzy images on the ICDAR 2003 and 2005 datasets with a 60% accuracy, metric of f is 66% which is a combination of precision and best match rate of and 60% best match ratio.
In another study, that have brought solutions for the character recognition problem, different fonts, font thickness, font geometry, font colors, text, font size, text blurring, such as challenging images. By combining MSER and adaptive thresholding methods, a solution was developed for character segmentation, and non-textual shapes or objects were identified and taken out of the visual (Gonzalez et al., 2012). To distinguish between non-text objects and text characters, from the classifiers based on the Support Vector Machine (SVM) (Chapelle et al., 1999), Mean Difference Feature (MDF) (Hanif and Prevost, 2009), Standart Deviation (SD) and Histograms of Oriented Gradient (HOG) (Dalal and Triggs, 2005) methods were used. By applying work on ICDAR 2003 data sets, it solved the problem of character area detection and character segmentation with an 81% accuracy, metric of f is 67% which is a combination of precision and best match rate of and 57% best match ratio.
A contrast-enhanced MSER algorithm is applied for character segmentation, and in another study, the problem of character-zone detection with the application of the Stroke Width Transform (SWT) algorithm, methods for the detection and elimination of non-text objects in geometric constraints are presented (Li and Lu, 2012). Firstly, the character region of the images with fuzzy characters was performed with the contrast-enhanced MSER algorithm developed for the blurred state of the character region obtained by the basic MSER algorithm (Matas et al., 2004). Secondly, the non-text objects were visualized after the geometric restriction operation using the parameters determined according to the character dimensions and saturation values between 0.3mm-3mm (3-30 pixel) and the aspect ratio used in Zhao study (Zhao et al., 2011). Finally, in order to analyze the alignment of the texts, the problem of character area detection was solved by using to applied of the skeleton filter of the characters by using the algorithm (Shivakumara et al., 2011) study using the contour width of the texts. By applying work on ICDAR 2003 data sets, it solved the problem of character area detection and character segmentation with
a 59% accuracy, metric of f is 59% which is a combination of precision and best match rate of and 59% best match ratio, and solved the character segmentation problem.
In another study for character zone detection and character recognition problems for real-time and low-contrast images, low-contrast areas are scanned for detection of the character region. This method is called difficult regions (Extremal Region), the characters in the region of the outside pixels RGB and HSI values, the region itself is higher than the RGB and HSI values have been introduced (Neumann and Matas, 2012). At this stage, two types of classification criteria are indicated. Firstly, the binary image obtained by the efficient threshold value is counted with 2x2 pixel patterned Eular Counter (Pratt, 2001), and it is determined that the topological properties of image are obtained using Real AdaBoost (Schapire and Singer, 1999) classifier is one of the decision tree/classifier that uses parameters such as aspect ratio and compactness. Secondly, the topological feature visualization was obtained by using the Radial Basis Function (RBF) (Müller et al., 2001) method from the classifiers based on SVM. The comparison of the detected secondary visual properties with the RGB and HSI results resulted in the problem of character region extraction in low contrast regions. By applying work on ICDAR 2003 data sets, it solved the problem of character area detection and character segmentation with a 73.1% accuracy, metric of f is 68.7% which is a combination of precision and best match rate of and 64.7% best match ratio, and solved the character segmentation problem.
Convolutional neural network approach
The CNN deep learning algorithm, which is extremely useful for object classification problem, is successfully used in the problem of defining characters such as optical characters and handwriting.
In a sample study developed by Zhou and et al., one of the CNN classes developed to find the visual region of the characters is introduced to the model called PVANet2x, the Fully Convolution Network (FCN) (Long et al., 2015) model. For the design of the model, the dimensions of the character regions in the image and the geometry parameters of the character regions are evaluated, 4 Conv layer + 3 Unpooling layer + FC layer + 4 classification value model is created. Using the ICDAR 2015 data set for the training of the model, it has also solved the problem of character zone detection with the accuracy of 83.27% in the ICDAR metric classification, the metrics ratio is 80.72%, the combination of precision and best match rate is 78.33% (Zhou et al., 2017).
In Xie and et al. study, for the problem of character-zone detection, we developed the algorithm of the Feature Pyramid Network (FPN) (Ma et al., 2018) from the CNN class, which was inspired by the reinforcement algorithm (He et al., 2017) to introduce the Supervised Pyramid Context Network (SPCNET) algorithm (Xie. et al., 2018). The structure of the model is multilayered and consists of respectively, FPN structure layer + the text context classifier module which they develop in their work for pre-classification + mask RCNN model. The ResNet50 model is used for the Mask RCNN model, using the ICDAR 2015 data set to determine the character region solved with the accuracy of 88.7% in the ICDAR metric classification, the metrics ratio of 87.2%, the combination of precision and best match rate is 85.8%.
MATERIAL AND METHODS
Classification with XOR pattern matching
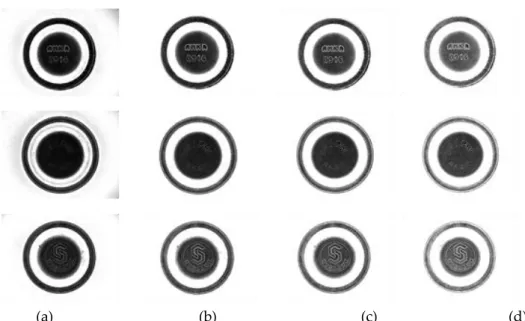
The results of the Dark-Field Ring IR light source selected for visualization of the circular metal surfaces according to the parameters generated for the purpose of obtaining the circular dimensions and the characters are shown in Figure 2. According to the ratio of the camera results obtained under different light intensities to the ratio of the circle diameters, the exposure time of the light source was determined as 10,000 milliseconds (ms).
(a) (b) (c) (d)
Figure 2. Visual results of the camera: (a) result image of setting exposure time as 7 ms, (b) exposure time as 10 ms, (c) exposure time as 12 ms, (d) exposure time as 15 ms
In cases where the light intensity is less than or equal to 7 ms, the edge contours of the circular metal objects appear to be better, but the appearance of the characters becomes very fuzzy, and the character area detection problem is not successful. In the case of a light intensity of 15 ms and above, but the character contour of the circle appears to be better, and the contour of the circular metal objects becomes more blurred. The main purpose of the detection of edge contours is that the character region must be very specific in order to obtain an efficient result to applied of MSER algorithm. Therefore, the images obtained in the visual results of the camera, as seen in Figure 2, should be cut out of the character area in the most inner circle, and the non-character regions should be eliminated by visual exclusion. In the section Finding the circle diameters, which are preprocessed for the determination of the character region.
Finding circle diameters - solving localization problem
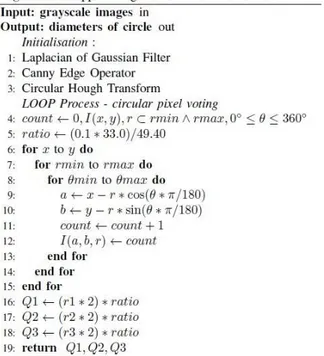
Grayscale images of 800x600 pixels were prepared and the necessary steps were taken to find the circular diameters of circular metal objects in Appendix shown as Figure 1.
Firstly, the input image was softened and the noise on the image was tried to be reduced and the Laplace of Gausian (LoG) (Marr and Hildreth, 1980) filter was used to sharpen the edge contours of the circular metal object in the image. LoG filter pixels are calculated with the following equation.
(1)
In equation (1), where (x,y) are pixels of input images,
is standard deviation value. Set = 0.4 value of Gaussian Filter, Laplacian Filter is applied to calculate the edge information in the image.
Secondly, using the Canny edge detection algorithm to apply the image to the LoG filter, the edge contours of the image are detected. Canny edge pixels are calculated with the following equations.
(2a) (2b) (2c)
(2d)
(2e)
In equation (2a), where f(x) is convolution filter for noise reduction and edge pixels, -W, W is edge pixels, A is amplitude of applied each step, n is the derivative number of the delta function, SNR is indicates the output signal-to-noise ratio (error rate) of the edge finding operator. The high SNR value indicates that there is more signal at the output function and less noise at the same time.
In equation (2b), where Localization represents the equivalent of the actual edge pixel position, the distance between the placed pixel position of the filter. The Localization value indicates that the distance between the actual edge pixel positions is small.
In equation (2c), where k represents convolution multiplication of SNR and Localization values. In equation (2d) presented convolution multiplication in equation (2c), where i and j are pixel values in Cartesian coordinates, R indicates the output values. Obtained result of k has value with high complexity that can be reverted the first derivative of the Gaussian function.
In equation (2e) The edge map containing the gradient amplitude values obtained, non-maximum suppression (Canny, 1986) technique is applied to eliminate extracellular pixels.
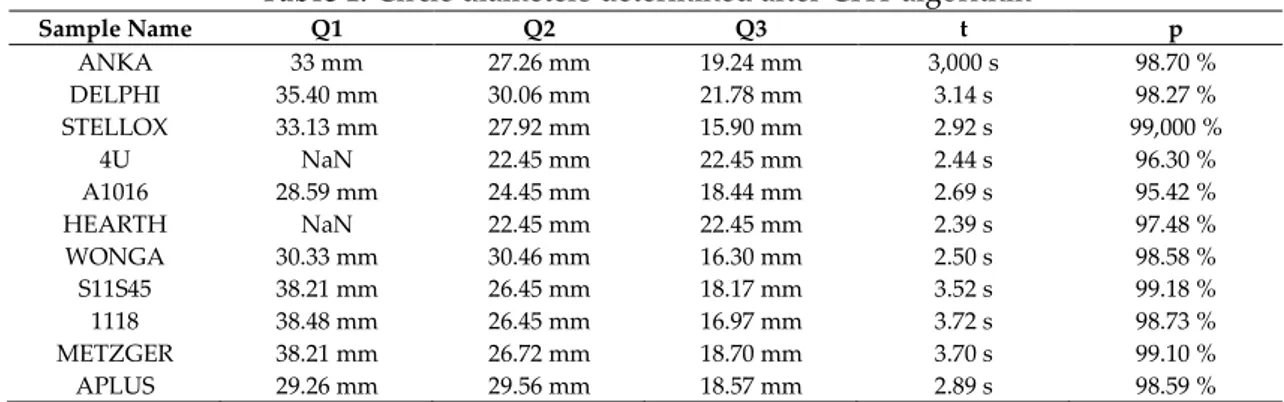
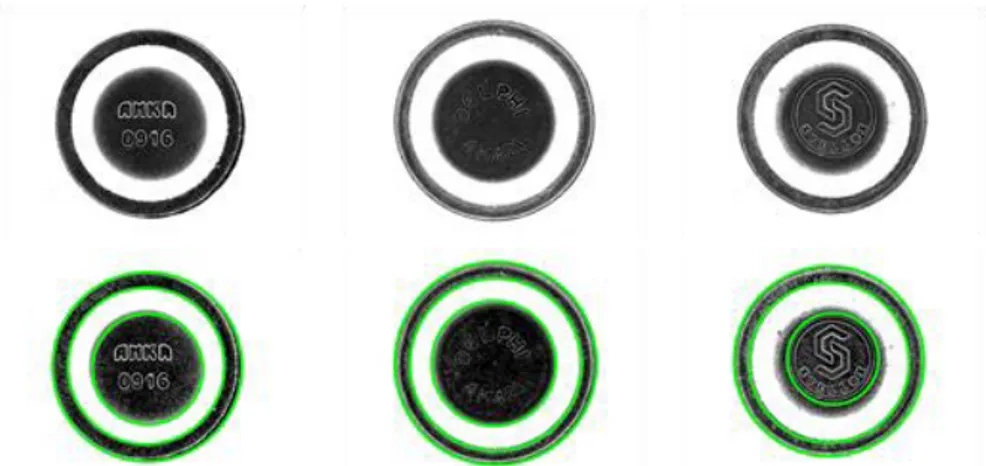
The Hough Transform (Hough, 1962) algorithm developed as the edge detection algorithm, and Circular Hough Transform (CHT) (Ylajaaski and Kiryati, 1994; Lam and Yuen, 1996) algorithm was used to detect circular contours according to the pixel relations within the image. In the mathematical expression given in Appendix shown as Figure 1. The central coordinates and radius pixel values were found for each of the three circles obtained on the image. The circular contours coordinates were plotted on the image as shown as Figure 3. And the circle representations were performed, and the values of Q1, Q2, Q3 was found in row 16 of by using the ratio value (pixel - mm conversion) in row 5 in the Appendix shown as Figure 1. For results of Q1, Q2, Q3 see Table 1.
Table 1. Circle diameters determined after CHT algorithm
Sample Name Q1 Q2 Q3 t p ANKA 33 mm 27.26 mm 19.24 mm 3,000 s 98.70 % DELPHI 35.40 mm 30.06 mm 21.78 mm 3.14 s 98.27 % STELLOX 33.13 mm 27.92 mm 15.90 mm 2.92 s 99,000 % 4U NaN 22.45 mm 22.45 mm 2.44 s 96.30 % A1016 28.59 mm 24.45 mm 18.44 mm 2.69 s 95.42 % HEARTH NaN 22.45 mm 22.45 mm 2.39 s 97.48 % WONGA 30.33 mm 30.46 mm 16.30 mm 2.50 s 98.58 % S11S45 38.21 mm 26.45 mm 18.17 mm 3.52 s 99.18 % 1118 38.48 mm 26.45 mm 16.97 mm 3.72 s 98.73 % METZGER 38.21 mm 26.72 mm 18.70 mm 3.70 s 99.10 % APLUS 29.26 mm 29.56 mm 18.57 mm 2.89 s 98.59 %
In Table 1, as a result of the application of the CHT algorithm, circular metal objects show the circle diameters. Q1 represents the outer diameter, Q2 is the middle diameter, and Q3 represents the inner diameter. t is the fixing process time and p is the accuracy ratio. NaN expressions donates the circle cannot be determined, Q3 results of 4U and HEARTH samples and APLUS Q1 result are shown incorrectly.
Figure 3. Circular Hough Transform (CHT) Results: For the determination of circle diameters, the CHT algorithm was used to determine the 3 circle positions (bottom)
Image normalization and feature extraction
Once the circle diameters have been detected, the remaining character region within the smallest circle diameter (Q3) area is cut off from the main image. The problem of character segmentation and character segmentation of the cut image is simplified. Two different approaches have been introduced for character region extraction. Daugman’s Rubber Sheet Model (DRSM) is used in this approach to align, normalize characters in a circular alignment. An approach developed by Daugman has developed a pattern matching method using the human eye for human recognition in the object classification problem. Normalized operation that is DRS model applied to images selected for circular alignment of characters. DRS model pixels are calculated with the following equations.
(3a)
(3b)
(3c)
(3d)
In equation (3a), where I(x,y) is Cartesian coordinate plane image, x(r, θ) and y(r, θ) indicate the polar coordinate plane. Circles in the Cartesian coordinate plane of r and θ, and indicates I(r, θ) representations in the polar coordinate plane.
In equation (3b) and (3c), where and are bottom edge pixel points of the characters set
for the image warping, so that the character region will not be exposed, and are denotes the
pixel points of the outer diameters of the smallest circle cut.
In equation (3d), the pixel points of the normalized coordinate plane obtained are DRS (x, y).
For and pixel points, 30 pixels less than the radius of the smallest circle is given. Because
the exactly character region is a little inner zone of the smallest circle, see in Figure 3. and
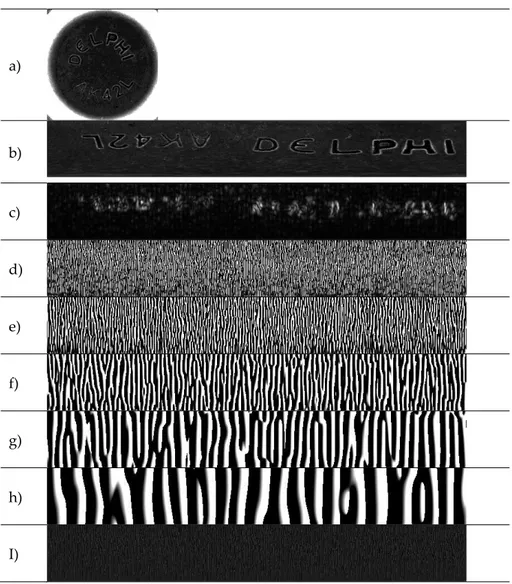
pixel points are the center point of the smallest circle. The most inner circle region has been extended from frame resolution (Sample Name = DELPHI - 327x327) to a resolution of 99x750 after normalization. Normalized images created with re-determined pixel points DRS for the Cartesian image of the polar image, and the next stage is made available for feature extraction. Obtained DRSM images as shown in Figure 4 (b).
For feature extraction process, sing that texture analysis (Turner, 1986), specific band-pass channels and spatial frequencies (Havlicek et al., 1997) such a given parameters by Gabor Filter (GF). GF is applied on DRSM image pixels with the following equations.
(4a)
(4c)
In equation (4a) and (4b), where x’ and y’ are the radian values of the input image pixel values, θ is angle value to which the filter will be applied.
In equation (4c), f is wavelength (frequency - cycles/degree), δ values are contrast deviation, G(x,y) is
magnitude frame of GF after applied GF, G(θ, f)is denotes phase frame of GF after applied GF.
In this study, when applying GF that parameters has been identified as f = 2, 4, 8, 16, 32, and θ = , , , . In practice, the best results are obtained from the sources of (Tan, 1995; Lee, 1996; Clausi and Jernigan, 2000) for the obtained frequency and θ constants. Phase images of GF used for pattern and texture factors in feature extraction (Oppenheim et al., 1983; Scott T. Acton et al., 2001; Tisse et al., 2002). Obtained phase frames as shown in Figure 4 (d)(e)(f)(g)(h).
Phase images were created for each sample with 20 different f frequencies and 4 different θ angle values and totally 220 items for 11 sample images. The color density range of the phase images obtained after the GF was determined as -3.14 to 3.14, and the "0" and "1" values that should be used for pattern matching were converted to the logical values and the Mean Absolute Deviation (MAD) algorithm was applied to the phase images to minimize the depreciation (Ma et al., 2002). MAD algorithm is calculated the GF phase pixels with the following equations.
(5a)
(5b)
(5c)
In equation (5a), (5b) and (5c), where x and y are pixel values of the phase image, N is sum of pixel values, is a constant used to normalize the image of MAD (x, y), G( , f) is phase frame of GF, MAD’(x, y) is obtained output image. The pixel values of the obtained phase images after MAD that if less than "0" is "0", if rather than "0" is "1", and obtained binary image to thresholding the MAD image as these conditions. Obtained for binary images as shown in Figure 4 (i).
In order to shorten the processing time for pattern matching, the image information has been reduced from 99x750 - 74250 pixel to 10x75 -750 pixels. Resized images were indexed in a single alignment and added to the database at 1x750 resolution, then matched. Sample name and index number are also uploaded to the database.
XOR pattern matching
The XOR logic operator is a very useful and fast way to match the "0" response given by the same binary values (Zhang et al., 2010; Bala and Tajinder, 2016). XOR operator calculating the matching with the following equations.
(6a)
(6b)
In equation (6a), where i is pixel index of matching image and image in database, N is sum of index number, A is matching image, B is image in database, S is obtained image after XOR operator process.
In equation (6b), where S(0) is sum of binary pixels "0" values of the obtained image, donates the rate of matching. The application results consist of matching rate, DRSM, GF and XOR operator process time are shown in Table 2.
a) b) c) d) e) f) g) h) I)
Figure 4. (a) Cut off view the inner circle area, (b) Normalized image as Daugman's Rubber Sheet Model
with reduce 30 pixels, (c) GF θ = 0, = 2 magnitude frame, (d) GF θ = 0, = 2 phase frame, (e) GF θ = 0,
= 4 phase frame, (f) GF θ = 0, = 8 phase frame, (g) GF θ = 0, = 16 phase frame, (h) GF θ = 0, = 32
phase frame, (i) MAD feature extraction image after applied GF θ = 0, = 2 phase frame
Table 2. XOR pattern matching results and all process time
Sample Name DRSM time GF time XOR time Match Ratio
ANKA 27 ms 4 ms 37 ms 0.932687 DELPHI 34 ms 4 ms 38 ms 0.894114 STELLOX 22 ms 3 ms 39 ms 0.960512 4U 39 ms 4 ms 39 ms 0.963340 A1016 27 ms 4 ms 39 ms 0.876377 HEARTH 35 ms 4 ms 39 ms 0.965684 WONGA 22 ms 3 ms 37 ms 0.932081 S11S45 24 ms 4 ms 38 ms 0.962653 1118 23 ms 3 ms 38 ms 0.955879 METZGER 27 ms 4 ms 38 ms 0.931286 APLUS 27 ms 3 ms 38 ms 0.963246
In the algorithms applied to the XOR pattern matching method, the processing times and matching ratios of the sample products are indicated. DRSM time specifies the processing time for the Daugman's model, GF Time is the processing time for the Gabor Filter applied for feature extraction, XOR time is the processing time for the pattern matching, and the Match Ratio is refers to rate of matching after XOR operator process.
Classification with optical character recognition
The second proposed method is OCR approach to use CNN from the deep machine learning classes for character recognition and circular metal object classification problem (Bell and Sejnowski, 1997; LeCun et al., 1998; Connell and Jain, 2001; Hinton et al., 2006; Keysers et al., 2007; Lee et al., 2009; Krizhevsky et al., 2012; LeCun et al., 2015; Jailin Reshma et al., 2016; Zhou et al., 2017). Before the CNN is performed, the process of repeating the character region within the inner circle is repeated. The presence of the circle diameters which are the pretreatment for the detection of the character zone is described in the Finding Circle Diameters section. Secondly, MSER and SWT algorithms to be applied respectively on the inner circle to detect character region and segmentation of characters. Lastly, CNN algorithms to be applied segmented character images for character recognition.
Maximally stable extremal region implementation
The second step is contrast enhancement sharpen filter was used to better characterize the character region after the pre-processing of character-zone detection, and to sharpen the characters in the image (Kocer and Cevik, 2011). In the resulting image, the contrast of the character edge pixels is increased and the usefulness of the character area detection and segmentation is increased and it is introduced in Figure 5 (b). The third step is for the detection of the character region is the algorithm for MSER from the blob coloring methods (Salembier and Garrido, 2000; Mikolajczyk et al., 2005; Donoser and Bischof, 2006). For MSER, the image was first converted to a binary image with a thresholding is 63 best found value. Then, the MSER algorithm marks possible character edge contours by blocking non-character zones with MSER blob extraction between binary pixels. The character region with these marked pixel points is enclosed in the bounding box as shown in Figure 5 (c).
Stroke width transform implementation
As shown in Figure 5 (c), it is marked in some non-character regions. In order to get rid of this situation, SWT algorithm was used to eliminate the non-character regions. SWT uses contour-width information of characters to eliminate contour-width information that is more or less than this information in the image. SWT algorithm is calculated with the following equations.
(7a)
(7b)
(7c)
In equation (7a), (7b) and 7(c), where p is inner contour pixel of character, N is sum of pixel values of p, n is number of iterations, and are directions of gradient, q is the outer contour pixel of the character, s denotes the width. The non-character regions are sifted with obtained character pixel contours and the character’s regions are re-marked after SWT and it is introduced in Figure 5 (d). In the character areas marked, some of characters have been marked several times. A series of matrix operations have been performed for this problem. These matrix operations, respectively, eliminate the same coordinate and eliminate the sum of x, y coordinate the difference sum of x + 1, y + 1 coordinate totals if the difference is less than 10 pixels. The mathematical model of Matrix operations is shown in equation (8).
(8)
In equation (8), where x, y are detected character contour coordinates, N is sum of coordinates, a constant of 10 is a constant value for repeated character contour points and bbox is marked edge counter coordinates. Character coordinates of the character contour after SWT are normalized with this formula, and the character regions are re-marked as shown in Figure 5 (e). The problem of detection character region and character segmentation problem is solved with these normalized coordinate values and the characters are prepared for the problem of character recognition.
(a) (b) (c) (d) (e)
Figure 5. (a) Cut off view the inner circle area, (b) sharpen filter image applied for contrast enhancement, (c) character regions results determined by MSER, (d) character regions results determined by SWT, (e)
character region results obtained by normalizing the character coordinates Convolutional neural networks implementation
In the character images prepared, the CNN of deep learning class was applied to the methods which are frequently used for the object classification problem. The CNN model is designed based on character dimensions and character positions within an image, also shown in Figure 6. For 3 Convolution layers, 32, 32 and 64 filters were applied respectively from the 3x3 matrix. For 3 MaxPooling layers stride value is 2. Obtained 36 class type with 1 Flatten layer and softmax layer. Used Relu (Qian et al., 2018) as activation function and Adam (Kingma and Ba, 2015) as optimization function.
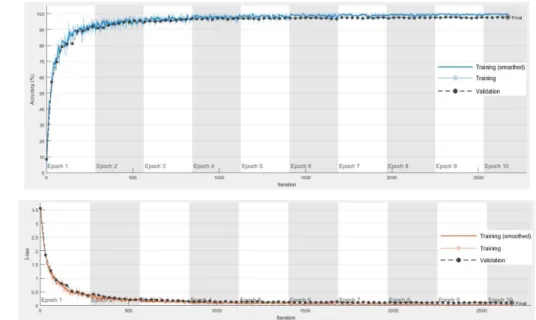
For the training of the model, some of the images obtained in SWT were reproduced such as binary inversion, inversion in x and y axes, rotation, noise addition, histogram equalization, adaptive histogram equalization, image density values. In another part, EMNIST (Cohen et al., 2017) letters data set was used. 36000 training images, 9000 verification images, each 1000 characters, were used for 36 characters. The model training was set as 10 epochs and a total of 2810 iterations were applied. As a result of the training that obtained minimum validation loss was found to be 0.088, accuracy was 97.76 % and validation accuracy was 97.66 %. Graphs of the training process including accuracy percentages and loss rates are shown in Figure 7. Character images are passed through the trained model have been solved the classification problem of circular metal objects by the OCR approach. The prediction results of character recognition as shown in Figure 8. For character recognition processing time, see Table 3
Figure 6. The isotropic view of designed CNN model
Table 3. The process times of after applied OCR algorithms Sample Name MSER time SWT + n* time OCR time
ANKA 767 ms 358 ms 511 ms DELPHI 672 ms 167 ms 507 ms STELLOX 1393 ms 207 ms 477 ms 4U 1288 ms 133 ms 456 ms A1016 427 ms 178 ms 504 ms HEARTH 1170 ms 154 ms 525 ms WONGA 4581 ms 99 ms 461 ms S11S45 1093 ms 161 ms 468 ms 1118 880 ms 61 ms 504 ms METZGER 1009 ms 103 ms 513 ms APLUS 1055 ms 321 ms 461 ms
In Table 3, the algorithms applied for the OCR process and their processing times are available. The represents the matrix normalized processing time applied to the characters region coordinates after SWT.
(a)
(b)
Figure 7. In the process of training (a) increasing accuracy percentage and validation accuracy percentage changes, (b) shows the change in decreasing verification rates
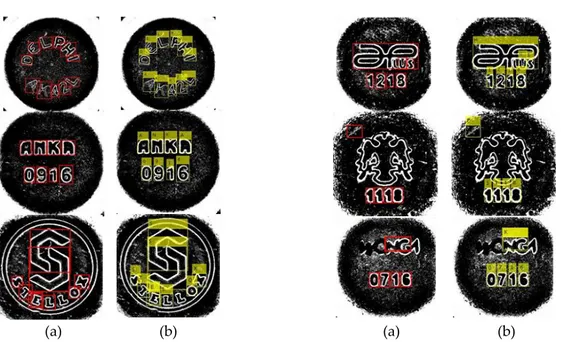
(a) (b) (a) (b)
Figure 8. (a) The result of character segmentation of images normalized after SWT, (b) the result of OCR, characters have been detected by the CNN algorithm.
DATASET AND PERFORMANCE HARDWARE
For the sampling images of industrial products of circular metal objects, the Cognex brand IS7010 model scanning camera and the 35mm C-mount Lens were used. By In-Sight Explorer program with 800x600 resolution grayscale images were obtained. The data sets of EMNIST and reproducing from the obtained images are uses in order to train the CNN model.
In the scope of the study, Intel i7 4720HQ 2.6GHz CPU, 16GB 2133MHz RAM used and NVidia GTX960 2GB RAM GPU hardware was used to train CNN model. The processing times of the whole applied algorithms, which are mentioned in the tables, were obtained with the specified hardware and the programming phase of the study was developed in Matlab R2018a software.
RESULTS AND DISCUSSIONS
As shown as Figure 8, The characters on the circular metal objects are engraved and, since they do not have a different background, the fact that some characters are in very different fonts and that some characters are very adjacent make difficult the OCR problem. However, the MSER algorithm is quite successful when some characters on circular metal objects are not contiguous with one another and have sufficient font size. After successful character segmentation yielded successful character recognition results as shown in Figure 8.
Table 4. Comparison of proposed methods
Applied Methods Average Processing Time Accuracy Rates
Finding Circle Dimensions 2.99 s 0.9812
XOR Pattern Matching Method 69.72 ms -
OCR Method 1.596 s 0.9719
Table 4 shows the processing times and accuracy of the proposed methods for the classification of
circular metal objects.In both methods, the determination of the localization or find the diameter of the
circles was applied as a preliminary stage. Accordingly, the processing time for the XOR pattern matching method lasts approximately 3.059 seconds in total, while the OCR method takes a total of 4.586 seconds. If compiled with C++ or Phyton languages, processing times are expected to decrease. In
addition, in the case of processing on the GPU core with opencv or emgucv libraries will significantly reduce the processing times.
CONCLUSIONS
The XOR pattern matching and OCR solutions applied for the classification problem of circular metal objects with engraved characters are presented in the tables. Although the XOR pattern matching solution is much faster than the OCR method, but decreases the accuracy of matching ratio, such as the change of character sizes, the formation of a camera image with a different angle of circular metal objects. Although the MSER and SWT algorithms applied at the preliminary stage for the OCR method took much time in terms of processing time, they gave successful results for the segmentation of the characters and the character regions. The accuracy of the CNN model applied to the OCR in the final stage was 97.66%, and it achieved a high level of success in the visualization where character area detection is done correctly. The main points of this thesis result is classify the circular metal objects in separation section and also, control and verification the accuracy of characters after pressing process in quality control section. Besides that, it is contributed that XOR pattern matching can be used for classification of engraved material and also MSER and SWT algorithms are successful on solution of character recognition problem of engraved materials. For the classification problem of circular metal objects, the success of the OCR solution is proposed, given the factors such as camera visualization of the products at a different angle, the potential for a wide range of products that can be increased or changed, the realization of new products' feature extraction for XOR template matching, and the increasing work-time process.
SYMBOLS
: sigma, τ: tav, θ: theta, δ : delta, f: frequency APPENDIX
Figure 2. Algorithm 2 shows applied whole algorithms in order to make XOR pattern matching after detection Q3 inner circle
REFERENCES
Bala, A. and Tajinder, K., 2016, Local texton XOR patterns: A new feature descriptor for content-based image retrieval, Engineering Science and Technology, an International Journal, 19 (1), 101-112. Bell, A. J. and Sejnowski, T. J., 1997, The Independent Components of Natural Scenes are Edge Filters,
Vision Research, 37 (23), 3327-3338
Canny, J., 1986, A Computational Approach to Edge Detection, IEEE Transactions on Pattern Analysis and Machine Intelligence, PAMI-8 (6), 679-698.
Chapelle, O., Haffner, P. and Vapnik, V. N., 1999, Support vector machines for histogram-based image classification, Ieee Transactions on Neural Networks, 10 (5), 1055-1064.
Chawla, S. and Oberoi, A., 2011, A Robust Algorithm for Iris Segmentation and Normalization using Hough Transform, Global Journal of Business Management and Information Technology, 69-76. Clausi, D. A. and Jernigan, T. E., 2000, Designing Gabor filters for optimal texture separability, Pattern
Recognition, 33 (11), 1835-1849.
Cohen, G., Afshar, S., Tapson, J. and van Schaik, A., 2017, EMNIST: an extension of MNIST to handwritten letters, Internaltional Joint Conference On Neural Networks (IJCONN), 2921-2926. Connell, S. D. and Jain, A. K., 2001, Template-based online character recognition, Pattern Recognition, 34
(1), 1-14.
Dalal, N. and Triggs, B., 2005, Histograms of Oriented Gradients for Human Detection, Proceedings - 2005 IEEE Computer Society Conference on Computer Vision and Pattern Recognition, CVPR 2005, 1 (1), 886-893.
Daugman, J., 1997, Neural image processing strategies applied in real-time pattern recognition, Real-Time Imaging, 3 (3), 157-171.
Daugman, J., 2003, The importance of being random statistical principles of iris recognition, Pattern Recognition, 36, 279-291.
Donoser, M. and Bischof, H., 2006, Efficient Maximally Stable Extremal Region (MSER) Tracking, Proceedings of the IEEE Computer Society Conference on Computer Vision and Pattern Recognition, 1, 553-560.
Epshtein, B., Ofek, E. and Wexler, Y., 2010, Detecting Text in Natural Scenes with Stroke Width Transform, Proceedings of the IEEE Computer Society Conference on Computer Vision and Pattern Recognition, 2963-2970.
Fukushima, K., 1980, Neocognitron: A self-organizing neural network model for a mechanism of pattern recognition unaffected by shift in position, Biological Cybernetics, 36 (4), 193–202.
Gabor, D., 1946, Theory of communication. Part 3: Frequency compression and expansion, Journal of the Institution of Electrical Engineers - Part III: Radio and Communication Engineering, 93 (26), 445-457. Gonzalez, A., Bergasa, L. M., Yebes, J. J. and Bronte, S., 2012, Text Location in Complex Images, 21st
International Conference on Pattern Recognition (ICPR 2012), 617-620.
Hanif, S. M. and Prevost, L., 2009, Text Detection and Localization in Complex Scene Images using Constrained AdaBoost Algorithm, 10th International Conference on Document Analysis and Recognition, 1-5.
Havlicek, J. P., Havlicek, J. W. and Bovik, A. C., 1997, The analytic image, Proceedings of International Conference on Image Processing, 446-449.
He, K., Gkioxari, G., Dollar, P. and Girshick, R., 2017, Mask R-CNN, Proceedings of the IEEE International Conference on Computer Vision, 1, 2980-2988.
Heikkila, M., Pietikainen, M. and Schmid, C., 2009, Description of interest regions with local binary patterns, Pattern Recognition, 42 (3), 425-436.
Hinton, G. E., Osindero, S. and Teh, Y. W., 2006, A Fast Learning Algorithm for Deep Belief Nets, Neural Computation, 18 (7), 1527-1554.
Hough, P. V. C., 1962, General Purpose Visual Input for a Computer, Brookhaven National Laboratory, Upton, N. Y, 99, 323-334.
Huizhong, C., Tsai, S. S., Schroth, G., Chen, D. M., Grzeszczuk, R. and Girod, B., 2011, Robust text detection in natural images with edge-enhanced maximally stable extremal regions, Proceedings - International Conference on Image Processing, ICIP, 2609-2612.
Jailin Reshma, A., Jenushma James, J., Kavya, M. and Saravanan, M., 2016, An overview of character recognition focused on offline handwriting, ARPN Journal of Engineering and Applied Sciences, 11 (15), 9372-9378.
Keysers, D., Deselaers, T., Gollan, C. and Ney, H., 2007, Deformation models for image recognition, IEEE Trans Pattern Anal Mach Intell, 29 (8), 1422-1435.
Kingma, D. P. and Ba, J. L., 2015, Adam: A method for stochastic gradient descent, ICLR: International Conference on Learning Representations.
Krizhevsky, A., Sutskever, I. and Hinton, G. E., 2012, ImageNet Classification with Deep Convolutional Neural Networks, ImageNet Classification with Deep Convolutional Neural Networks, 1097-1105. Kocer, H. E. and Cevik, K., 2011, Artificial neural networks based vehicle license plate recognition,
Procedia Computer Science, 3, 1033-1037.
Lam, W. C. Y. and Yuen, S. Y., 1996, Efficient technique for circle detection using hypothesis filtering and Hough transform, Iee Proceedings-Vision Image and Signal Processing, 143 (5), 292-300.
LeCun, Y., Bottou, L., Bengio, Y. and Haffner, P., 1998, Gradient-based learning applied to document recognition, Proceedings of the IEEE, 86 (11), 2278-2324.
LeCun, Y., Bengio, Y. and Hinton, G., 2015, Deep learning, Nature, 521 (7553), 436-444.
Lee, H., Grosse, R., Ranganath, R. and Ng, A. Y., 2009, Convolutional Deep Belief Networks for Scalable Unsupervised Learning of Hierarchical Representations, Proceedings of the 26th Annual International Conference on Machine Learning - ICML '09, 609-616.
Lee, T. S., 1996, Image representation using 2D gabor wavelets, IEEE Transactions on Pattern Analysis and Machine Intelligence, 18 (10), 959-971.
Li, Y. and Lu, H., 2012, Scene Text Detection via Stroke Width, Proceedings of the 21st International Conference on Pattern Recognition (ICPR2012), 681-684.
Long, J., Shelhamer, E. and Darrell, T., 2015, Fully Convolutional Networks for Semantic Segmentation. 2015 IEEE Conference on Computer Vision and Pattern Recognition (CVPR): 3431-3440.
Ma, J., Shao, W., Ye, H., Wang, L., Wang, H., Zheng, Y. and Xue, X., 2018, Arbitrary-Oriented Scene Text Detection via Rotation Proposals, IEEE Transactions on Multimedia, 20 (11), 3111-3122.
Ma, L., Wang, Y. and Tan, T., 2002, Iris recognition based on multichannel Gabor filtering. Proceedings of the International Conference on Asian Conference on Computer Vision: 279--283.
Marr, D. and Hildreth, E., 1980, Theory of Edge-Detection, Proceedings of the Royal Society Series B-Biological Sciences, 207 (1167), 187-217.
Matas, J., Chum, O., Urban, M. and Pajdla, T., 2004, Robust wide-baseline stereo from maximally stable extremal regions, Image and Vision Computing, 22 (10), 761-767.
Mikolajczyk, K., Tuytelaars, T., Schmid, C., Zisserman, A., Matas, J., Schaffalitzky, F., Kadir, T. and Gool, L. V., 2005, A Comparison of Affine Region Detectors, International Journal of Computer Vision, 65 (1-2), 43-72.
Müller, K. R., Mika, S., Ratsch, G., Tsuda, K. and Scholkopf, B., 2001, An Introduction to Kernel-Based Learning Algorithms, Ieee Transactions on Neural Networks, 12, 181-201.
Neumann, L. and Matas, J., 2012, Real-Time Scene Text Localization and Recognition, 2012 IEEE Conference on Computer Vision and Pattern Recognition, 3538-3545.
Ojala, T., Pietikainen, M. and Harwood, D., 1996, A comparative study of texture measures with classification based on feature distributions, Pattern Recognition, 29 (11), 51-59.
Oppenheim, A. V., Lim, J. S. and Curtis, S. R., 1983, Signal Synthesis and Reconstruction from Partial Fourier-Domain Information, Journal of the Optical Society of America, 73 (11), 1413-1420.
Pratt, W. K., 2001, Digital Image Processing: PIKS Inside, John Wiley and Sons, Inc., New York, NY, USA, 3rd edition, 590-595.
Qian, S., Liu, H., Liu, C., Wu, S. and Wong, H. S., 2018, Adaptive activation functions in convolutional neural networks, Neurocomputing, 272, 204-212.
Redmon, J. and Farhadi, A., 2017, YOLO9000: Better, Faster, Stronger, 30th IEEE Conference on Computer Vision and Pattern Recognition, CVPR 2017, 6517-6525.
Redmon, J. and Farhadi, A., 2019, YOLOv3: An Incremental Improvement, CoRR.
Salembier, P. and Garrido, L., 2000, Connected operators based on region-tree pruning strategies. Proceedings 15th International Conference on Pattern Recognition. ICPR-2000: 367-370.
Schapire, R. E. and Singer, Y., 1999, Improved boosting algorithms using confidence-rated predictions, Machine Learning, 37 (3), 297-336.
Scott T. Acton, P. Havlicek and Alan Conrad Bovik, 2001, Oriented Texture Completion by AM–FM Reaction-Diffusion, IEEE TRANSACTIONS ON IMAGE PROCESSING, 10 (6), 885-896.
Shivakumara, P., Phan, T. Q. and Tan, C. L., 2011, A Laplacian Approach to Multi-Oriented Text Detection in Video, IEEE Transactions on Pattern Analysis and Machine Intelligence, 33 (2), 412-419.
Subrahmanyam, M., Wu, Q. M. J., Maheshwari, R. P. and Balasubramanian, R., 2013, Modified color motif co-occurrence matrix for image indexing and retrieval, Computers & Electrical Engineering, 39 (3), 762-774.
Tan, T. N., 1995, Texture edge detection by modelling visual cortical channels, Pattern Recognition, 28 (9), 1283-1298.
Tian, Y., Yang, G., Wang, Z., Wang, H., Li, E. and Liang, Z., 2019, Apple detection during different growth stages in orchards using the improved YOLO-V3 model, Computers and Electronics in Agriculture, 157, 417-426.
Tisse, C., Martin, L., Torres, L. and Robert, M., 2002, Person identification technique using human iris recognition, Proceedings of Vision Interface, 294-299.
Turner, M. R., 1986, Texture-Discrimination by Gabor Functions, Biological Cybernetics, 55 (2-3), 71-82. Xie., E., Zang., Y., Shao., S., Yu., G., Yao., C. and Li., G., 2018, Scene Text Detection with Supervised
Pyramid Context Network, CoRR.
Ylajaaski, A. and Kiryati, N., 1994, Adaptive Termination of Voting in the Probabilistic Circular Hough Transform, IEEE Transactions on Pattern Analysis and Machine Intelligence, 16 (9), 911-915.
Zhang, B., Gao, Y., Zhao, S. and Liu, J., 2010, Local derivative pattern versus local binary pattern: face recognition with high-order local pattern descriptor, IEEE Trans Image Process, 19 (2), 533-544.
Zhao, X., Lin, K. H., Fu, Y., Hu, Y., Liu, Y. and Huang, T. S., 2011, Text from corners: a novel approach to detect text and caption in videos, IEEE Trans Image Process, 20 (3), 790-799.
Zhou, X., Yao, C., Wen, H., Wang, Y., Zhou, S., He, W. and Liang, J., 2017, EAST: An efficient and accurate scene text detector, 2642-2651.