Silver Nitrate/Oligo(ethylene Oxide) Surfactant/Mesoporous Silica
Nanocomposite Films and Monoliths
Olga Samarskaya and ¨Omer Dag1
Department of Chemistry, Faculty of Science, Bilkent University, 06533 Ankara, Turkey Received November 17, 2000; accepted February 2, 2001
A lyotropic, liquid crystalline (LC) phase of a silver nitrate/ oligo(ethylene oxide), water, and acid mixture was used for one-pot synthesis of mesoporous silica materials in which Ag+ions are uniformly distributed. We established that the AgNO3-to-surfactant
mole ratio is very important in a 50 wt% surfactant/water system to preserve the hexagonal LC phase before and after the addition of the silica source. Below a 0.6 AgNO3-to-surfactant mole ratio,
the mixture is liquid crystalline and serves as a template for silica polymerization. However, between 0.6 and 0.8 AgNO3-to-surfactant
mole ratios, one must control the composition of the mixture dur-ing the polymerization processes. Above a 0.8 mole ratio, Ag+ions undergo phase separation from the reaction mixture by complexing with the surfactant molecules. The resulting silica materials ob-tained from AgNO3/surfactant ratios above 0.8 have anisotropy but
without a hexagonal mesophase. Here, we establish a AgNO3
con-centration range in which the LC phase is preserved to template the synthesis of mesoporous silica, and we discuss the structural behav-ior of the mixtures at AgNO3/surfactant mole ratios of 0.00–2.00,
using POM, PXRD, FTIR, and UV–Vis absorption spectroscopy.
C
°2001 Academic Press
Key Words: mesoporous silica films and monoliths; silver
nanoparticles; liquid crystalline templating; aggregation.
I. INTRODUCTION
Since the discovery of mesoporous silica materials by a Mobil scientist (1), the field has been gaining increasing interest from the scientific community. One of the most important interests of the field is creating new materials not only with desirable struc-tures but also with modified internal surfaces. These materials have some uses and functions. For instance, thiol-functionalized mesoporous silica materials have been used to demonstrate the cleaning of mercury from contaminated water (2), and the CVD of disilane, Si2H6, in MCM-41 thin films (3) at around 100– 140◦C gives nanoclusters of silicon, which emit in the visible region with nanosecond lifetimes (4). Syntheses of semiconduc-tor nanoclusters (4–8), metal nanoparticles (9), and polymers (10) in the internal surfaces of inorganic mesostructures and
1To whom correspondence should be addressed. E-mail: [email protected].
edu.tr.
surface modifications with different organic groups are some ex-amples of new materials of this type in the field (11–13). These nanoparticle-loaded mesoporous materials display unique prop-erties and may find applications in nanotechnology as sensors, catalysts, etc. (5, 6, 8), due to the high internal surface area which dominates the properties of the materials (surface-to-bulk ratio increases dramatically).
Much effort has been devoted to preparing silver nanoparticles in both organic and inorganic environments (14–20). The use of inorganic oxide coatings (16–19) rather than organic stabilizers provides several advantages (20). There are a few approaches to producing silver nanoparticles either in the silica-coated form (21) or as silver nanoparticles containing mesoporous silica (19). The second approach was achieved through soaking the calcined mesoporous materials in the AgNO3 solution. This approach produces Ag particles of average diameter 2.5 nm (19). Here, we describe for the first time the incorporation of silver ions into the channels of mesoporous silica materials in their free ion form using the LC templating approach (22). This method has also been used to incorporate lithium triflate as a Li+ion source for ion-conducting materials (22).
We use a lyotropic liquid crystalline phase of oligo(ethylene oxide) surfactants which house Ag+ ions in the hydrophilic ethylene oxide head groups and allow Ag+ ions to distribute uniformly into channels of mesoporous silica materials. It was determined that the presence of the Ag+ion does not alter the LC phase of the surfactant molecules up to an Ag+/surfactant mo-lar ratio of 0.6–0.7 during silica polymerization. This has also been demonstrated with LiCF3SO3 as an ingredient. The LC phase of LiCF3SO3 breaks above a 0.6–0.7 surfactant-to-salt ratio, and the resulting mixture yields amorphous silica with-out a mesophase order (22). It was discovered by investigation that CF3SO−3 and Li+ions are mainly in the free ion form (22). In this work, we also established the conditions for AgNO3 in oligo(ethylene oxide) surfactant and used it as a template for silica polymerization in the synthesis of uniformly distributed silver-ion-containing mesoporous silica materials. Silver ions in mesoporous silica materials were later reduced to silver nanopar-ticles by using hydrazine in the gas phase, and the reaction was monitored with UV–Vis absorption spectroscopy. Structural and spectral changes during silica polymerization and reduction pro-cesses are discussed.
203 0021-9797/01 $35.00
Copyright°C2001 by Academic Press All rights of reproduction in any form reserved.
II. MATERIALS AND METHODS
All the materials used in this work are Aldrich grade, and no further purification was carried out. First, the addition of 0.10– 0.20 g of nitric acid acidified the solution of 0.00–0.30 g of AgNO3, which was dissolved in 2.00 g of distilled water. Then addition of 2.00 g of the surfactant C12H25(CH2CH2O)10OH, C12E10 into this mixture and heating to 50–70◦C allowed the mixture to homogenize. The sample at this stage is liquid crys-talline and stable in the dark and in closed containers. To this mixture, preliminarily dissolved in 0.50 g of methanol, 2.50– 2.90 g of tetramethyl orthosilicate (TMOS) was added, and either by shaking or gentle heating, the mixture was again ho-mogenized. At this stage, the preparation mixture is liquid. However, the hydrolysis of TMOS into various silica species and the evaporation of methanol (hydrolysis product) make the mixture thicker and allow the system to reorganize into the hexagonal mesophase. Further silica hydrolysis and polymeriza-tion/condensation take place in the solvent parts in the vicinity of the hydrophilic regions of the LC phase of the surfactant. In a few hours, samples become solid. However, the polymeriza-tion/condensation reaction continues slowly for days and months in the solid state. The silica film samples were prepared on a glass and/or a quartz and silicon(100) surface. The samples on glass slides were used for POM images; quartz-deposited samples were used for N2H4 reduction, which can be mon-itored using UV–Vis absorption spectroscopy. The thin films prepared on a silicon wafer were used for FTIR spectral mea-surements (note that undoped Si(100) is transparent to mid-IR radiation).
Polarized optical microscopy (POM) images were recorded in transmittance mode on a Meije Techno ML9400 series po-larizing microscope with reflected and transmitted light illu-mination and by using convergent white light between parallel and crossed polarizers. FTIR spectra were recorded from film samples deposited on Si(100) using a BOMEM 102 FTIR spec-trometer in transmittance mode. UV–Vis absorption spectra were recorded from film samples prepared on quartz windows using a Varian Cary 5 double-beam spectrophotometer. Powder X-ray diffraction (PXRD) patterns were obtained on a Siemens D5000 diffractometer using a high-power CuKα source operating at 50 kV/35 mA.
III. RESULTS AND DISCUSSION
The hexagonal LC phase of the C12E10/AgNO3/H2O/HNO3 mixture is preserved during polymerization of a silica source, TMOS, that was forced to undergo a hydrolysis and polymer-ization reaction in the hydrophilic regions of the LC phase. The liquid mixture of the ingredients solidifies in time into any shape and form, such as monoliths and films of any thickness. The POM was used at every stage of the polymerization reaction to monitor the texture of the film samples (Fig. 1). PXRD was used to establish the type of structure and degree of order of the
FIG. 1. Optical images taken with a polarized optical microscope showing (A) the fan texture of the hexagonal LC phase of AgNO3/C12E10/H2O/HNO3;
(B) the fan-like texture of the mesoporous silica film; and (C) the anisotropic brushes on the surface of the aged silica film (scale bar is 200µm).
mesophase. FTIR spectroscopy was extensively used to illumi-nate the structural and phase changes.
The evaporation of methanol (a side product of the hydrolysis of TMOS) and further polymerization of the mixture resulting from reformation of the mesophase induce an optical birefrin-gence texture. The resulting transparent, soft, but not mobile film samples (early stage of the reaction mixture) display a fan texture (Fig. 1A). Inspection of rigidified film samples by POM reveals
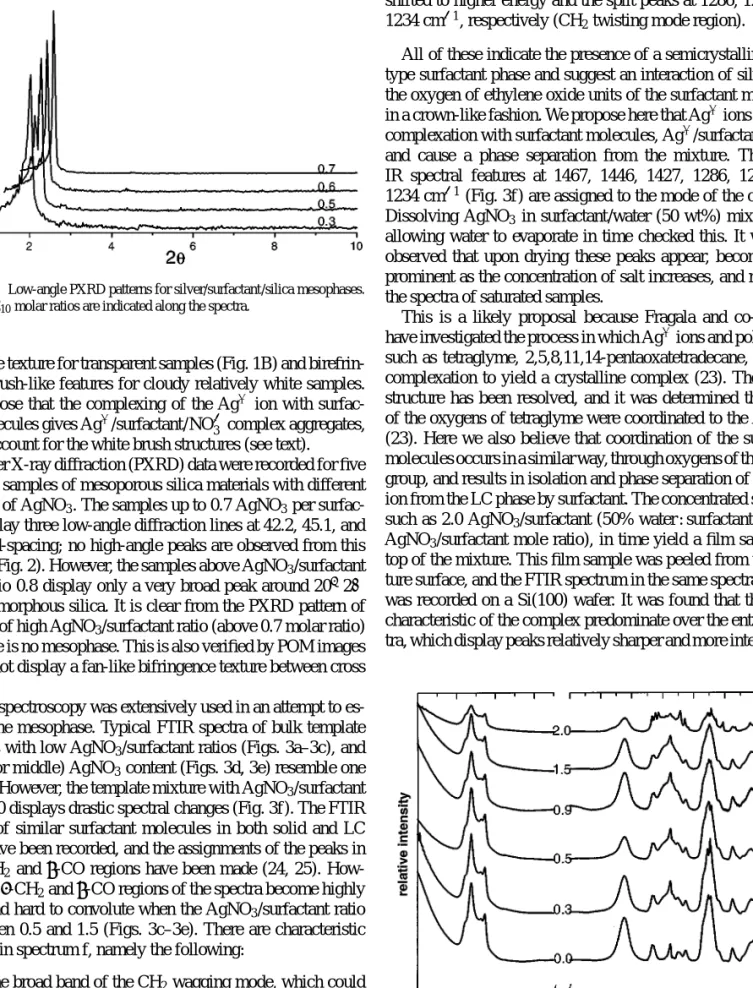
FIG. 2. Low-angle PXRD patterns for silver/surfactant/silica mesophases. Ag+/C12E10molar ratios are indicated along the spectra.
a fan-like texture for transparent samples (Fig. 1B) and birefrin-gence brush-like features for cloudy relatively white samples. We propose that the complexing of the Ag+ ion with surfac-tant molecules gives Ag+/surfactant/NO−3 complex aggregates, which account for the white brush structures (see text).
Powder X-ray diffraction (PXRD) data were recorded for five different samples of mesoporous silica materials with different amounts of AgNO3. The samples up to 0.7 AgNO3per surfac-tant display three low-angle diffraction lines at 42.2, 45.1, and 48.3 ˚A d-spacing; no high-angle peaks are observed from this system (Fig. 2). However, the samples above AgNO3/surfactant mole ratio 0.8 display only a very broad peak around 20◦ 22 due to amorphous silica. It is clear from the PXRD pattern of samples of high AgNO3/surfactant ratio (above 0.7 molar ratio) that there is no mesophase. This is also verified by POM images that do not display a fan-like bifringence texture between cross polars.
FTIR spectroscopy was extensively used in an attempt to es-tablish the mesophase. Typical FTIR spectra of bulk template mixtures with low AgNO3/surfactant ratios (Figs. 3a–3c), and (higher or middle) AgNO3content (Figs. 3d, 3e) resemble one another. However, the template mixture with AgNO3/surfactant ratio 2.00 displays drastic spectral changes (Fig. 3f). The FTIR spectra of similar surfactant molecules in both solid and LC phase have been recorded, and the assignments of the peaks in the δ-CH2 andν-CO regions have been made (24, 25). How-ever, theδ-CH2andν-CO regions of the spectra become highly broad and hard to convolute when the AgNO3/surfactant ratio is between 0.5 and 1.5 (Figs. 3c–3e). There are characteristic changes in spectrum f, namely the following:
(1) The broad band of the CH2wagging mode, which could be decomposed into two peaks at 1349 and 1363 cm−1 along with three peaks at 1130, 1096, and 1078 cm−1 in a C–O–C stretching region.
(2) The presence of three well-resolved peaks at 1467, 1446, and 1427 cm−1referred to the CH2scissoring mode and a peak
shifted to higher energy and the split peaks at 1286, 1256, and 1234 cm−1, respectively (CH2twisting mode region).
All of these indicate the presence of a semicrystalline PEO-type surfactant phase and suggest an interaction of silver with the oxygen of ethylene oxide units of the surfactant molecules in a crown-like fashion. We propose here that Ag+ions undergo complexation with surfactant molecules, Ag+/surfactant/NO−3, and cause a phase separation from the mixture. The sharp IR spectral features at 1467, 1446, 1427, 1286, 1256, and 1234 cm−1 (Fig. 3f) are assigned to the mode of the complex. Dissolving AgNO3 in surfactant/water (50 wt%) mixture and allowing water to evaporate in time checked this. It was also observed that upon drying these peaks appear, become more prominent as the concentration of salt increases, and resemble the spectra of saturated samples.
This is a likely proposal because Fragala and co-workers have investigated the process in which Ag+ions and polyethers, such as tetraglyme, 2,5,8,11,14-pentaoxatetradecane, undergo complexation to yield a crystalline complex (23). The crystal structure has been resolved, and it was determined that three of the oxygens of tetraglyme were coordinated to the Ag+ion (23). Here we also believe that coordination of the surfactant molecules occurs in a similar way, through oxygens of the ethoxy group, and results in isolation and phase separation of the Ag+ ion from the LC phase by surfactant. The concentrated samples, such as 2.0 AgNO3/surfactant (50% water : surfactant and 2.0 AgNO3/surfactant mole ratio), in time yield a film sample on top of the mixture. This film sample was peeled from the mix-ture surface, and the FTIR spectrum in the same spectral region was recorded on a Si(100) wafer. It was found that the peaks characteristic of the complex predominate over the entire spec-tra, which display peaks relatively sharper and more intense than
FIG. 3. FT-IR spectra of the AgNO3/surfactant : H2O(50 wt%) : HNO3bulk
template mixture in the frequency range 3200–600 cm−1. AgNO3/surfactant
those of low-concentration samples. Since the film was formed at the air/mixture interface, the AgNO3 content in the mixture and the film must be different. Further study to determine the chemical composition of the film samples is on-going.
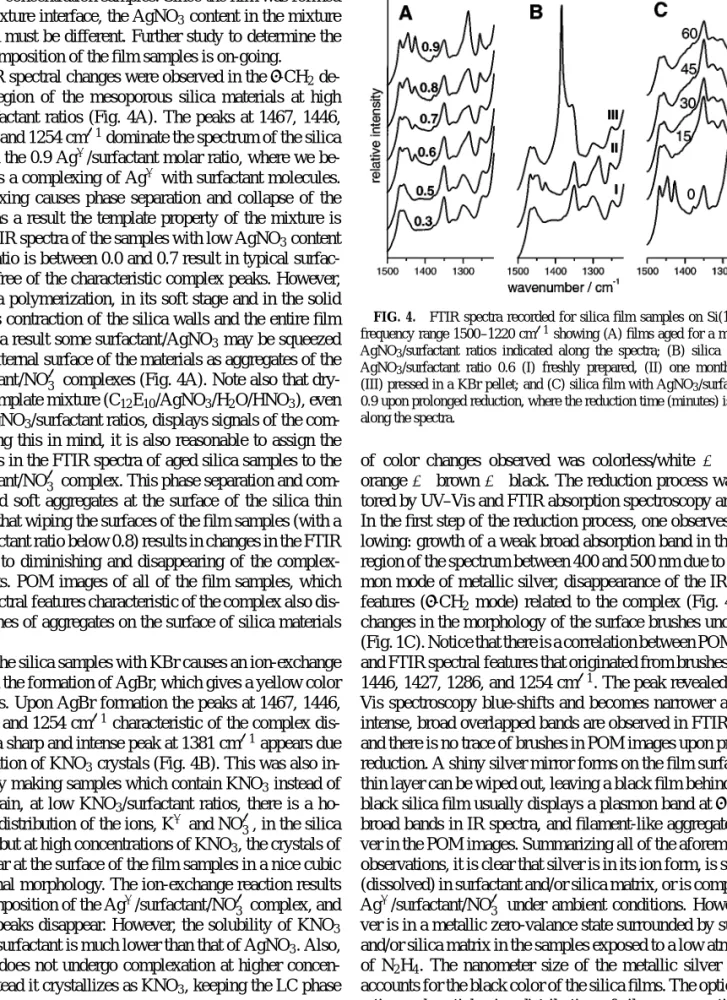
Similar IR spectral changes were observed in theδ-CH2 de-formation region of the mesoporous silica materials at high AgNO3/surfactant ratios (Fig. 4A). The peaks at 1467, 1446, 1427, 1286, and 1254 cm−1dominate the spectrum of the silica sample with the 0.9 Ag+/surfactant molar ratio, where we be-lieve there is a complexing of Ag+ with surfactant molecules. The complexing causes phase separation and collapse of the LC phase; as a result the template property of the mixture is lost. The FTIR spectra of the samples with low AgNO3content where the ratio is between 0.0 and 0.7 result in typical surfac-tant peaks, free of the characteristic complex peaks. However, further silica polymerization, in its soft stage and in the solid state, causes contraction of the silica walls and the entire film samples; as a result some surfactant/AgNO3 may be squeezed out to the external surface of the materials as aggregates of the Ag+/surfactant/NO−3 complexes (Fig. 4A). Note also that dry-ing of the template mixture (C12E10/AgNO3/H2O/HNO3), even with low AgNO3/surfactant ratios, displays signals of the com-plex. Keeping this in mind, it is also reasonable to assign the weak signals in the FTIR spectra of aged silica samples to the Ag+/surfactant/NO−3 complex. This phase separation and com-plexing yield soft aggregates at the surface of the silica thin films. Note that wiping the surfaces of the film samples (with a salt-to-surfactant ratio below 0.8) results in changes in the FTIR spectra due to diminishing and disappearing of the complex-related peaks. POM images of all of the film samples, which show IR spectral features characteristic of the complex also dis-played brushes of aggregates on the surface of silica materials (Fig. 1C).
Pressing the silica samples with KBr causes an ion-exchange reaction and the formation of AgBr, which gives a yellow color to the pellets. Upon AgBr formation the peaks at 1467, 1446, 1427, 1286, and 1254 cm−1 characteristic of the complex dis-appear and a sharp and intense peak at 1381 cm−1appears due to the formation of KNO3 crystals (Fig. 4B). This was also in-vestigated by making samples which contain KNO3instead of AgNO3. Again, at low KNO3/surfactant ratios, there is a ho-mogeneous distribution of the ions, K+and NO−3, in the silica mesophase, but at high concentrations of KNO3, the crystals of KNO3appear at the surface of the film samples in a nice cubic and hexagonal morphology. The ion-exchange reaction results in the decomposition of the Ag+/surfactant/NO−3 complex, and the related peaks disappear. However, the solubility of KNO3 in the PEO-surfactant is much lower than that of AgNO3. Also, the K+ ion does not undergo complexation at higher concen-trations; instead it crystallizes as KNO3, keeping the LC phase unperturbed.
The formation of the Ag+/surfactant/NO−3 complex was also investigated by the reduction of Ag+ ions to silver metal nanoparticles. The transparent and white samples were subjected to stepwise exposure to hydrazine vapor. The typical sequence
FIG. 4. FTIR spectra recorded for silica film samples on Si(100) in the frequency range 1500–1220 cm−1showing (A) films aged for a month, with AgNO3/surfactant ratios indicated along the spectra; (B) silica films with
AgNO3/surfactant ratio 0.6 (I) freshly prepared, (II) one month old, and
(III) pressed in a KBr pellet; and (C) silica film with AgNO3/surfactant ratio
0.9 upon prolonged reduction, where the reduction time (minutes) is indicated along the spectra.
of color changes observed was colorless/white → pale → orange→ brown → black. The reduction process was moni-tored by UV–Vis and FTIR absorption spectroscopy and POM. In the first step of the reduction process, one observes the fol-lowing: growth of a weak broad absorption band in the visible region of the spectrum between 400 and 500 nm due to the plas-mon mode of metallic silver, disappearance of the IR spectral features (δ-CH2 mode) related to the complex (Fig. 4C), and changes in the morphology of the surface brushes under POM (Fig. 1C). Notice that there is a correlation between POM images and FTIR spectral features that originated from brushes at 1467, 1446, 1427, 1286, and 1254 cm−1. The peak revealed by UV– Vis spectroscopy blue-shifts and becomes narrower and more intense, broad overlapped bands are observed in FTIR spectra, and there is no trace of brushes in POM images upon prolonged reduction. A shiny silver mirror forms on the film surface. This thin layer can be wiped out, leaving a black film behind. Such a black silica film usually displays a plasmon band at∼425 nm, broad bands in IR spectra, and filament-like aggregates of sil-ver in the POM images. Summarizing all of the aforementioned observations, it is clear that silver is in its ion form, is stabilized (dissolved) in surfactant and/or silica matrix, or is complexed as Ag+/surfactant/NO−3 under ambient conditions. However, sil-ver is in a metallic zero-valance state surrounded by surfactant and/or silica matrix in the samples exposed to a low atmosphere of N2H4. The nanometer size of the metallic silver particles accounts for the black color of the silica films. The optical prop-erties and particle size distribution of silver nanoparticles will be discussed elsewhere.
By combining POM images and UV–Vis and FTIR spectra, we can propose that, over certain concentrations of AgNO3in the surfactant, Ag+ions may associate with surfactant molecules
to form complexes. We believe that this is Ag+/surfactant/NO−3, which aggregates upon the removal of water into a soft solid in the samples free of silica source and forms brush-like ag-gregates at the surfaces of silica materials. These agag-gregates at the surfaces of silica are also soft, and we believe they are not different from the complexed samples obtained from the AgNO3/surfactant mixture.
In this paper, we have presented data relevant to the inves-tigation of Ag+ions in the surfactant regions before and after silica addition and polymerization. It is not relevant to compare the FTIR spectral features of the soft LC phase of the mixture and the solid samples made after silica polymerization because the nature of the surfactant molecules before and after silica ad-dition is different. However, we can safely discuss that, upon polymerization of the silica source, Ag+ions are also in their free ion states in the solid matrix, as in the case of the LC phase for low AgNO3/surfactant ratios. Figure 4A shows FTIR spec-tra of samples aged for a month for different AgNO3/surfactant ratios. Notice that there are no spectral changes for the samples obtained from AgNO3/surfactant molar ratios up to 0.6. How-ever, the spectra of the samples with Ag+/surfactant molar ratios of 0.6 and higher display weak complex signals. We believe that this is due to further condensation and polymerization of the silica matrix, which squeeze out some of the Ag+and surfactant to the surfaces of these samples, where they undergo drying and complexing. It was also shown by29Si MAS-NMR spectroscopy that silica polymerizations continue for more than a month. Dag et al. (22) have investigated the increase of the intensity ratio of the Q4band to the (Q2+ Q3) bands (where Q4is fully poly-merized SiO4, and Q3and Q2are originated from O3SiOH and O2Si(OH)2partially polymerized sides, respectively) with time over 2 months. This phenomenon was assigned to further silica polymerization over time in these types of materials (22).
IV. SUMMARY
In this paper, we investigated the stability of the AgNO3and C12H25(CH2CH2O)10OH system in the LC phase with 50 wt% water/surfactant before and after the addition of TMOS up to a AgNO3/surfactant mole ratio of 0.6. AgNO3 and surfactant form complexes at higher mole ratios undergo phase separation from the reaction mixture. The AgNO3/surfactant/H2O/HNO3 system loses both its LC and its templating properties. The ma-terials obtained from the mixtures with AgNO3/surfactant mo-lar ratios 0.7 and higher are amorphous and are disordered in terms of the meso scale. The complex aggregates are soft and have no crystallographically well-defined structures. We believe that complexing is taking place due to the limited solubility of AgNO3in pure surfactant and the coordination of Ag+ions to
surfactant ethoxy groups. This has been established on the ba-sis of our experimental observations and FTIR assignments, but there are no crystallographic data available showing the complex structure.
ACKNOWLEDGMENTS
We gratefully acknowledge the Turkish Scientific Council (T ¨UB˙ITAK) for the financial support in the framework of Project TBAG 1812 and faculty de-velopment grant from Bilkent University. We also thank Dr. S. Petrov for the PXRD measurements.
REFERENCES
1. Kresge, C. T., Leonawicz, M. E., Roth, W. J., Vartuli, J. C., and Beck, J. S., Nature 359, 710 (1992).
2. Feng, X., Fryxell, G. E., Wang, L. Q., Kim, A. Y., Liu, J., and Kemner, K. M., Science 276, 923 (1997).
3. Yang, H., Coombs, N., Sokolov, I., and Ozin, G. A., Nature 381, 589 (1996). 4. Dag, ¨O., Ozin, G. A., Yang, H., Reber, C., and Bussiere, G., Adv. Mater. 11,
474 (1999).
5. Moller, K., and Bein, T., Chem. Mater. 10, 2950 (1998).
6. Winkler, H., Brinkner, A., Hagen, V., Wolf, I., Schmechel, R., Seggern, H., and Fischer, R. A., Adv. Mater. 11, 1444 (1999).
7. Paralo, H., Winkler, H., Kolbe, M., Wohlfart, A., Fischer, R. A., Schmechel, R., and Seggern, H., Adv. Mater. 12, 1050 (2000).
8. Soten, I., and Ozin, G. A., Curr. Opin. Colloid Interface Sci. 4, 325 (1999). 9. L-Marzan, L. M., Giersig, M., and Mulancy, P., Chem. Commun. 9, 3408
(1996).
10. Johnson, S. A., Khushalani, D., Coombs, N., Mallouk, T. E., and Ozin, G. A., J. Mater. Chem. 1, 13 (1997).
11. Inagaki, S., Guan, S., Fukushima, Y., Ohsuna, T., and Terasaki, O., J. Am. Chem. Soc. 121, 9611 (1999).
12. Melde, B. J., Holland, B. T., Blanford, C. F., and Stein, A., Chem. Mater.
11, 3302 (1999).
13. Asefa, T., Maclachlan, M. J., Coombs, N., and Ozin, G. A., Nature 402, 867 (1999).
14. Martin, C. R., Chem. Mater. 8, 1739 (1996).
15. De, G., Gusso, M., Tapfer, L., Catalano, M., Gonella, F., Mattci, G., Mazzoldi, P., and Battaglin, G., J. Appl. Phys. 80, 6734 (1996).
16. Hardicar, V. V., and Matijevi´c, E., J. Colloid Interface Sci. 221, 133 (2000). 17. De, G., Mattei, G., Mazzoldi, P., Sada, C., Battaglin, G., and Quaranta, A.,
Chem. Mater. 12, 2157 (2000).
18. Wang, L.-Z., Shi, J.-L., Zhang, W.-H., Ruan, M.-L., Yu, J., and Yan D.-S., Chem. Mater. 11, 3015 (1999).
19. Cai, W., and Zhang, L., J. Phys. Condens. Matter. 9, 7257 (1997). 20. Ung, T., Liz-Marz´an, L. M., and Mulvaney, P., Langmuir 14, 3740 (1998). 21. Li, T., Moon, J., Morrone, A. A., Mecholsky, J. J., Talham, D. R., and Adair,
J. H., Langmuir 15, 4328 (1999).
22. Dag, ¨O., Verma, A., Ozin, G. A., and Kresge, C. T., J. Mater. Chem. 9, 1475 (1999).
23. Fragala, M. E., Malandr’no, G., and Puglisi, O., Chem. Mater. 12, 290 (2000).
24. Kimura, N., Umemura, J., and Hayashi, S., J. Colloid Interface Sci. 182, 356 (1996).
25. Madler, B., Binder, H., and Klose, G., J. Colloid Interface Sci. 202, 124 (1998).