Contents lists available atScienceDirect
Sensors and Actuators B: Chemical
journal homepage:www.elsevier.com/locate/snbSelf-powered disposable prothrombin time measurement device with an
integrated e
ffervescent pump
Mustafa Tahsin Guler
a, Ziya Isiksacan
b, Murat Serhatlioglu
b, Caglar Elbuken
b,⁎aDepartment of Physics, Kirikkale University, 71450, Kirikkale, Turkey
bUNAM - National Nanotechnology Research Center and Institute of Materials Science and Nanotechnology, Bilkent University, 06800, Ankara, Turkey
A R T I C L E I N F O Keywords: Coagulation Prothrombin time Microfluidics Chemical pump Point-Of-Care 3D printing A B S T R A C T
Coagulation is an essential physiological activity initiated by the interaction of blood components for clot for-mation. Prothrombin time (PT) measurement is a clinical test for the assessment of the extrinsic/common pathways of coagulation cascade. Periodic measurement of PT is required under numerous conditions including cardiovascular disorders. We present a self-powered microfluidic device for quantitative PT measurement from 50μl whole blood. The entire platform is disposable and does not require any external pumping, power, or readout units. It consists of a 3D-printed effervescent pump for CO2generation from a chemical reaction, a
cartridge for two-channelfluid flow (blood and water), and a grid for the quantification of fluid migration distance. Following the introduction of thefluids to the corresponding channel inlets, marking the coagulation start, an acid-base reaction is triggered for gas generation that drives thefluids within the channels. When the blood coagulates, itsflow in the channel is halted. At that point, the distance water has travelled is measured using the grid. This distance correlates with PT as demonstrated through clinical tests with patient samples. This single-unit device has a potential for rapid evaluation and periodic monitoring of PT in the clinical settings and at the point-of-care.
1. Introduction
Blood coagulation is a dynamic hematological activity necessitating the interplay of numerous plasma proteins, cells, and coagulation fac-tors for the formation of cross-linked fibrin networks to prevent bleeding [1,2]. The coagulation cascade is triggered by either extrinsic or intrinsic pathways through the activation of tissue factors or surface, respectively, and leads to a common pathway where stable fibrin strands are formed fromfibrinogen [3,4]. Prothrombin time (PT) test is frequently performed in clinics for the evaluation of the extrinsic and common pathways of the coagulation cascade [5]. Sensitive and peri-odic measurement of this parameter is critical for patients who are under pre-, peri-, and post- operative monitoring or undertaking an-ticoagulant therapy for the regulation of the clotting status by the blood-thinning drugs such as a vitamin K antagonist Coumadin®[6,7]. People with coagulation disorders, atrial fibrillation, pulmonary em-bolism, myocardial infarction, and several other cardiovascular diseases as well as heart valve prosthesis need lifelong anticoagulant therapy [8,9]. However, the medications for the therapy have narrow ther-apeutic windows [10]. Therefore, the required dose varies among in-dividuals andfluctuates for the same patient on a daily basis because of
diet and genetic background [10,11]. The failure to receive main-tenance doses may result in either hemorrhage or thrombo-embolism, which are both life-threatening [12,13]. The conventional practice to monitor the course of the therapy is hospital visits atfixed intervals for PT measurements by benchtop devices. This practice, on the other hand, is time-consuming and expensive, and delayed visits may end up with unfortunate consequences.
Point-of-care devices have been developed to address the issues associated with the benchtop counterparts in clinical settings [14]. Commercial coagulation time measurement devices have been laun-ched to decrease the test turnaround times [15]. Different measurement principles are being utilized including electrochemical detection (Coa-guChek XS), mechanical measurement by a cantilever (CoagMax), or optical detection of the cease of blood flow (Hemochron Signature) [16,17]. These products consist of a main device and disposable test cartridges that contain the necessary reagents, electrodes, magnetic particles, or MEMS structures depending on the measurement principle. Even though these products have a potential for point-of-care testing to facilitate timely intervention in case of emergency, the costs of the main devices make them unaffordable for the majority. Since the health in-surances in most of the countries (including the authors’ homeland)
https://doi.org/10.1016/j.snb.2018.06.042
Received 26 March 2018; Received in revised form 28 May 2018; Accepted 8 June 2018
⁎Corresponding author.
E-mail address:[email protected](C. Elbuken).
Available online 15 June 2018
0925-4005/ © 2018 Elsevier B.V. All rights reserved.
micropumps categorized as non-mechanical (electrowetting, electro-kinetic, electrochemical) and mechanical (rotary, peristaltic, dia-phragm) [27,28]. Of thefirst category, chemical pumps have recently become popular for the construction of self-powered platforms due to their simple fabrication and integration [29]. Examples include the decomposition of H2O2 or N2H4 in the presence of metal substrates
(e.g., Ag, Au, Pt, Pd) for self- electrophoresis [30] or electroosmosis [31], respectively. Methanol is decomposed in a microfluidic device to generate CO2for fluid pumping [32]. Differing from this trend,
che-mical pumps can also be designed without any need for microfabricated substrates. Effervescent tablets used in medical treatment are composed of an acid and a base. Before intake, these tablets are dissolved in water generating CO2 bubbles. As shown in this work, effervescent
micro-pumps can employ acid-base neutralization reactions in aqueous solu-tions that generate enough CO2for long durations to drive fluids in
microfluidic systems for a variety of applications. These effervescent micropumps yield predictable pressures, with rapid response times and long durations at steady-state values, that arefirmly controlled by the type and the molarity of the reactants used in the reactions [33].
In this manuscript, we present a portable and entirely disposable microfluidic device for point-of-care PT measurement from 50 μl whole blood in less than 2 min. The device is lightweight (50 g) and does not require any external components. Even though the device is designed for self-evaluation of the test result, integration of a cell phone makes it an ideal telemedicine application if needed. The key element of this self-powered system is an integrated effervescent pump where an acid-base neutralization reaction generates CO2gas that supplies pressure
for liquid flow within the two-channel test cartridge. The sample channel is for whole blood, whereas the reference channel is for DI water. The assay principle is based on the measurement of the distance travelled by water using an integrated grid upon the cease of the blood flow due to coagulation. We explained the fabrication steps of the 3D-printed effervescent pump and characterization results of the generated pressure and settling time of the pump for different acid and base molarities. Comparative tests were performed at a local clinic using a conventional benchtop device to show the potential of our system for reliable and quantitative PT measurements.
2. Experimental section
2.1. Materials
We obtained ethical approvals from the Ethics Committees of both Yildirim Beyazit University Medical School and Bilkent University. We received informed permission from all the blood donors. We acquired 3 ml intravenous whole blood from each volunteer into vacuum tubes containing 3.2% sodium citrate anticoagulant at most 6 h before the tests. The samples were incubated at 37 °C before use. Thromborel S Human Thromboplastin was purchased from Siemens as the coagula-tion activator reagent. 47.5 mg Thromborel S Human Thromboplastin
The test cartridge design was drawn in a CAD software (Autodesk, AutoCAD 2016). Transparent 3 mm thick polmethyl methacrylate (PMMA) sheet was obtained from a local supplier, and the cartridges were fabricated out of PMMA using a 30 W CO2laser cutter (Epilog,
Zing) [34]. The feed rate, power, and frequency of the cutter were set to 2.6 cm/s, 2.4 W, and 1000 Hz, respectively. The cartridge has a 34 mm x 127 mm rectangular structure. It has two inlets for two sepa-rate serpentine channels. One channel is for the referencefluid (DI water), and the other channel is for the samplefluid (whole blood). The inlet chamber volumes are 85 mm3, and the outlet chamber volume is
16 mm3. The serpentine channels have 80μm height and 250 μm width. The Hagen-Poiseuille law for a steady, laminar, and Newtonianflow states that
=
P QR
Δ (1)
where PΔ is the pressure difference, Q is the volumetric flow rate, andR is the channel resistance [35]. For rectangular channels, the hydro-dynamic resistance for 0 < h/w < 1 is approximated as
= ⎡ ⎣ − ⎤ ⎦ − R ηL wh h w 12 1 0.63 3 1 (2) where η is the dynamic viscosity, L is the channel length, w is the channel width, and h is the channel height. Also,
=
Q wh L
t
Δ
Δ (3)
wheretis the time. Plugging Eqs. (2) and (3) into Eq. (1), we have
= ⎡ ⎣ − ⎤ ⎦ L th P η h w Δ 12 1 0.63 2 (4) DI water dynamic viscosity is lower than whole blood apparent visc-osity, so the waterflows faster in a channel in a given time interval [36]. Therefore, the length of the serpentine channels is found by taking the waterflow into consideration. The clotting time for a whole blood sample is around 110 s at max. The channel length should be suffi-ciently long so that water does not reach the outlet until the coagula-tion, i.e., =t 110 .s ΔPgenerated by the effervescent pump is195mbar
as explained in the next section. Also,h=80μmandη=8.9 10x −4Pa s. .
Plugging these parameters in Eq. (4), the length of the serpentine channel is calculated as 1100 mm.
2.3. Effervescent pump fabrication
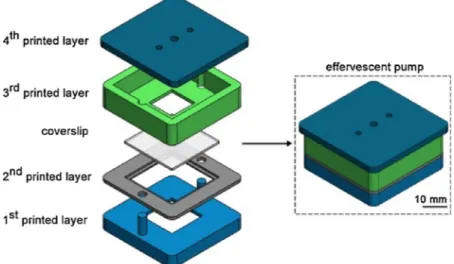
The effervescent pump consists of four polymer layers and a cov-erslip as shown in Fig. 1. The four layers were designed in a CAD software (SolidWorks 2016) and fabricated by a 3D-printer (M200, Zortrax) with 100% infill. The filament was acrylonitrile butadiene styrene (ABS), a thermoplastic polymer used as a
space for aqueous solutionfilling and two posts for the alignment of the other layers. Following the filling of the aqueous solution (1 ml DI water and dissolved base), the 2ndprinted layer is aligned on top of the 1stprinted layer. Afterwards, a glass coverslip with 150μm thickness is
fit in the 2nd
printed layer. Then, the 3rdprinted layer is aligned on top of the 2ndprinted layer. This layer contains a window in contact with the coverslip where we add the acid powder. The 4th printed layer
contains a hole at the center for the insertion of a metal pin and two identical holes for the insertion of tubings. The other ends of these tubings are later inserted to the inlets of the cartridge. A metal pin is covered with a gasket made of soft silicone tubing to prevent gas leakage, and the pin is inserted to the center hole of the 4th layer. Following the insertion, a U-shape PMMA bowl was sealed to the pin bottom. This bowl aims to cover the powder on the coverslip such that any orientation change of the pump does not spread the powder. It also ensures that all the powder falls into the aqueous solution after the coverslip breaking. Following the sealing of the bowl to the pin, we placed the 4thlayer on top of the 3rdlayer. After the alignment of all,
the layers are sealed to one another with epoxy adhesive (Pattex, Henkel) to prevent potential leakage. The pump was then tested up to 250 mbar, and no gas leakage was observed.
2.4. Measurement platform
Referring to Eq. (4), the time at whichfluid travels a certain dis-tance in a microfluidic channel can be measured once the fluid visc-osity, channel dimensions, and applied pressure are known. Using this principle, we aimed at measuring the prothrombin time of a whole blood sample travelling in a microfluidic channel. However, blood is a non-Newtonian fluid, and blood viscosity varies for everyone, de-pending on various hematological and external parameters such as hematocrit, plasma proteins’ concentration, erythrocyte aggregation, and temperature [36,38]. Two different whole blood samples might have the same PT value, but this does not necessarily mean that these samples have the same viscosity. In other words, the quantification of the travel distance of a blood sample is not a correct method for the measurement of PT. Therefore, a reference Newtonian fluid, whose viscosity is constant, is employed along with the whole blood sample for PT measurement. This eliminates the effect of blood viscosity var-iation on test results.
Fig. 2a and b show the schematic representation and photograph of the device excluding the readout grid. The fabricated pump is tightly placed on the cartridge. There are two gas transfer tubings. Each is a silicone tubing (8 mm), one end of which is inserted to the pump. The
other end is inserted to a larger diameter tygon tubing (2 mm) that is inserted to the center hole of a 1 cm x 1 cm PMMA structure. The op-posite side of the PMMA structure has a double-sided tape ready for sealing the cartridge inlets. The cartridge has a sample channel (SC) for whole blood and a reference channel (RC) for coloured DI water. The channels share a common outlet. The activator reagent is lyophilized in Fig. 1. Schematic drawing of the effervescent pump layers and their assembly. The pump has four 3D-printed layers and a glass coverslip. The 1stand 3rdlayers
contain the aqueous solution and acid powder, respectively.
Fig. 2. (a) Schematic representation and (b) photograph of the PT measure-ment device. The device consists of an effervescent pump for CO2generation
and a two-channel transparent cartridge. Gas pressure drives the sample and referencefluids in their serpentine channels. The coagulation stops the sample fluid flow, and the reference fluid flow is manually stopped at that moment. The distance travelled by the referencefluid is correlated with the sample fluid PT. Thefluids used in (b) are DI water coloured with red and black food dyes for demonstration.
the inlet of the SC a few hours before the test (< 6 h). 50μl DI water is pipetted into the inlet chamber of the RC. Fluidic connections are es-tablished between the pump and the channels using tygon tubings.
The following steps are then performed for the measurement: Step 1. 50μl anticoagulated whole blood sample is pipetted into the inlet chamber of the SC. The sample is mixed for 5 s with the lyophi-lized reagent using the pipette to trigger the coagulation process. Then, the PMMA structure is placed on the chamber for the tubing connection between the pump and SC (Fig. 3a). The capillary force or the pressure generated by the placement of the PMMA structure over the inlet does not drive the sample in the serpentine microchannel at this stage due to the channel hydrophobicity.
Step 2. The pump pin is gently pushed down with afinger to break the coverslip (analogous to pressing a START button). The acid powder falls into the aqueous solution, and an acid-base reaction takes place within seconds (Fig. 3b).
Step 3. The generated CO2inside the pump and the gas transfer
tubings apply equal pressure on thefluids in the inlets (Fig. 3b). Step 4. This constant pressure drives both the sample and reference
fluids in their corresponding channels (Fig. 3b).
Step 5. After some time, the samplefluid stops flowing in the SC due to the coagulation, which forms stablefibrin strands trapping the blood cells and adhering to the SC surfaces (Fig. 3c).
The aim is to measure the distance travelled by the referencefluid using the custom-developed grid when the samplefluid stops flowing (step-5). For this purpose, one of two alternative steps can be performed depending on the user’s choice/need.
Step 6. (first alternative) At the instant when the sample fluid stops, the tubing ensuring the connection between the pump and the RC chamber inlet is manually pulled from the corresponding pump hole to prevent further gas transfer. This stops theflow of the reference fluid in the RC. For the clinical tests at the local hospital, we preferred this method and did not experience any difficulty. However, this step might be prone to minor user-mediated error if the user is not attentive en-ough to stop the referencefluid flow at the right time.
Step 6. (second alternative) Following step-2, a video of the device with the grid underneath is recorded using a cell phone for 3 min. For ease of operation, a custom-made cell phone stand was fabricated out of Fig. 3. Schematic representation of the device and the channels while the test is
performed.(a) The blood sample is pipetted into the SC inlet and mixed with the reagent.(b) The pin is pushed, starting the reaction and forming the gas. The generated pressure drives bothfluids. (c) The blood coagulates, and the fluid flow in the channels is observed by eye.
Table 1
The estimated cost for disposable prothrombin time measurement device. Material Dimension/Quantity Cost (USD)
PMMA substrate ∼ 36 cm2 0.38
ABS polymer 3.2 g 0.16
Glass coverslip 4 cm2 0.01
Acid, base 0.06 g, 0.2 g 0.001
Pin, tubing, epoxy, tape – 0.01 Thromborel S
activator reagent
1.9 mg 0.48
Total – ∼ 1
Fig. 4. Characterization of the effervescent pump for different acid and base amounts. The pressure values of CO2generated by the reactions were measured.
(a) Scheme-1: different moles of sodium bicarbonate were dissolved in DI water, and the same mole of citric acid was added to the aqueous solution.(b) Scheme-2: different moles of citric acid were dissolved in DI water, and the same mole of sodium bicarbonate was added to the aqueous solution. Scheme-1 allows smaller settling time and longer stay in the equilibrium pressure in 700 s.
PMMA using the laser cutter. Then, the video can be replayed tofind the frame where the samplefluid stops flowing.
Step 7. The distance travelled by the referencefluid is measured using the grid by naked eye from either the device itself (1stalternative) or from the recorded video (2ndalternative). This distance is a measure
of the PT of the samplefluid.
Referring to step-1, 5-s manual mixing of the blood with the reagent seems a drawback in terms of a potential for user-mediated error. A magnet or a pinch valve could have been used for the same purpose. However, we have not integrated such a mechanism to keep the cost lower. To characterize the time error during the mixing, a co-author performed the same 5-s pipette mixing 50 times. At the same time, another co-author employed a timer to measure the time as a reference. The mean and standard deviation of the repetitive tests are 5.28 s and 0.44 s, respectively. Similarly, we asked 50 different volunteers (age range: 15–65) to perform a pipette mixing. The mean and standard deviation of these tests are 5.26 s and 0.74 s, respectively. In each case, the error is less than 1 s.
Before proceeding to the pump characterization, it is worth noting that the material cost of the entire device is around a dollar as listed in Table 1.
3. Results and discussion
3.1. Effervescent pump characterization
The neutralization reaction between citric acid (H3C6H5O7) and
sodium bicarbonate (NaHCO3) in an aqueous solution yields carbon
dioxide (CO2) and salt [39].
+ + +
H C H O3 6 5 7(aq) 3NaHCO3(aq)à3CO2( )g 3H O2 ( )l Na C H O3 6 5 7(aq)
We employed the gaseous product of this acid-base reaction as the pumping source to drive thefluids in the channels. To find the optimum concentration of the reactants for which the gas pressure reaches the equilibrium value as fast as possible (i.e., low settling time) and keeps its value during the PT measurement (max 100 s), the pump was characterized with different amounts of the acid and base. The two schemes taken into consideration were (1) dissolving the base powder in DI water and then adding the acid powder and (2) dissolving the acid powder in DI water and then adding the base powder. We have also considered adding the acid and base powders to the water at the same time, but that dramatically increased the settling time.
During the pump construction, we added base dissolved aqueous
solution to the 1stlayer and the acid powder to the 3rdlayer for scheme-1, or acid dissolved aqueous solution to the 1stlayer and the base
powder to the 3rdlayer for scheme-2. After the pump construction, we
inserted a metal pin to the center hole and a silicone tubing to one of the side holes of the 4thlayer. The other hole was sealed with silicone
glue to prevent leakage. The other end of the tubing was connected to a pressure sensor (40PC015 G, Honeywell), which was sampled using a data acquisition card (DAQPad-6015, National Instruments, US).Fig. 4a plots the generated pressure for four different concentrations of the dissolved base when the same acid powder amount (0.99 × 10⁻⁴mole) was used.
Let 0.99 × 10⁻⁴be /3. Referring to the chemical equation, the ratio of the stoichiometric coefficient of the acid to the base is 1/3. Therefore, at equilibrium,n/3mole of the acid reacts with n mole of base (red signal,Fig. 4a). In this case, the pressure increases at a slow rate, and the equilibrium pressure cannot be reached within 700 s. Then, n2 , 4n, and8n moles of the base were dissolved for different pumps. In these cases, the acid is the limiting reactant, so regardless of the increase of the base mole, the generated gas amount is always n mole. On the other hand, increasing the base amount from n mole up to
n
8 mole enhances the interaction between the acid and base molecules, resulting in a significant decrease in the settling time. When8nmole of the base is dissolved (black signal,Fig. 4a), the settling time is 5 s; the equilibrium pressure is 195 mbar and it stays constant for 700 s. For the other base amounts, the settling time differs, but if we wait long en-ough, the pressure value reaches to the equilibrium (195 mbar) since the generated gas amount is the same.
Similarly,Fig. 4b plots the generated pressure values for four dif-ferent concentrations of the dissolved acid when the same base powder amount (2.97 × 10⁻⁴mole) was used. Let 2.97 × 10⁻⁴be. At equili-brium, n mole of the base reacts withn/3mole of the acid (red signal, Fig. 4b). We observe that this amount is not enough to reach the equilibrium pressure within 700 s. Therefore, the acid amount was in-creased to n2 /3, then4 /3n , andfinally to8 /3n . In these cases, the base is the limiting reactant, so the generated gas amount is always n mole. As also witnessed inFig. 4a while increasing the base amount, increasing the acid amount here facilitates the molecular interaction and therefore decreases the settling time. On the other hand, in this scheme, none of the reactions could reach the equilibrium gas pressure within 700 s; only the reaction for8 /3n mole of the acid approaches it very closely. The pressure generated by the chemical reaction reaches to the equilibrium value faster in scheme-1 compared to scheme-2. The pre-dissolved reactant (base in scheme-1 and acid in scheme-2) is always Fig. 5. Grid design for quantitative distance measurement. (a) Schematic drawing of the test cartridge demonstrating only the reference channel. (b) The grid for the measurement. The dashed lines correspond to the cartridge borders. The grid has 18 horizontal lines k and 39 vertical lines n.
ready for the reaction, so it is the reactivity of the reactant added later to the aqueous solution that causes this difference. In scheme-1, the added reactant is citric acid whose ionization/dissociation constant is
cartridge. Fig. 5a is the schematic drawing of the cartridge demon-strating only the RC. Point A is where theflow starts from the inlet. Fig. 5b is the designed grid where the dashed lines correspond to the borders of the cartridge. Point B inFig. 5a matches with the bottom red point inFig. 5b. The grid consists of 18 horizontal (k) and 39 vertical (n) lines. The distance between two horizontal lines is 1.5 mm. The vertical lines are divided into two sets: odd (written bottom) and even (written top). The distance between two odd vertical lines and between two even vertical lines is 2.25 mm.
The grid was drawn in a CAD software (Autodesk, AutoCAD 2016) and printed on a white paper. Then, the printed paper was taped on a PMMA layer (thickness: 3 mm, width: 8 mm, length: 15 mm). The car-tridge is placed on the paper grid such that the carcar-tridge stays inside the representative cartridge borders of the paper grid (dashed lines in Fig. 5b). The liquidflow starts with the start of the chemical reaction and ends with the blood coagulation. Following the coagulation, it is read with naked eye to determine the vertical (n) and horizontal line (k) at which the reference liquid has stopped.
If n is odd, the travelled distance is calculated using the following equation,
= + +
Lnk 0.75 [10 36n 2 ]k mm (5)
If n is even, the travelled distance is calculated using the following equation,
= + −
Lnk 0.75 [45 36n 2 ]k mm (6)
where {n | 1≤ n ≤ 39} and {k | 1 ≤ k ≤ 18}. It is also possible that the liquid may stop between two n or two k values. In this case, the user can decide which value to choose. The error will be less than 1.5 mm, which corresponds to 0.1 s error in PT.
3.3. Comparative prothrombin time tests
We performed tests at a clinic to demonstrate the correlation be-tween the referencefluid travel distance measured from the device and the conventionally measured PT time. Human thromboplastin was lyophilized in the sample inlets of the cartridges. The donor whole blood samples were acquired via venipuncture into blood tubes. The tubes were centrifuged to get the plasma portion which was then placed into the benchtop PT analyzer (Sysmex, Siemens). Following the con-ventional PT measurement, 7 whole blood samples whose PT values were between 10 s and 45 s were picked from the sample population (healthy range is: 10–17 s). Afterwards, we introduced 50 μl from a whole blood sample into the sample inlet of a cartridge for a single test. Each blood sample was tested three times. The distances travelled by the sample and the coloured DI water were measured using the Eqs. (5) and (6).
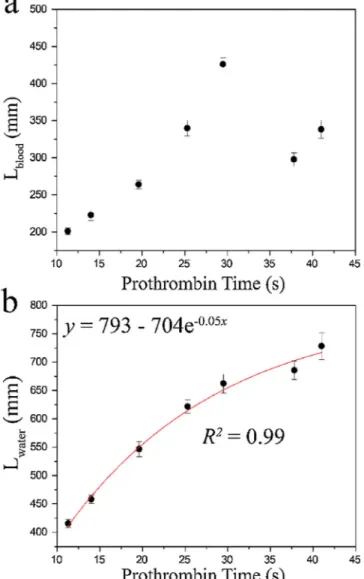
Fig. 6demonstrates the regression analysis for the correlation be-tween the conventionally measured PT versus the distance travelled by the samplefluid (Fig. 6a) and the distance travelled by the reference Fig. 6. Comparing the device with the conventional benchtop PT analyser for
PT measurement. 7 whole blood samples were tested three times. Error bars indicate 2 standard deviations. (a) Conventional PT measurement versus blood travel distance does not have any correlation due to the differences in blood viscosities. (b) Conventional PT measurement versus water travel distance correlates 99% using the exponential function, ( = −y a b e−cx).
Fig. 7. The photograph of the device after the PT measurement test for the case study. The device is an integrated single-unit and consists of a pump, a car-tridge, and a grid. With the coagulation of the blood sample, the green coloured DI water stops at (n, k) = (16, 3), which can be read with naked eye.
fluid (Fig. 6b). No correlation can be seen between the conventional PT and the distance travelled by the samplefluid. Referring to Eq. (4), the viscosity values of the samplefluids are also in play, determining the flow characteristics of the fluids along with their coagulation times. Thisfinding has also rationalized the use of the reference fluid having the same viscosity across the tests. On the other hand, the correlation coefficient between the conventional PT values and the distance tra-velled by the reference fluid is 99% using the following exponential decay function y= −a b e−cx where a = 793, b = 704, and c = 0.05. This trend shows that as the PT value increases, the distance travelled by the water also increases but at a decreasing rate each time. Referring to Eq. (2), the reason for the decreasing rate is the increase in the re-sistance,R, of the channel as thefluid proceeds within the channel (as L increases). The increase in the resistance makes it difficult for the fluid toflow, delaying its progress.
According toFig. 6b, the equation relating the PT (T) to the tra-velled distance (Lnk) is the following:
= ⎡ ⎣ ⎢ − ⎤ ⎦ ⎥ T ln L s 20 704 793 nk (7)
To free the user from any mathematical calculations, we have pre-pared a table tabulating the prothrombin time values (T) for any n and k.
3.4. Personal prothrombin time measurement
The aim of this entirely disposable device is to allow facile PT measurement fromfingerprick blood for home use by the patients. We therefore carried out a case study to demonstrate the potential of the device toward this goal. (I) The pump having the chemicals, pin, and tubings, (II) the cartridge having the green coloured DI water in the reference inlet and lyophilized reagent in the sample inlet, and (III) the paper grid are all integrated together to make the device a single-unit. A test kit was prepared that has a blood lancet, an exact volume pipette (the pipette interior is anticoagulated– see Materials), and the device. The kit was handed to a 65-year old female volunteer who has been undertaking anticoagulant therapy and using Coumadin® for 10 years. Verbal instructions were given to her who performed the steps herself. The left middlefinger was punched using the blood lancet. 50 μl whole blood was taken into the exact volume pipette and then introduced the sample inlet. Following 5 s gentle mixing of the sample with the pipette, the inlet was sealed with the square PMMA structure to establish the tubing connection. The pin of the pump was gently pushed to start the reaction. The whole bloodflow was observed, and when it stopped, the pump side of the tubing, which transfers gas to the water inlet, was manually disconnected from the pump. This immediately stopped the waterflow. Then, the intersection of the vertical and horizontal lines of the grid was read with the eye without any difficulty. The vertical line was the 16th(n = 16) and the horizontal line was the 3rd(k = 3) as
shown inFig. 7. Since n is even, Eq. (6) gives the distance travelled by the water, which isLnk=461.25mm. The prepared table was used to
find the prothrombin time for these n and k values as 15.05 s (marked red inTable 2). The volunteer is asked to repeat the test 5 times in total over the course of one hour. The mean and the standard deviation of the
measured PT are 14.45 s and 0.44 s, respectively. Thefingerprick whole blood of the same volunteer was also tested with Hemochron®Signature Elite (Accriva) as a reference, and the PT was measured as 14 s, which agrees well with the result of the presented device.
The physicians can sometimes be suspicious about the potential of the home-use of the point-of-care devices for two primary reasons [26]. (I) The patient might get an erroneous diagnostic result or no result at all due to wrong use of the device. (II) The patient might get the correct diagnostic result but take a wrong action based on the result such as changing the dose of a medicine. The developed device can still com-fortably be used as a telemedicine platform even if these concerns are present. The test results or the video of the tested cartridge can be shared with a professional for the evaluation of the test result. This eliminates both the wrong use of the device as well as discouraging the user to take actions before informing the physician.
Viscosity of coagulating or non-coagulating whole blood is another clinically relevant parameter, which is often overlooked. The determi-nation of average blood viscosity during coagulation is important to understand the interrelation between coagulation dynamics and he-morheological properties [40,41]. The viscosity of blood is affected by shear rate due to two distinct internal mechanisms that yields its non-Newtonian characteristics: erythrocyte aggregation and erythrocyte deformation [38,42,43]. Thus, it is critical to perform the coagulation time measurements at physiologically relevant flow conditions. The presented double channel structure with a referenceflow channel is a potential platform for such a measurement. Since the referenceflow viscosity is known, the coagulating sample viscosity can be measured, which has clinical value rather than home-use. Then, as a future di-rection, the disposable platform can be used for obtaining the two parameters – PT and viscosity simultaneously from the same blood sample.
4. Conclusion
We presented a portable and entirely disposable device enabling point-of-care prothrombin time measurement from 50μl whole blood in less than 2 min. This device consists of the full integration of an effer-vescent pump, a two-channel test cartridge, and a grid for readout. The use of the effervescent pump, carrying out a neutralization reaction to generate CO2forfluid handling, eliminates the need of external
com-ponents for pumping and energy source. Also, the custom-made paper grid allows easy readout with naked eye, freeing the system from a costly readout unit. The underlying principle is based on the mea-surement of the distance travelled by the referencefluid in a serpentine channel, right after the coagulation process of the samplefluid in the other serpentine channel of the cartridge. The test results performed at a local hospital demonstrated the high correlation between the con-ventionally measured PT and the referencefluid travel distance. The case study revealed the ease-of-use of the device by non-professionals for home use and showed the potential of the device for coagulation screening at the point-of-care. This portable, low-cost, lightweight, disposable, easy-to-use and rapid device is promising for periodic PT measurement from low volume whole blood for both lab- and home-based monitoring.
Table 2
A portion of the n-by-k table tabulating the prothrombin time values (in seconds), for the healthy population range.
n k 1 2 3 4 5 6 7 8 9 10 11 12 13 14 15 16 17 18 12 9.55 9.48 9.41 9.34 9.28 9.21 9.14 9.07 9.01 8.94 8.87 8.81 8.74 8.67 8.61 8.54 8.48 8.41 13 9.72 9.79 9.86 9.93 10.00 10.07 10.14 10.21 10.28 10.35 10.43 10.50 10.57 10.64 10.72 10.79 10.86 10.93 14 12.19 12.11 12.03 11.95 11.88 11.80 11.72 11.65 11.57 11.49 11.42 11.34 11.27 11.19 11.12 11.05 10.97 10.90 15 12.38 12.46 12.54 12.62 12.70 12.78 12.87 12.95 13.03 13.11 13.19 13.28 13.36 13.44 13.52 13.61 13.69 13.78 16 15.23 15.14 15.05 14.96 14.87 14.78 14.69 14.60 14.51 14.42 14.34 14.25 14.16 14.08 13.99 13.91 13.82 13.74 17 15.46 15.55 15.64 15.74 15.83 15.93 16.02 16.12 16.21 16.31 16.40 16.50 16.60 16.70 16.80 16.89 16.99 17.09 18 18.82 18.71 18.60 18.49 18.39 18.28 18.17 18.07 17.96 17.86 17.76 17.65 17.55 17.45 17.35 17.24 17.14 17.04
[4] M. Hoffman, Remodeling the blood coagulation Cascade, J. Thromb. Thrombolysis. 16 (2003) 17–20,http://dx.doi.org/10.1023/B:THRO.0000014588.95061.28. [5] J.L. Hood, C.S. Eby, Evaluation of a prolonged prothrombin time, Clin. Chem. 54
(2008) 765–768,http://dx.doi.org/10.1373/clinchem.2007.100818.
[6] P. Toulon, Y. Ozier, A. Ankri, M.-H. Fléron, G. Leroux, C.M. Samama, Point-of-care versus central laboratory coagulation testing during haemorrhagic surgery. A multicenter study, Thromb. Haemost. 101 (2009) 394–401,http://dx.doi.org/10. 1160/TH08-06-0383.
[7] S.A. Kozek-Langenecker, Perioperative coagulation monitoring, Best Pract. Res. Clin. Anaesthesiol. 24 (2010) 27–40,http://dx.doi.org/10.1016/j.bpa.2009.09. 009.
[8] K. Harter, M. Levine, S.O. Henderson, Anticoagulation drug therapy: a review, West. J. Emerg. Med. 16 (2015) 7–11,http://dx.doi.org/10.5811/westjem.2014. 12.22933.
[9] M. Franchini, G.M. Liumbruno, C. Bonfanti, G. Lippi, The evolution of anticoagulant therapy, Blood Transfus. 14 (2016) 175–184,http://dx.doi.org/10.2450/2015. 0096-15.
[10] J. Hirsh, J. Dalen, D.R. Anderson, L. Poller, H. Bussey, J. Ansell, D. Deykin, Oral anticoagulants: mechanism of action, clinical effectiveness, and optimal therapeutic range, Chest 119 (2001) 8S–21S.
[11] B. Collins, C. Hollidge, Antithrombotic drug market, Nat. Rev. Drug Discov. 2 (2003) 11–12,http://dx.doi.org/10.1038/nrd966.
[12] D.B. Petitti, B.L. Strom, K.L. Melmon, Duration of warfarin anticoagulant therapy and the probabilities of recurrent thromboembolism and hemorrhage, Am. J. Med. 81 (1986) 255–259,http://dx.doi.org/10.1016/0002-9343(86)90260-3. [13] C.S. Landefeld, R.J. Beyth, Anticoagulant-related bleeding: clinical epidemiology,
prediction, and prevention, Am. J. Med. 95 (1993) 315–328,http://dx.doi.org/10. 1016/0002-9343(93)90285-W.
[14] V. Gubala, L.F. Harris, A.J. Ricco, M.X. Tan, D.E. Williams, Point of care diagnostics: Status and future, Anal. Chem. 84 (2012) 487–515,http://dx.doi.org/10.1021/ ac2030199.
[15] W.S. Baker, K.J. Albright, M. Berman, H. Spratt, P.A. Mann, J. Unabia, J.R. Petersen, Clinica chimica acta POCT PT INR— Is it adequate for patient care? A comparison of the Roche coaguchek XS vs. Stago star vs. Siemens BCS in patients routinely seen in an anticoagulation clinic, Clin. Chim. Acta 472 (2017) 139–145,
http://dx.doi.org/10.1016/j.cca.2017.07.027.
[16] L.F. Harris, V. Castro-Lopez, A.J. Killard, Coagulation monitoring devices: past, present, and future at the point of care, TrAC - Trends Anal. Chem. 50 (2013) 85–95,http://dx.doi.org/10.1016/j.trac.2013.05.009.
[17] C.M. Lehman, Instrumentation for the coagulation laboratory, Lab. Hemost. Springer International Publishing, Cham, 2015, pp. 33–43,http://dx.doi.org/10. 1007/978-3-319-08924-9_3.
[18] B. Ramaswamy, Y.T. Yeh, S. Zheng, Microfluidic device and system for point-of-care blood coagulation measurement based on electrical impedance sensing, Sens. Actuators B Chem. 180 (2013) 21–27,http://dx.doi.org/10.1016/j.snb.2011.11. 031.
[19] T.M.A. Gronewold, S. Glass, E. Quandt, M. Famulok, Monitoring complex formation in the blood-coagulation cascade using aptamer-coated SAW sensors, Biosens. Bioelectron. 20 (2005) 2044–2052,http://dx.doi.org/10.1016/J.BIOS.2004.09. 007.
[20] H. Li, D. Han, G.M. Pauletti, A.J. Steckl, Blood coagulation screening using a paper-based microfluidic lateral flow device, Lab Chip 14 (2014) 4035–4041,http://dx. doi.org/10.1039/C4LC00716F.
[21] O. Cakmak, E. Ermek, N. Kilinc, S. Bulut, I. Baris, I.H. Kavakli, G.G. Yaralioglu, H. Urey, A cartridge based sensor array platform for multiple coagulation mea-surements from plasma, Lab Chip 15 (2015) 113–120,http://dx.doi.org/10.1039/ C4LC00809J.
[22] M. Andersson, J. Andersson, A. Sellborn, M. Berglin, B. Nilsson, H. Elwing, Quartz crystal microbalance-with dissipation monitoring (QCM-d) for real time
powered micropumps, Lab Chip 16 (2016) 1797–1811,http://dx.doi.org/10.1039/ C6LC00032K.
[30] T.R. Kline, W.F. Paxton, Y. Wang, D. Velegol, T.E. Mallouk, A. Sen, Catalytic mi-cropumps: microscopic convectivefluid flow and pattern formation, J. Am. Chem. Soc. 127 (2005) 17150–17151,http://dx.doi.org/10.1021/JA056069U. [31] A.A. Farniya, M.J. Esplandiu, D. Reguera, A. Bachtold, Imaging the proton
con-centration and mapping the spatial distribution of the electric Field of catalytic micropumps, Phys. Rev. Lett. 111 (2013) 168301, ,http://dx.doi.org/10.1103/ PhysRevLett.111.168301.
[32] J.P. Esquivel, M. Castellarnau, T. Senn, B. Löchel, J. Samitier, N. Sabaté, Fuel cell-powered microfluidic platform for lab-on-a-chip applications, Lab Chip 12 (2012) 74–79,http://dx.doi.org/10.1039/C1LC20426B.
[33] B.T. Good, C.N. Bowman, R.H. Davis, An effervescent reaction micropump for portable microfluidics system, Lab Chip 6 (2006) 659–666,http://dx.doi.org/10. 1039/B601542E.
[34] Z. Isiksacan, M.T. Guler, B. Aydogdu, I. Bilican, C. Elbuken, Rapid fabrication of microfluidic PDMS devices from reusable PDMS molds using laser ablation, J. Micromech. Microeng. 35008 (9) (2016),http://dx.doi.org/10.1088/0960-1317/ 26/3/035008.
[35] F.M. White, Fluid Mechanics, McGraw Hills, 2010.
[36] O.K. Baskurt, Handbook of Hemorheology and Hemodynamics, IOS Press, 2007. [37] C. Schubert, M.C. van Langeveld, L.A. Donoso, Innovations in 3D printing: a 3D overview from optics to organs, Br. J. Ophthalmol. 98 (2014) 159–161,http://dx. doi.org/10.1136/bjophthalmol-2013-304446.
[38] Z. Isiksacan, M. Asghari, C. Elbuken, A microfluidic erythrocyte sedimentation rate analyzer using rouleaux formation kinetics, Microfluid. Nanofluidics 21 (44) (2017),http://dx.doi.org/10.1007/s10404-017-1878-7.
[39] R.H. Perucci, F.G. Herring, J.D. Madura, C. Bissonnette, General Chemistry: Principles and Modern Applications, Pearson Prentice Hall, 2010.
[40] M. Ranucci, T. Laddomada, M. Ranucci, E. Baryshnikova, Blood viscosity during coagulation at different shear rates, Physiol. Rep. 2 (2014) e12065,http://dx.doi. org/10.14814/phy2.12065.
[41] E. Yeom, J.H. Park, Y.J. Kang, S.J. Lee, Microfluidics for simultaneous quantifica-tion of platelet adhesion and blood viscosity, Sci. Rep. 6 (2016) 24994,http://dx. doi.org/10.1038/srep24994.
[42] Z. Isiksacan, O. Erel, C. Elbuken, A portable microfluidic system for rapid mea-surement of erythrocyte sedimentation rate, Lab Chip 16 (2016) 4682–4690,
http://dx.doi.org/10.1039/C6LC01036A.
[43] M. Kaibara, Rheology of blood coagulation, Biorheology 33 (1996) 101–117,
http://dx.doi.org/10.1016/0006-355X(96)00010-8.
Mustafa Tahsin Guler is a post-doctoral research associate at Kirikkale University. He received his M.S. and pH.D. from Kirikkale University (Turkey). His research interests are in thefield of microfluidics, rapid prototyping, and medical diagnostics.
Ziya Isiksacan is a pH.D. candidate at the UNAM Materials Science and Nanotechnology Program at Bilkent University. He received his M.S. from The University of Edinburgh (UK). His research interests are in thefield of microfluidics, optofluidics, point-of-care diagnostics, and bioelectronics.
Murat Serhatlioglu is a pH.D. candidate at the UNAM Materials Science and Nanotechnology Program at Bilkent University. His research interests are in thefield of flow cytometry, microfluidics, femtosecond laser processing, and MEMS.
Caglar Elbuken is an Assistant Professor at Bilkent University, National Nanotechnology Research Center. His research interests include lab-on-a-chip devices, droplet micro-fluidics, and sensing technologies for portable applications.