I
MECHANISMS OF
SSX GENE EXPRESSION REGULATION
AT THE PROMOTER LEVEL
A THESIS SUBMITTED TO
THE DEPARTMENT OF MOLECULAR BIOLOGY AND GENETICS
AND THE INSTITUTE OF ENGINEERING AND SCIENCE OF
BILKENT UNIVERSITY
IN PARTIAL FULFILLMENT OF THE REQUIREMENTS
FOR THE DEGREE OF
MASTER OF SCIENCE
BY
DERYA DÖNERTAŞ
JULY 2009
II I certify that I have read this thesis and that in my opinion it is fully adequate, in scope and in quality, as a thesis for the degree of Master of Science.
____________________________ Dr. Sreeparna Banerjee
I certify that I have read this thesis and that in my opinion it is fully adequate, in scope and in quality, as a thesis for the degree of Master of Science.
____________________________ Dr. Cengiz Yakıcıer
I certify that I have read this thesis and that in my opinion it is fully adequate, in scope and in quality, as a thesis for the degree of Master of Science.
____________________________ Dr. Ali O. Güre
Approved for the Institute of Engineering and Science
____________________________
Director of Institute of Engineering and Science
III
ABSTRACT
MECHANISMS OF SSX GENE EXPRESSION REGULATION
AT THE PROMOTER LEVEL
Derya Dönertaş
M.S. in Molecular Biology and Genetics
Supervisor: Dr. Ali O. Güre
July 2009, 101 pages
Cancer Testis (CT) Antigen Genes are not transcribed in any of the adult tissues except spermatogonia, oogonia and trophoblasts. This tight regulation of expression is reversed resulting in the reactivation of CT transcription in a wide variety of cancers. CT genes are coordinately expressed and known to be regulated epigenetically. CT genes are reactivated in cancers by a mechanism that leads to the specific hypomethylation of their promoter-proximal sequences. The mechanisms leading to this phenomenon are unknown.
The main objective of this thesis was to further unravel the mechanisms regulating CT gene expression at the promoter level. For this purpose, SSX4 ,a typical CT-X gene known to be under the control of a bidirectional promoter, was chosen as a model. We characterized the minimal critical sequences controlling the sense and antisense promoter and discovered a bidirectional promoter with overlapping promoter activities within a 40 bp region. To study how the antisense promoter could mediate sense promoter repression and vice versa, we used two different reporter genes for each of the promoters in a single construct and found that measurable antisense promoter activity was dramatically reduced upon the introduction of a reporter for the sense promoter.
The SSX4 antisense promoter is capable of producing a noncoding transcript from the neighboring ornitine aminotransferase-like pseudogene in vivo. This, however, wasn’t confirmed in this study. The possibility of transcriptional interference or the production of a small dsRNA that could affect the regulation of SSX4 gene expression is discussed in the context of the data. Results from experiments where the down-regulation of DICER was studied as a mechanism that could influence CT gene expression are also discussed
IV
ÖZET
SSX GENİ İFADESİNİN DÜZENLENMESİNDE ROL ALAN
PROMOTOR MERKEZLİ MEKANİZMALAR
Derya Dönertaş
Moleküler Biyoloji ve Genetik Yüksek Lisansı
Tez Yöneticisi: Dr. Ali O. Güre
Temmuz 2009, 101 sayfa
Kanser Testis (KT) antijen genleri spermatogonya, oogonya ve trofoblast haricindeki yetişkin dokularında ifade edilmeyen genlerdir. İfade edilimdeki bu sıkı düzenleme birçok kanser türünde tersine dönerek KT genlerinin yeniden ifade edilmesine yol açar. KT genleri eşgüdümlü olarak ifade edilir ve ifadeleri epigenetik etmenler tarafından düzenlenir. KT genlerinin kanserlerde yeniden ifade edilmesinin altında yatan neden promotor bölgelerinin özel olarak hipometilasyona uğramasıdır. Bu olaya yol açan mekanizmalar bilinmemektedir.
Bu tezin asıl amacı KT geni ifadesinin düzenlenmesinde rol alan promotor merkezli mekanizmaları açığa çıkartmaktı. Bu amaçla tipik bir KT geni olan ve çift taraflı bir promotora sahip olduğu bilinen SSX4 geni model olarak seçildi. Bu bağlamda, anlamlı (sense) ve anlamsız (antisense) promotor aktivitelerinden sorumlu en küçük DNA dizilerini karakterize ettik ve 40 baz çiftini kapsayan bir bölgede çift yönlü ve örtüşen bir promotor ortaya çıkardık. Anlamsız promotor aktivitesinin anlamlı promotor aktivitesini nasıl baskıladığını anlayabilmek için, bir vektör yapısında her iki promotor için farklı birer haberci gen kullandık. Ölçülebilen anlamsız promotor aktivitesinin, vektör yapısına anlamlı promotorun aktivitesini ölçen haberci genini eklediğimizde önemli ölçüde azaldığını gözlemledik.
Canlı dokularda SSX4 geninin anlamsız promotor aktivitesi, komşu ornitine aminotransferaza benzer yalancı-gen bölgesi üzerinden bir kodlamayan transkript ifade edebilme kapasitesine sahiptir fakat bu transkript ifadesi bu çalışmada onaylanamamıştır. Yazılım karışması ya da küçük çift dizili RNA (dsRNA) oluşumunun SSX4 geni ifadesinin düzenlenmesindeki muhtemel etkileri, bulunan veriler bağlamında ele alınmış ve tartışılmıştır. Ayrıca, DICER geninin bağlı olduğu mekanizmaların KT genleri ifadesinin düzenlenmesine etkisi, DICER geninin azaltarak düzenlendiği deneylerin sonuçları üzerinden tartışılmıştır.
V
To My Family…
VI
ACKNOWLEDGEMENTS
First of all I would like to thank my supervisor Dr. Ali O. Güre for his supervision, patience, encouragement and support throughout this study. He always helped me through the difficulties that I have experienced during this study and always looked on the bright side, unlike me. I would like to thank AOG group members for their support and friendship. I also would like to thank all of my friends in the department for technical support and for their friendship especially to Sinan, Tamer, Fırat, Onur, Nilufer, Gurbet and Atıl. I would like to thank Dr. Mayda Gürsel for her experimental support.
Lastly my deepest thanks are to my family. They have supported me in every decision I made and I am more than grateful to have them in my life.
Throughout my M.S. study, I was personally supported by TÜBİTAK-BİDEB scholarship 2228. This work was also supported by grants from TÜBİTAK and European Commission to Dr. Ali O. Güre.
VII
TABLE OF CONTENTS
SIGNATURE PAGE ... II ABSTRACT ...III ÖZET ... IV DEDICATION PAGE ... V ACKNOWLEDGEMENTS ... VI TABLE OF CONTENTS ... VII LIST OF TABLES ... XI LIST OF FIGURES ... XII ABBREVIATIONS... XV1. INTRODUCTION
1.1 Epigenetic Regulation of Gene Expression ...1
1.1.1 DNA Methylation ...1 1.1.2 Histone Modifications ...1 1.1.3 Chromatin Remodeling ...2 1.2 Cancer Epigenomics ...3 1.3 Eukaryotic Promoters ...4 1.3.1 General Information ...4
1.3.2 ENCODE Findings and Their Importance ...4
1.3.3 Bidirectional Promoters ...5
1.4 Cancer Testis Antigens ...5
1.4.1 General Information ...5
1.4.2 Function and Conservation ...6
1.4.3 Regulation of Expression ...7
1.4.4 Promoters of Cancer Testis Antigens ...8
1.4.5 SSX Gene Family ...9
1.5 Small RNA Mediated Epigenetic Regulation ... 10
1.5.1 miRNAs ... 10
1.5.2 piRNAs ... 11
1.5.3 endosiRNAs and Other Small RNAs ... 11
VIII
1.6 Long Noncoding RNAs ... 14
2. MATERIALS & METHODS ... 16
2.1 Cell Lines and Tissue Culture ... 16
2.1.1 Growth and Passage of the Cell Lines ... 16
2.1.2 Long Term Storage of Cells (Freezing) ... 16
2.1.3 Thawing Cells ... 16
2.2 Commonly Used Methods ... 17
2.2.1 RNA Extraction ... 17
2.2.2 DNase Treatment of RNA ... 17
2.2.3 cDNA Synthesis ... 17
2.2.4 5-Aza-2’-deoxycytidine Treatment ... 18
2.2.5 Agarose Gel Electrophoresis ... 18
2.2.6 Restriction Enzyme Digestions ... 18
2.2.7 Ligation Reactions ... 18
2.2.8 Transformation ... 19
2.2.9 Purification of Plasmid DNA ... 19
2.3 Analysis of OATL Transcript ... 19
2.4 Mapping the SSX4 Minimal Promoters in the Sense and Antisense Orientations ... 20
2.4.1 Promoter Construct Generation 1 : Insert Amplification by PCR ... 20
2.4.2 Promoter Construct Generation 2: Vectors for Luciferase Experiments ... 20
2.4.3 Promoter Construct Generation 3: Restriction Enzyme Digestion and Ligation .. 20
2.4.4 Promoter Construct Generation 4: Vector Construction ... 21
2.4.5 Transient Transfection of the Reporter Constructs ... 21
2.4.6 Luciferase Reporter Assay System ... 21
2.5 Analysis of Bidirectional SSX4 Promoter Activity by Flow Cytometry and Fluorescent Microscopy ... 22
2.5.1 Vectors Used ... 22
2.5.2 Reporter Constructs ... 23
2.5.2.1 pCMV-TRFP (TurboRFP under the control of CMV promoter) ... 23
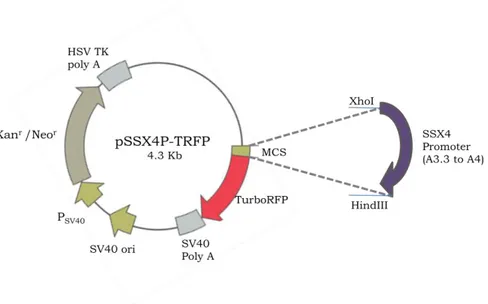
2.5.2.2 pSSX4P-TRFP (TurboRFP under the control of SSX4 Promoter) ... 24
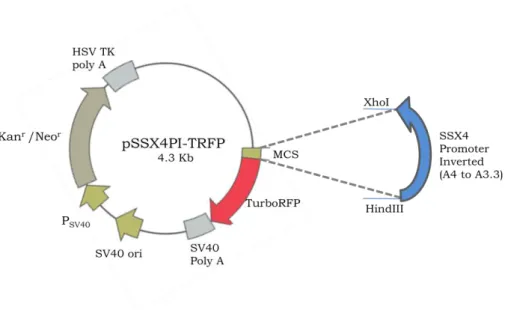
2.5.2.3 pSSX4PI-TRFP (TurboRFP under the control of inverted SSX4 Promoter) .... 24
2.5.2.4 pGFP-SSX4PI-TRFP and pGFPI-SSX4PI-TRFP ... 25
2.5.3 Flow Cytometry ... 26
2.5.4 Fluorescent Microscopy ... 26
IX
2.6.1 Vectors Used ... 27
2.6.2 Generating Stable Clones ... 27
2.6.3 Quantitative Real Time PCR Analysis of DICER1 ... 27
2.7 Bioinformatic Analyses ... 28
2.7.1 Promoter Analyses ... 28
2.7.2 Noncoding RNA Analyses ... 28
2.7.3 Microarray Analyses ... 28
2.8 Recipes ... 29
2.9 Tables ... 30
3. PRELIMINARY DATA AND RATIONALE ... 32
3.1 General Architecture of the SSX4 Promoter ... 32
3.2 Characterization of the SSX4 Promoter ... 33
3.3 Promoter Activity of Various SSX Genes in Different Cell Lines ... 35
3.4 Characterization of Repressive Elements of the SSX4 Promoter ... 36
3.5 Characterization of the Transcription Start Sites of the Bidirectional SSX4 Promoter ... 37
3.6 Objectives and Rationale ... 38
4. RESULTS ... 39
4.1 Mapping the Bidirectional Elements of the SSX4 Basal Promoter ... 39
4.1.1 Mapping SSX4 Promoter Elements Responsible for Transcription in the Sense Orientation... 39
4.1.2 Mapping SSX4 Promoter Elements Responsible for Transcription in the Antisense Orientation... 41
4.1.3 Overlapping Promoter Elements Direct Transcription in Opposite Orientation .. 43
4.2 OATL Transcript Analysis ... 43
4.2.1 Detection of the SSX4/OATL Transcript ... 46
4.2.2 Detection of the SSX7/OATL Transcript ... 48
4.2.3 Detection of a Universal OATL Transcript ... 49
4.2.4 Detection of OATL Transcripts Using Bioinformatics As A Tool ... 50
4.3 Analysis of Bidirectional SSX4 Promoter Activity by Flow Cytometry and Fluorescent Microscopy ... 52
4.3.1 Flow Cytometry ... 53
4.3.2 Fluorescent Microscopy ... 57
4.4 Search for Bidirectional Promoters by Using Bioinformatics As A Tool ... 59
X 4.5.1 Investigating the Effect of DICER1 in the Regulation of CT Gene Expression Using
Bioinformatics As A Tool ... 62
5. DISCUSSION AND FUTURE PERSPECTIVES ... 65
5.1 Mapping of the SSX4 Promoter ... 65
5.2 RNA Based Silencing Mechanisms and the Role of DICER in the regulation of CT Gene Expression ... 68
5.3 Analysis of OATL Transcript ... 73
6. REFERENCES ... 76
7. APPENDICES ... 89
APPENDIX A. GENERATION OF SSX4 SENSE AND ANTISENSE PROMOTER MAPPING CONSTRUCTS ... 90
APPENDIX B. DICER1 Q-RT-PCR EXPERIMENTS ... 93
XI
LIST OF TABLES
TABLE 1. OATL and GAPDH PCR Primers ... 30
TABLE 2. PCR Primers for SSX4 Promoter Mapping (Sense Orientation) ... 30
TABLE 3. PCR Primers for SSX4 Promoter Mapping (Antisense Orientation) ... 31
XII
LIST OF FIGURES
FIGURE 1.1
SSX4 in the genomic context ... 9
FIGURE 1.2 The substrates for endosiRNA production in flies and mouse ... 12
FIGURE 2.1 Map of pTurboRFP_PRL construct ... 22
FIGURE 2.2 Map of pHygEGFP ... 23
FIGURE 2.3 Map of pCMV-TRFP ... 23
FIGURE 2.4. Map of pSSX4P-TRFP ... 24
FIGURE 2.5 Map of pSSX4PI-TRFP ... 25
FIGURE 2.6.a. Map of pGFP-SSX4-TRFP ... 25
FIGURE 2.6.b. Map of pGFPI-SSX4-TRFP ... 26
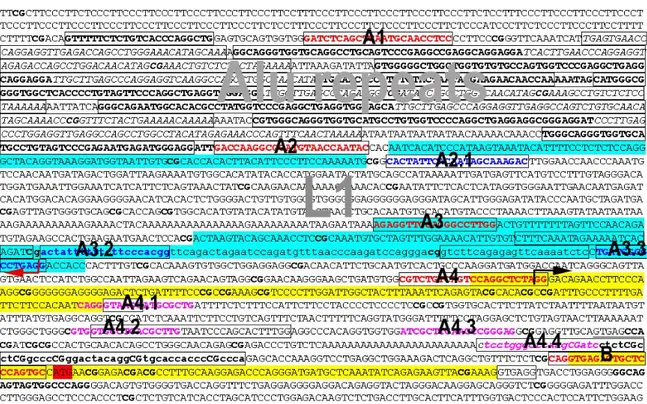
FIGURE 3.1. The general architecture of SSX4 promoter ... 32
FIGURE 3.2. Sequence of the SSX4 promoter-proximal region ... 33
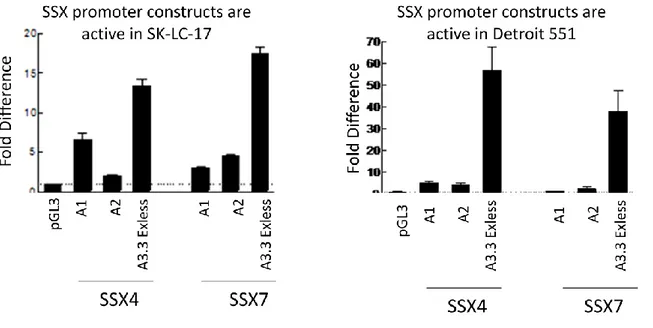
FIGURE 3.3. Luciferase activity of SSX4 promoter-reporter constructs ... 34
FIGURE 3.4. Luciferase activity of SSX4 and SSX7 promoter constucts ... 35
FIGURE 3.5 Analysis of the repressive element 5' to the minimal promoter ... 36
FIGURE 3.6. Transcription Start Sites identified by RACE analysis ... 37
FIGURE 4.1 Sub-regions within the SSX4 promoter that were individually analyzed for
promoter activity ... 39
FIGURE 4.2. Sense promoter mapping constructs ... 40
XIII
FIGURE 4.4 Antisense promoter mapping constructs ... 41
FIGURE 4.5. Promoter activity in the antisense orientation of A3.3-A4 sub-fragments ... 42
FIGURE 4.6. Summary of all results from sense and antisense promoter mapping
experiments ... 43
FIGURE 4.7 The two most active promoters in sense and antisense orientation ... 43
FIGURE 4.8. OATL transcript identified by 5’RACE analysis ... 44
FIGURE 4.9 Homology of OATL sequences ... 45
FIGURE 4.10. OATLA2 (forward) and OATLB2 (reverse) primers in the context of homologous
OATL sequences ... 46
FIGURE 4.11 OATLA2-OATLB2 primers in context of the SSX4 promoter region ... 47
FIGURE 4.12 SSX7/OATLA (forward) and SSX7/OATLB (reverse) primers in the context of
homologous OATL sequences ... 48
FIGURE 4.13 OATLA4 (forward) and OATLB4 (reverse) primers in the context of homologous
OATL sequences ... 49
FIGURE 4.14 OATLA4-OATLB4 primers in the context of SSX4 promoter region ... 50
FIGURE 4.15. UCSC Browser showing UCSC genes, Refseq genes, human mRNAs, spliced
ESTs, and RNAdb Antisense ncRNA in the location chrX:48,090,0807-48,137,729 ... 51
FIGURE 4.16 Flow cytometry results of untransfected SK-LC-17 cells ... 53
FIGURE 4.17 Flow cytometry results of pHygEGFP transfected SK-LC-17 cells ... 53
FIGURE 4.18 Flow cytometry results of pCMV-TRFP transfected SK-LC-17 cells ... 54
FIGURE 4.19 Flow cytometry results of pSSX4P-TRFP transfected SK-LC-17 cells ... 54
FIGURE 4.20 Flow cytometry results of pSSX4PI-TRFP transfected SK-LC-17 cells ... 55
FIGURE 4.21 Flow cytometry results of pGFPI-SSX4PI-TRFP transfected SK-LC-17 cells ... 55
XIV
FIGURE 4.23 Fluorescent microscopy images of pHygEGFP transfected SK-LC-17 cells ... 57
FIGURE 4.24 Images from light and fluorescence microscopy of pHygEGFP or pCMV-TRFP
transfected SK-LC-17 cells ... 58
FIGURE 4.25 Fluorescent microscopy images of pGFP-SSX4PI-TRFP transfected LC-17 cells . 58
FIGURE 4.26 Predicted SSX4 promoters by Genomatix Software ... 60
FIGURE 4.27 Predicted NY-ESO-1 promoters by Genomatix Software ... 61
FIGURE 4.28. GENESPRING analysis of the GSE6427 data filtered for CT genes ... 63
FIGURE 4.29. GENESPRING analysis of dye-swap GSE6427 data filtered for CT genes ... 64
FIGURE 5.1 EndosiRNAs can be produced by bidirectional transcription ... 69
FIGURE 5.2 Methylation analysis of genomic DNA in cancer cell lines ... 70
FIGURE 5.3 Illustration of sense and antisense promoters of an active L1 repeat ... 71
XV
ABBREVIATIONS
Ago Argonaute
bp Base pair
CAGE Cap Analysis Gene Expression CT Cancer Testis
DNMT DNA Methyltransferase
dsRNA Double stranded RNA
ENCODE Encyclopedia of DNA Elements
L1 LINE1 Repeat
MAR Matrix Associating Region
miRNA MicroRNA
ncRNA Noncoding RNA
nt Nucleotide
OATL Ornithine Amino Transferase Like
ORF Open Reading Frame
piRNA Piwi-interacting RNA rasiRNA Repeat-associated RNA
RdRP RNA dependent RNA Polymerase
RISC RNA-induced Silencing Complex
RNA Pol II RNA Polymerase II
SEREX Serological Screening of Expression Libraries siRNA Small Interfering RNA
SSX Synovial Sarcoma X-Translocation
TF Transcription Factor
TSA Trichostatin A
TSS Transcription Start Site
1
1. INTRODUCTION
1.1 Epigenetic Regulation of Gene Expression
1.1.1 DNA Methylation
Epigenetics refers to heritable phenotypic alterations in the absence of DNA sequence changes. DNA methylation is one of the extensively studied epigenetic alterations. In eukaryotes, ranging from plants to humans, DNA methylation is found exclusively at cytosine residues. In mammals, cytosines can be methylated only if they are followed by a guanine residue (CpG). CpG methylation is vital for organisms (mice that lack DNA Methyltransferases (DNMT) do not live) (Li E, 1992). In mammalian systems the genomic DNA methylation is found throughout the genome with the exception of short unmethylated regions called CpG islands, which contain larger than expected rate of CpG residues over a span of more than 500 nucleotides (Suzuki MM, 2008; Takai D, 2002). DNA methylation generally associated with suppression of transcription as well as with cellular processes like genomic imprinting, X chromosome inactivation, gene- and tissue-specific expression (Bernstein BE, 2007). DNA methylation is a dynamic, yet heritable trait enabling long-term memory of transcription rates. Three DNA Methyltransferases act on CpGs in mammals: Dnmt1 as the maintenance methyltransferase which acts on hemi-methylated DNA during DNA replication (Bestor T, 1988), Dnmt3a and Dnmt3b as de novo methyltransferases playing both collaborative and unique roles mostly in development (Okano M, 1999).
DNA methylation analysis can be performed by sequencing or restriction digestion preceded by sodium bisulfite treatment (COBRA assay: COmbined Bisulfite Restriction Analysis) (Frommer M, 1992) More recently developed techniques enable, genome-wide analysis of methylation status by microarray hybridization or high-throughput sequencing of bisulfite treated DNA samples.
1.1.2 Histone Modifications
Histone modifications that result in alterations of gene expression are also major epigenetic mechanisms. Nucleosome is the basic structural unit that consists of four core histones – H2A, H2B, H3 and H4 – around which 147 bp DNA is wrapped. Another histone protein, H1, is called the linker histone brings the nucleosomes closer into a more compact 30 nm fiber structure. The core histones have critical roles in epigenetic regulation of gene expression. N-terminal and C-terminal tails of the
2 histone proteins can be covalently modified by lysine acetylation, lysine and arginine mono-, di- and tri-methylation, serine and threonine phosphorylation, lysine ubiquitination, lysine sumoylation and proline isomerization (Kouzarides T, 2007). Specific combinations of these modifications are thought to constitute a “histone code”. The histone code determines the euchromatic/heterochromatic regions of the DNA (Barski A, 2007), regulates biological processes like transcription, replication and repair through recruitment of chromatin remodeling complexes and confers a long-term memory of the transcriptional state, which have roles in development and differentiation (Jenuwein T, 2001).
Histone modifications are usually analyzed by chromatin immunoprecipitation (ChIP) using antibodies specifically recognizing modified residues. The generation of histone maps of human, mouse and yeast have been successfully performed by high throughput assays based on hybridizing ChIP samples on arrays (ChIP on chip) or by massively parallel signature sequencing of ChIP samples (ChIP-Seq) (Barski A, 2007)
1.1.3 Chromatin Remodeling
Another important concept in the epigenetic regulation of gene expression is chromatin remodeling. The most important complexes involved in chromatin remodeling are Polycomb (PcG) and Trithorax (trxG) Complexes which are initially found in D.melanogaster Hox gene repressors and activators respectively (Schuettengruber B, 2007). There are two classes of PcG proteins; Class II is directly involved in repression of transcription while class I is methyltransferase complexes that maintain the repressed state (Levine SS, 2004). PcG proteins are recruited to target genes’ polycomb response elements (PREs) via sequence-specific DNA-binding factors and/or by specific histone modifications such as H3K27me3. PREs are typically several kilobases long and also are bound by the trxG proteins (Schuettengruber B, 2007). There are also the ATP-dependent chromatin remodelers SWI/SNF (a TrxG complex), NuRD/Mi-2/CHD and INO80 families which have been found to play different roles in chromatin remodeling (Saha A, 2006).
All these epigenetic events are interconnected: Methylated DNA binding proteins can be recruited to the cytosine methylated DNA along with histone deacetylases (Nan X, 1998) and/or nucleosome modifiers as a complex (Zhang Y, 1999). Covalent modifications of histones are found to occur coupled chromatin remodeling by ATP-dependent remodeling machinery, which supports the notion that DNA cytosine methylation, histone modification, and nucleosomal remodeling are intimately linked (Jones PA, Baylin SB 2007)
3
1.2 Cancer Epigenomics
For decades, scientists have been engaged in dissecting the origins of human cancer in genetics, and now with an explosion of data, it has been realized that genetics and epigenetics cooperate at all stages of cancer development. A very well known epigenetic event in human cancers is the transcriptional silencing of tumour suppressor genes by CpG-island-promoter hypermethylation which dates back to 1989 when it is discovered in Retinoblastoma gene (Greger V, 1989) and becomes widely accepted when p16INK4a was also shown to be inactivated by hypermethylation (Gonzalez-Zulueta M, 1995; Herman JG, 1995). Today, 100-400 CpG islands are estimated to be hypermethylated in a given tumor (Esteller M, 2007). Along with DNA methylation alteration, global histone modifications are also seen in many cancers. For instance, loss of acetylation at lysine 16 and trimethylation at lysine 20 of histone H4 are common hallmarks of human cancer (Fraga MF, 2005)
A second kind of alteration of DNA methylation common in human cancers is “global” or “genome-wide” hypomethylation, defined as an overall decrease in methylcytosine content of up to 70% compared with the level in normal somatic cells (Ehrlich M, 2002). Retrotransposon sequences of the LINE (long interspersed nuclear element) and SINE (short interspersed nuclear element) classes, as well as classical satellites are major targets of methylation in normal circumstances, but they become demethylated to various degrees in cancer cells (Hoffmann MJ, 2005). Global hypomethylation levels show variation both within and between the cancer types. Global hypomethylation appears to be an early event for colon and breast cancer as well as chronic lymphocytic leukemia. For other cancers like hepatocellular carcinoma, the degree of hypomethylation seems to increase with stage or histological grade but it is almost ubiquitous in metastases (Wilson AS, 2007). Along global hypomethylation, region specific hypomethylation of single copy genes also occurs, as exemplified by cancer testis antigen genes. The mechanisms underlying DNA hypomethylation are still under study. It has been suggested that the global hypomethylation can be a result of methyl group metabolism (a decrease in the methyl donor substrate S-adenosylmethionine (SAM)), a defect in DNA modifying enzymes like DNMTs or a defect in chromatin remodeling enzymes which can affect DNA methylation (Hoffmann MJ, 2005). However, we find it difficult to reconcile these explanations with gene specific hypomethylation. It has been suggested that functional selection during the random hypomethylation can result in gene-specific hypomethylation; however, given the fact that most of the cancer testis antigen genes do not have similar functions, we find it hard to support this hypothesis. Another possibility is that noncoding endogenous antisense RNAs might be playing a role in this type of hypomethylation, which was demonstrated for some cases (Imamura T, 2004). The mechanisms by which DNA hypomethylation occurs in cancer cells still needs further research.
4
1.3 Eukaryotic promoters
1.3.1 General Information
The RNA polymerase II core promoter comprises the sequences that direct the initiation of transcription. In the classical view, for the transcription of mRNAs, RNA Polymerase II recruitment to DNA is a major step that is facilitated by the general transcription factors (GTFs), including TFIIB, TFIID, TFIIE, TFIIF and TFIIH which is termed initiation; followed by promoter escape, abortive transcription, elongation and finally transcription termination. Transcriptional activators/ repressors binding to several proximal and distal control regions and the “histone code” can facilitate or repress transcription (Koch F, 2008).
In fact, mammalian promoters can be separated into two classes. The classic view of the promoters constitute one class that have a TATA box and other elements such as BRE (TFIIB recognition element), Inr (Initiator), MTE (motif ten element), DPE (downstream core promoter element). These elements are not universal and each is present in only a subset of core promoters. These elements are recognized by the factors that will eventually recruit transcription machinery. The other type of promoters can be characterized as being CpG rich, lacking the TATA Box and having multiple transcription start sites distributed over a broad region (Juven-Gershon T, 2008). Recently in the largest TSS identification study to date, using CAGE technology (as part of the ENCODE project(Encyclopedia Of DNA Elements)), the TATA-box promoter architecture was found to represent only a minority of mammalian promoters in mouse and humans and this kind of promoter is commonly associated with tissue-specific genes (Carninci P, 2006). This finding was later confirmed by the results of different technologies in the context of The ENCODE Project Consortium 2007.
1.3.2 ENCODE Findings and Their Importance
The ENCODE project was initiated in September 2003, and aimed to identify all functional elements in the human genome by using various technologies in a number of laboratories. The project started with two components - a pilot phase and a technology development phase. In the pilot phase, 1% of the genome that was randomly selected was analyzed in detail. An initial finding emerging from the ENCODE consortium was that a vast amount of DNA, not annotated as known genes, was transcribed and, therefore, named transcriptionally active regions (TARs). Most of these RNAs were not found to encode for a protein and were therefore, considered as non-coding RNAs (ncRNAs). Except those that are evolutionary and/or structural conserved, we know very little about ncRNAs or their roles
5
inside the cell. We now know thanks to ENCODE that most of the genome is actually transcribed. Various unannotated TSSs were identified by ENCODE as well as the fact that the location of sequences that have a role in regulation of gene expression are very dispersed and in some cases can be located within the first exon, intron or the entire body of the gene or actually reside closer to another gene. Additionally, a significant fraction (up to 20%) of pseudogenes was found to be transcriptionally active contributing to TARs.
1.3.3 Bidirectional Promoters
Some of the non-TATA box containing, high GC containing, more evolvable promoters are bidirectional (Juven-Gershon T, 2008). This annotation refers to regions where two transcripts with opposite orientations occur simultaneously, or when a single promoter initiates two transcripts that might or might not overlap. In a genome wide study, it has been found that 10% of all genes are bidirectional genes controlled by bidirectional promoters. Many of the bidirectional transcript pairs are coexpressed but some are antiregulated. By transient transfection experiments using reporter genes, more than half of all human promoters were found not to exhibit strong directionality in transcript initiation and that the regulatory elements for the transcription in both directions are shared (Trinklein ND, 2004). It has been suggested that these nucleosome-free promoters are sites for cryptic noncoding RNA transcription which might have a regulatory function. (Neil H, 2009)
1.4.Cancer Testis Antigens
1.4.1 General Information
Cancer testis (CT) antigen genes are normally expressed mainly in germ cells but in no other adult tissues, with rare exception of trophoblast. This gene expression pattern is disrupted in malignancies leading to CT expression in various types of cancers. Since the protein products of these genes are generally immunogenic, they are considered as potential biomarkers and targets for immunotherapy (Scanlan MJ, 2002). The first CT antigens were found in the early 1900s by T-cell epitope cloning. By this method MAGE-1 (van der Bruggen P, 1991 and Traversari C, 1992), BAGE (Boël P, 1995) and GAGE (Van den Eynde B, 1995) antigens were identified. With the development of SEREX (Serological screening of expression libraries) technique many other CT antigens were identified such as SSX-2 (Türeci O, 1998) and NY-ESO-1 (Chen YT, 1997). Subsequently, in silico approaches led to the identification of most other CT antigen genes such as SSX4 (Gure AO, 2002). The CT antigen genes
6 were found to be members of multigene families and mostly localized to the X chromosome. Currently more than 70 CT gene families that are testis-restricted and immunogenic are known that have varied properties, localizations and expression profiles (Almeida LG, 2009). All of the data about the gene, gene expression, protein, protein expression, immunogenic response and pubmed links of the known CTs are combined and stored in a recent database, Ctpedia, which can be accessed from the website of Ludwig Institute for Cancer Research ( http://www.cta.lncc.br/index.php).
There are certain characteristics of CT antigens. Their expression is restricted to gametogenic tissues and cancer, the coding genes of the antigens frequently map to chromosome X, they exist as multigene families and they are immunogenic in cancer patients. Their expression is heterogenous in cancers, they are activated by DNMT inhibitors and/or histone deacetylase inhibitors in vitro and their expression seems to be associated with tumor progression and with tumors of high metastastic potential (Scanlan MJ, 2002). Subsequent to the discovery of the immunogenic CT antigen genes, several other genes were coined with the same designation. However, it seems that those CT antigen genes that reside on the X chromosome are distinct from those on somatic chromosomes and are thus referred to as CT-X genes (Simpson AJ, 2005). Non-X chromosome CT genes do not necessarily code for immunogenic proteins, they are not composed of large families with highly homologous members and their expression pattern is not as restricted as that of CT-X genes. While CT-X gene expression is primarily found in spermatogonia and oogonia, non-X CT gene expression is frequently absent in these cells and present in gametes of later stages (Simpson AJ, 2005).
1.4.2 Function and Conservation
The biological functions of many of the CT antigens are not known although some exceptional CT antigens have been found to have roles during meiosis like OY-TES-1 (Baba T, 1994), CT-15/Fertilinβ (Vidaeus CM, 1997) and SCP-1 (Meuwissen RL, 1992). Unlike other CT antigens that are mostly expressed in spermatogonia, both OY-TES-1 and CT15/Fertilinβ are expressed in late stage sperm and they are not localized in the X chromosome. Among the major CT gene families, only some MAGE orthologs have defined functions. Mouse MAGE3-B4 plays role in germ cell development; mouse necdin binds to E2F1 and negatively regulates G1 to S progression. MAGE-A4 binds to the Gankyrin or p28 protein and inhibits the adhesion-independent growth of Gankyrin-overexpressed cells (Xiao J, 2004). Recently MAGE-A3/6 was identified as a novel target of fibroblast growth factor 2-IIIb (FGFR2-IIIb) signaling in thyroid cancer cells (Kondo T, 2007). Other functional CT genes are BORIS and CAGE. BORIS (brother of the regulator of imprinted sites) is the paralog of the abundant transcription factor
7 CTCF, and has been proposed to play role in CT-regulation according to the three studies showing BORIS and CTCF binding to NY-ESO-1 and MAGE-A1 promoters, resulting in derepression of both antigens (Vatolin S, 2005; Hong JA, 2005 and Kang Y, 2007) Some other CT antigens have some functional domains that may be an indication of their potential role but still these functions need to be explored. Along with the unknown functions, CT genes are almost exclusively specific to primates, with few exceptions. Human CT genes have orthologs in primates, especially in great apes and they are generally located on the same chromosomes (Stevenson BJ, 2007).
1.4.3 Regulation of Expression
All typical cancer testis genes located on the X chromosome are expressed only in the spermatogonia of the adult human but in no other tissue. Attempts to identify additional CT antigen genes based on the hypothesis that they should be expressed in the testis resulted in the discovery of genes that were classified as testis-restricted, tissue-restricted (expressed in ≤2 of 13 non-gametogenic tissues tested), differentially expressed (expressed in 3-6 non-gametogenic tissues, among 13 tested) and ubiquitously expressed (Scanlan MJ, 2004). These are clearly very different than CT-X genes as explained above. The initially-discovered, major CT gene families fall in the testis- and tissue-restricted groups and the rest of this work will focus on only these genes. We use the CT abbreviation in this context.
CT genes are reactivated heterogenously in a wide variety of cancers with the broadest distribution in germ cell tumors, melanomas and lung carcinomas, various adenocarcinomas and chondrosarcomas (Hofmann O, 2008) No genetic mutations have been found in these genes that can be the cause of this reactivation . The first clue about the regulation of CT antigens emerged as the upregulation of the expression of the MAGE-1 tumor antigen (later designated MAGE-A1) upon induction with the demethylating agent 5-aza-2'-deoxycytidine (Weber J, 1994) DNA demethylation as a reactivation mechanism for MAGE-A1 was confirmed soon after (De Smet C, 1996). Along with MAGE-A1, other CT antigens (De Smet C, 1999; Sigalotti, 2002; LimJH, 2005) were also found to be regulated by DNA methylation, supporting the idea that CT genes are coordinately expressed which was subsequently demonstrated (Gure AO, 2005). This, in turn, supported the idea that CT gene expression could be governed by common epigenetic mechanisms (Scanlan MJ, 2002). In another experiment HCT-116 cancer cell lines lacking DNMT genes were used to assess the expression of MAGE-A1, NY-ESO-1, and XAGE1. The results showed that the genetic knockout of both DNMT1 and DNMT3b could robustly induce CT antigen gene expression; whereas individual DNMT1 or DNMT3b knockout had a modest or negligible effect (for XAGE they were found to act independently). This is
8 another indicative of DNA methylation as a major mechanism in the regulation of CT gene expression (James SR, 2006). Along with the DNA methylation, it was found that histone acetylation plays a secondary role as trichostatin A was able to significantly upregulate 5-aza-2’-deoxycytidine induced MAGE or SSX gene expression (Wischnewski F, 2006; Gure AO, 2002). Interestingly, most CT genes are known to harbor CpG islands. We currently know that although most of the CpG islands from other genes are hypomethylated in the adult tissue, promoters of CT genes are hypermethylated in the normal adult tissue except testis and become hypomethylated in malignancies. The mechanism of hypomethylation of CT genes might be related to global DNA hypomethylation observed in cancer cells (De Smet, 1996; Kaneda A, 2004). But it has been shown that in tumor cells expressing MAGE-A1, the 5' region is significantly less methylated than the other parts of the gene showing a promoter specific hypomethylation rather than an artifact of global hypomethylation (De Smet C, 2004). It was suggested that site-specific hypomethylation of MAGE-A1 in tumor cells relies on a transient process of demethylation followed by a persistent local inhibition of remethylation due to the presence of transcription (De Smet C, 2004).
Another insight for the regulation of expression of CT antigens comes from experiments where the effect of BORIS protein (brother of the regulator of imprinted sites, a homologue of CTCF) on CT gene expression was studied. During spermatogenesis, expression of BORIS is restricted to germ cells, and coincides with a marked decrease in CTCF expression, erasure of methylation patterns, and up-regulation of CT genes (Loukinov DI, 2002). In one study, conditional expression of BORIS was shown to activate expression of CT antigen genes, and activation of BORIS expression following 5-aza-2’-deoxycytidine treatment occurred hours prior to transcriptional activation of other CT genes. Furthermore, downregulation of BORIS by RNA interference prior to 5-aza-2’-deoxycytidine treatment reduced the capacity of 5-aza-2’-deoxycytidine to activate MAGE-A1 expression suggesting a role for BORIS in the regulation of CT gene expression (Vatolin S, 2005). BORIS was also shown to bind directly to the MAGE-A1 and NY-ESO-1 promoters and to displace CTCF at these loci (Vatolin S, 2005; Hong JA, 2005).
1.4.4 Promoters of Cancer Testis Antigens
CT genes have in common a TATAless promoter, which is heavily methylated and thus silent in normal tissues. The first promoter analysis of a CT gene was performed in 1995 with MAGE-A1 gene. Two inverted Ets motifs were found to drive 90% of the activity of the MAGE-A1 promoter. When episomally expressed, the MAGE-A1 promoter was transcriptionally active even in tumor cells which did not express MAGE-A1 gene (De Smet C, 1995; Scanlan MJ, 2002). This indicated that in tumor cell
9 lines that do not express MAGE-A1, transcription factors capable of inducing MAGE-A1 promoter activity are present but that the gene is insensitive to their action.
1.4.5 SSX Gene Family
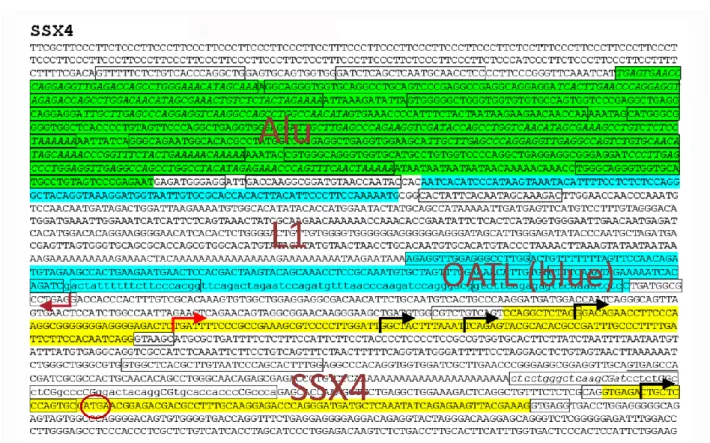
Synovial sarcoma X-translocation (SSX) genes were first identified as fusion counterparts to SYT in in t(X;18)(p11.2;q11.2) chromosomal translocation that is present in 70% of synovial sarcomas (Clark J, 1994). The first found member of the SSX as a CT antigen (HOM-MEL-40) by SEREX was SSX2 (Sahin U,1995; Türeci O, 1996). By genome homology searches all 9 members of the SSX family together with 10 pseudogenes were identified (Gure AO, 1997). Like most of the other cancer testis antigens, SSX also mapped to X chromosome, in particular to the OATL1 and 2 regions on Xp11.2 (Clark J, 1994) SSX family members have high homology ranging from 89 to 95% at the nucleotide level and 77 to 91% at the amino acid level (Gure AO, 1997). The 10 SSX genes listed by Ctpedia include; SSX1, SSX2, SSX2B, SSX3, SSX4, SSX4B, SSX5, SSX6, SSX7 and SSX9. There are 2 SSX2 and 2 SSX4 genes located tail to tail and head to head orientation, respectively (Gure AO, 2002). Normal testis tissue expresses SSX1, 2, 3, 4, 5 and 7 but not 6, 8 or 9. SSX6 expression, however, can be induced by TSA in some tumor cell lines (Gure AO, 2002). SSX proteins appear to be transcriptional regulators, whose actions are mediated primarily through association with or recruitment of Polycomb group repressors by the SSX-RD domain, mapped to the C-terminal of SSX proteins (Ladanyi M, 2001). LIM homeobox protein LHX4 was identified among the proteins that interact with the SSX C-terminal repression domain (de Bruijn DR, 2008).
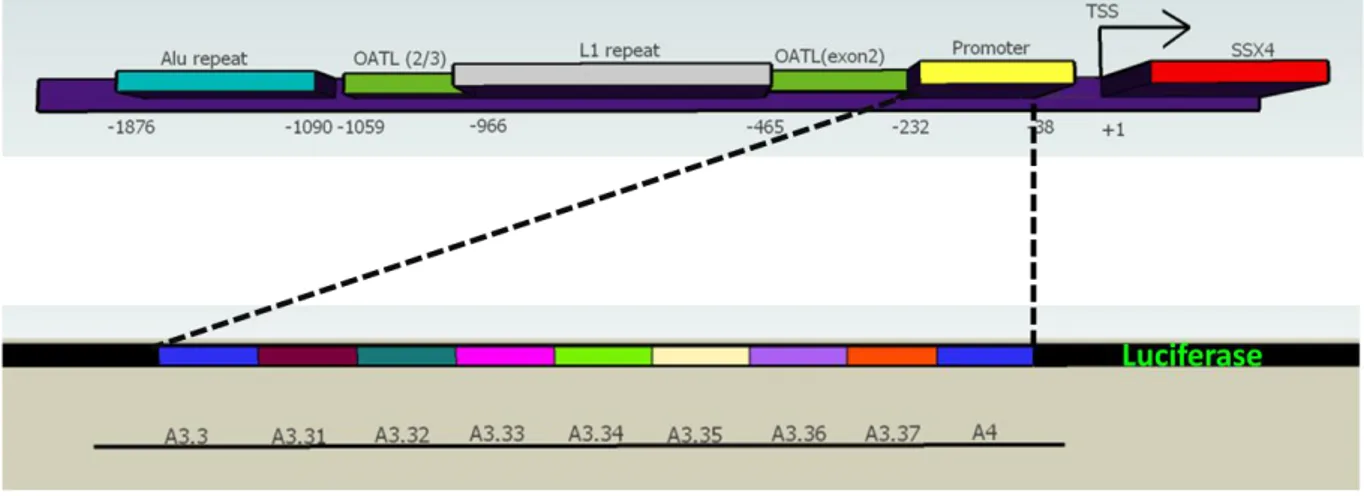
SSX4 and SSX4B are nearly identical copies that are positioned in a head to head manner in the Xp11.23 (Figure 1.1). There are two splice variants of SSX4 (Gure AO, 2002).
FIGURE 1.1 SSX4 in the genomic context
SSX4 has a testis selective expression pattern. It has been shown to be expressed in a percent of hematologic malignacies, brain cancer, hepatocellular carcinoma, non small cell lung carcinoma, melanoma, ovarian carcinoma and synovial sarcoma (Ctpedia).
10
1.5 Small RNA Mediated Epigenetic Regulation
The first small RNA, lin‑4, was discovered in 1993 by genetic screens in nematode worms (Lee RC, 1993; Wightman B, 1993). After this discovery, with the help of new technologies like deep-sequencing and strong computational predictions, the number and types of small RNAs increased extensively. The known functions of small RNAs range from heterochromatin formation to mRNA destabilization and translational control (Chu CY, 2007; Filipowicz W, 2008) and they are involved in almost every biological process, including developmental timing, cell differentiation, cell proliferation, cell death, metabolic control, transposon silencing and antiviral defense.
The distinguishing patterns of well known eukaryotic small RNAs are their limited size (~20–30 nucleotides (nt)) and their association with Argonaute (Ago) family proteins that lie in the heart of small RNA pathways. Ago proteins bind various <32nt small RNAs which guide the Argonaute complexes to their regulatory targets. The Ago family proteins can be grouped into two clades: the Ago subfamily and the Piwi subfamily. At least three classes of small RNAs are encoded in our genome, based on their biogenesis mechanism and the type of Ago protein that they are associated with: microRNAs (miRNAs), endogenous small interfering RNAs (endosiRNAs or esiRNAs) and Piwi‑interacting RNAs (piRNAs). Although these are the three main small RNAs that we know for sure, numerous other small RNAs are being discovered in the light of the recent developments (Kim VN, 2009).
1.5.1 miRNAs
The best understood among the three small RNA classes are miRNAs which are single‑stranded RNAs (ssRNAs) of ~22 nt in length and generated from endogenous hairpin shaped transcripts (Kim VN, 2005) Two RNase III-type proteins, Drosha and Dicer, are known to be critical for miRNA biogenesis. Mature miRNAs are then loaded into the RNA-induced silencing complex (RISC) whose core component is a protein belonging to the Ago family. The miRNAs guide the RISC complex to its target mRNA by basepairing with the 3′-untranslated region (3’UTR) of the target mRNA which typically leads to translational repression and exonucleolytic mRNA decay (Kim VN, 2009). Although the vast majority of miRNAs seem to act exclusively in the cytoplasm and mediate mRNA degradation or translational arrest (Filipowicz W, 2008), some plant miRNAs may act directly in promoting DNA methylation (Bao N, 2004). Furthermore, recent studies have described promoter-directed human miRNAs that can lead to repressive chromatin modifications and transcriptional gene silencing
11 (Gonzalez S, 2008; Kim DH, 2008). Over one third of human genes are predicted to be directly targeted by miRNAs according to computational analysis (Kim VN, 2009).
1.5.2 piRNAs
piRNAs were originally discovered during small RNA profiling studies of D. melanogaster development (Aravin AA 2001, 2003). piRNAs are endogenous, germ cell‑specific small RNAs, generally longer than miRNAs (24–29 nt). Most of the piRNAs correspond to intergenic repetitive elements including transposons, thus initally named repeat‑associated small interfering RNAs (rasiRNAs) (Aravin AA, 2003). The name piRNAs was coined after the interaction of Piwi subgroup proteins with these small RNAs was demonstrated. piRNAs are highly abundant in germ cells and at least some of them are involved in transposon silencing through heterochromatin formation or RNA destabilization (Kim VN, 2009). Intriguingly, the biogenesis of piRNAs does not depend on Dicer (Vagin VV, 2006) and occurs in a so called “ping-pong” mechanism in which formation of 5′ terminus within piRNA precursors is guided by piRNAs originating from transcripts of the other strand in concert with the Slicer activity of PIWI. Along with the fact that Aub and AGO3 (members of PIWI family) exhibited Slicer activity in vitro, this mechanism relies on the observation that Aub- and Piwi-associated piRNAs show a strong preference for uracil at their 5′ ends while AGO3-Piwi-associated piRNAs show a strong preference for adenine at nucleotide 10 and AGO3- and Aub-associated piRNAs revealed pairs of RNAs showing complementarities in their first 10 nucleotides (Gunawardane LS, 2007). piRNAs have been identified in D. melanogaster, C. elegans and mammals, but seem to be absent in fungi and plants.
1.5.3 EndosiRNAs and Other Small RNAs
The first endosiRNAs were detected in plants and C. elegans and found to be products of RNA-dependent RNA polymerase (RdRP). A mammalian counterpart to RdRP has not been identified yet, and thus, these small RNAs were thought to be absent in mammalian cells. However, recently endosiRNAs have been shown to be ubiquitously present among higher eukaryote cells. The first mammalian endosiRNAs to be reported correspond to the long interspersed nuclear element (L1) retrotransposon and were detected in cultured human cells (Yang N, 2006). Full-length L1 contains both sense and antisense promoters in its 5′ UTR that could, in principle, drive bidirectional transcription of L1, producing overlapping complementary transcripts that can be processed into
12 siRNAs by Dicer. However, the precise mechanism by which transposons trigger siRNA production in mammals remains unknown (Yang N, 2006).
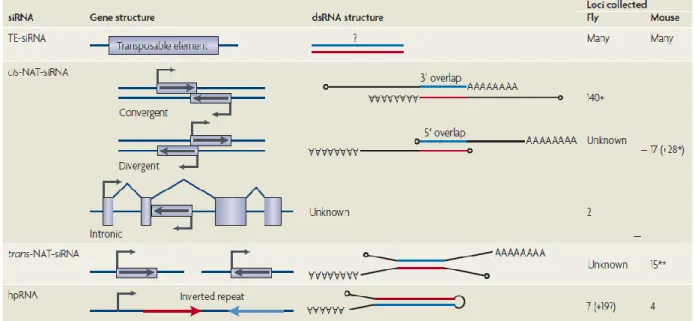
More recently, deep sequencing of small RNAs in D. melanogaster somatic tissue, cultured cells and ovaries has revealed a population of small RNAs (~21 nt long) that could readily be distinguished from miRNAs and piRNA as explained below. These small RNAs were found to be derived from transposon transcripts, sense–antisense transcript pairs and long stem‑loop structures, Figure 1.2 (Babiarz JE, 2008; Okamura K, 2008; Kawamura Y, 2008; Czech B, 2008 ; Ghildiyal M, 2008; Chung WJ, 2008; Okamura K, 2008 )
Okamura K, Lai EC. Nat Rev Mol Cell Biol. 2008
FIGURE 1.2 The substrates for endosiRNA production in flies and mouse. Four classes of siRNA are shown: TE-siRNA, generated by overlapping transcripts corresponding to a transposable element, generated either in cis or trans; cis-NAT-siRNA, generated by overlapping transcripts that result due to the simultaneous activity a bidirectional RNA PolII promoter; trans-NAT-siRNAs, that result from mRNA homology forming in trans; hairpin RNAs (hpRNA) that generate siRNAs
The precise structure of the double-stranded RNA substrates of siRNAs derived from transposable elements is unknown, but hundreds or thousands of transposable elements are inferred to directly generate siRNAs. siRNAs derived from cis-natural antisense transcripts (cis-NATs) involve bidirectional transcription across the same genomic DNA, and can be convergent, divergent or involve annotated introns and/or internal exons. Trans-NAT dsRNAs form between transcripts that are produced from distinct genomic locations, and usually comprise an mRNA and an
antisense-13
transcribed pseudogene. siRNAs that are derived from hairpin RNA (hpRNAs) are long, inverted repeat transcripts whose double-stranded segment is typically much longer than that of miRNA precursors.
EndosiRNA production is Dicer dependent, Drosha independent and they are associated specifically with Ago2 in Drosophila (Kawamura Y, 2008; Czech B, 2008). Suppression of retrotransposons (and also some mRNAs) by endosiRNAs in Drosophila were observed mostly in the germ cells, and particularly in oocytes. This tissue specificity might relate to the fact that, other cell types may possibly invoke an interferon response to the dsRNAs produced intracellularly (Okamura K, Lai EC, 2008). EndosiRNAs have also been identified in mouse oocytes. As in flies, mouse endosiRNAs are 21 nucleotides, Dicer-dependent and derived from a variety of genomic sources (Tam OH, 2008 ; Watanabe T, 2008) A subset of mouse oocyte endosiRNAs map to regions of protein-coding genes that are capable of pairing to their cognate pseudogenes, and to regions of pseudogenes that are capable of forming inverted repeat structures which strengthens the theory that some pseudogene sequences may be under evolutionary selection to retain the ability to produce antisense transcripts that can pair with their cognate genes to produce endosiRNAs (Sasidharan R, 2008).
There are also promoter associated dsRNAs that have been shown to induce transcriptional gene silencing in DNA methylation dependent manner in plants (RNA dependent DNA Methylation) (Wassenegger M, 1994). Gene silencing by promoter associated dsRNAs has also been observed in human cells but in the absence of DNA methylation (Morris KV, 2004; Park CW, 2004; Ting HA, 2005). Along with endosiRNAs, synthethic antigene RNAs (agRNAs) complementary to the transcription sites of the genes, are also potent inhibitors (Janowski BA, 2005) or activators of gene expression (Li LC, 2006; Janowski BA, 2007). The agRNAs use AGO proteins and target antisense transcripts transcribed from the transcription start sites and bring different protein complexes to the transcription start sites (Schwartz JC, 2008).
1.5.4 Small RNA-mediated Control of Transposons
The PIWI-clade proteins and their associated piRNAs have important roles in the control of transposons in the germline — and possibly somatic cells — of D. melanogaster and mammals (Aravin AA, 2007). Three groups of data suggest that endosiRNAs are also a part of transposon regulation. First, in plants, viroids that possess host homologous sequences in their genomes cause fully methylation of the homologous sequences in the host (Wassenegger, 1994). Second, RNA viruses which contain homologous sequences to the host elicited the same effect (Jones L , 1998;
14 Wang MB, 2001) and lastly, the introduction of an inverted repeat containing transgene triggers methylation of both the transgene and the homologous sequences elsewhere in the genome of Arabidopsis thaliana (Mette MF, 2000). There are certain theories as to how dsRNAs that regulate transposon expression may arise. It is thought that such RNA should be similar to a read-through transcript from a single promoter that results in an inverted repeat thus producing an RNA hairpin or cryptic antisense promoters that confer bidirectional transcription.
There exists large amounts of data about small RNA mediated transcriptional silencing and chromatin remodeling; mostly in plants or fungi. In Drosophila, it is known that the role of the PIWI protein in repeat-induced gene silencing and heterochromatin assembly seems to involve a direct association between PIWI and HP1 (Brower-Toland B, 2007) There are adaptor proteins that bind to the Argonaute family of proteins and to chromatin or other DNA associated molecules. A mammalian counterpart to these adaptor proteins, however, has not been determined to date (Moazed D, 2009).
1.6 Long Noncoding RNAs (ncRNAs)
Although the current literature seems to be mostly focused on small RNAs, there are increasing numbers of reports describing long transcripts (longer than ~200 nucleotides) that are noncoding but yet functional in gene regulation. The transcription of these long ncRNAs is not random but strictly regulated. When compared with mRNAs, sequence conservation is low among most ncRNAs. One reason for this could be that process rather than the product of transcription has a functional consequence (Mercer TR, 2009). Functions of such ncRNAs are being identified and include roles in high order chromosomal dynamics, telomere biology and subcellular structural organization (Amaral PP, 2008). Although ncRNA mediated gene expression regulation would be expected to occur in trans, it does affect expression of neighboring genes. This cis-effect-like trans-regulation is referred to as transvection (Mercer TR, 2009)
Recently some examples have been found indicating the ability of long ncRNAs to regulate gene expression at the level of chromatin modification, transcription and post-transcriptional processing. Long ncRNAs can mediate epigenetic changes by recruiting chromatin remodelling complexes to specific genomic loci. For example, one of the ncRNAs expressed from human homeobox (Hox) loci, silences transcription across 40 kb of the HOXD locus in trans by inducing a repressive chromatin state by recruitment of the Polycomb chromatin remodelling complex PRC2 (Rin JL, 2007) For the transcriptional regulation, long ncRNAs can recruit RNA binding proteins and integrate them to the the transcriptional programme as in the case of CyclinD1. Long ncRNA recruits RNA binding protein
15 TLS which in turn inhibits the histone acetyltransferase activities of CReB binding protein and p300 and thus inhibits CyclinD1 expression (Wang X, 2008). With recruiting and affecting different proteins into the transcriptional programme, long ncRNAs can also activate transcription. Furthermore ncRNAs can basepair with mRNAs in a highly specific manner and regulate various steps in the post-transcriptional processing of mRNAs, including their splicing, editing, transport, translation and degradation (Mercer TR, 2009).
There is an increasing interest in the potential involvement of ncRNAs in disease etiology. For example, an antisense ncRNA transcribed from the p15 tumor suppressor locus induces local changes primarily of histone modifications, thereby regulating p15 expression. Thus, this ncRNA is potentially involved in oncogenesis as its expression is inversely correlated with that of p15 in leukemia. In this particular example, it is important to note that the effect of the noncoding antisense RNA was: 1. Dicer independent; 2.Its continued presence was not required for heterochromatinization, suggesting the sufficiency of a temporary presence for long lasting epigenetic alteration (Yu W, 2008).
16
2. MATERIALS & METHODS
2.1 Cell lines and Tissue Culture
2.1.1 Growth and Passage of the cell lines
The lung cancer cell line SK-LC-17, and two colon cancer cell lines, HCT 116 (ATCC #CCL-247 ) and HT-29 (ATCC #HTB-38) were grown in RPMI medium (GIBCO # 22400089) supplemented with 10% Fetal Bovine Serum (GIBCO #10106151), 1% Penicillin/Streptomycin (GIBCO #15070063) and 1% Non-essential Aminoacids (GIBCO #11140035 in 5% CO2 at 37°C. Cell culture medium was changed every two to four days. For subculturing, cells were washed with 1X PBS (see recipes) which was prepared and filtered before use. Trypsin-0.25%EDTA (GIBCO #25200056) was used to detach the cells. Cells were split at a dilution of 1:2 to 1:5 depending on the conditions of the cells. Media and aliquoted trypsin were kept at 4°C, Trypsin-0.25%EDTA was kept at -20°C and all solutions were warmed in 37°C water bath before use.
2.1.2 Long Term Storage of Cells (freezing)
For long term storage in liquid nitrogen, exponentially growing cells were harvested and centrifuged at 1300 rpm for 3 minutes at 4°C. Cells were counted and resuspended in freezing medium (10%DMSO, 20%FBS and 70%RPMI) at a concentration of approximately 3X10⁶ cells/ml. The suspension was aliquoted into 1 ml per cryotube and incubated at -20°C for a few hours, followed by -70°C for overnight, and finally placed in liquid nitrogen.
2.1.3 Thawing cells
The cryotube containing cells stored in liquid nitrogen was placed into an ice bucket immediately. The cryotube was then transferred into a 37°C water bath until only a small piece of ice remained visible. The cell suspension was then diluted into 5 ml of RPMI by decanting and not by pippetting and centrifuged for 3 minutes at 1300 rpm. Cells were resuspended in 5 ml of medium and seeded into a 25 cm3 flask. Cells were incubated overnight in the incubator and were passaged next day.
17
2.2. Commonly Used Methods
2.2.1 RNA Extraction
RNA extraction was performed using TRI-Reagent (MRC #TR 118) according to the protocol given by manufacturer. Briefly, cells that were grown in 75cm3 flasks were collected by trypsinization and centrifuged at 1300 rpm for 3 minutes at 4°C. Media was removed and cells were homogenized in 1ml TRI-Reagent. 200µl chloroform was added, vortexed for 15 seconds and the mixture was centrifuged 15 minutes at 13000rpm. The supernatant was collected and 500µl Isopropanol was added. The mixture was centrifuged 10 minutes at 14000 rpm and washed once with 75% and twice with 100% Ethanol. The pellet was dissolved in 250µl DNase-RNase free water and its concentration was read by NanoDrop ND-1000 Fullspectrum UV/Vis Spectrophotometer (Thermo Fisher Scientific). RNAse/DNAase free tubes and tips were used throughout the procedure.
2.2.2 DNase treatment of RNA
For DNase treatment of RNA, DNA-free ™Kit (Applied Biosystems #AM1906) was used. 1µl of rDNaseI was used per 10µg of RNA in 50µl including 10X DNaseI Buffer and incubated at 37°C for 30 minutes. For some of the samples that were known to be contaminated by genomic DNA an additional 1µl of rDNaseI was added to the mixture after this step and incubated for a further 30 minutes. 5µL of DNase Inactivation Reagent was added, vortexed and incubated at room temperature for 2 minutes by mixing occasionally. The sample was then centrifuged at 10000g for 1.5 minutes and the supernatant, including RNA, was transferred to another tube. The final concentration was 200ng/µl. RNAse/DNAase free tubes and tips were used throughout the procedure.
2.2.3 cDNA synthesis
cDNA synthesis was performed by DyNAmo™ cDNA Synthesis Kit (Finnzymes #F- 470S) according to manufacturer’s instructions. During cDNA synthesis random hexamers were used to be able to detect noncoding RNAs.
18
2.2.4 5-aza-2'-deoxycytidine treatment
5-aza-2'-deoxycytidine (Sigma A3656) was used to treat cells at a concentration of 5mg/ml final per day for 4 days. The drug was prepared at a concentration of 5 mg/ml and stored at -70°C in aliquots of 10µl.
2.2.5 Agarose Gel Electrophoresis
Agarose gels were prepared by completely dissolving agarose in 1x TAE electrophoresis buffer at a percentage of 1.5% in microwave and ethidium bromide was added to final concentration of 30 μg/ml. 20µl of samples were mixed with 5X DNA loading buffer and loaded onto gels for the PCR products. The gel was run in 1x TAE at 90V for 45minutes.
2.2.6 Restriction Enzyme Digestions
The restriction enzyme digestions were performed in 20µl to 50µl reaction volumes with appropriate buffer at 37°C overnight.
2.2.7 Ligation Reactions
For ligation reactions, T4 DNA ligase (Promega # M1804) was used. For ligation reactions the necessary amounts of vector and insert were calculated by the following formula with 3:1insert to vector ratio and for 100 ng of vector.
19
2.2.8 Transformation
For transformation, E.coli DH5α strain was used. Competent bacteria were prepared by the calcium chloride method and competent cells were stocked at -70°C in 150µl aliquots. For transformation, 50 to 100ng of ligation products were incubated with thawed competent cells on ice for 30 minutes. Cells were then incubated at 42°C for 30 seconds and immediately placed on ice again and incubated for 2-3 minutes. 850µl of LB was then added and the cells were grown in a 37°C shaker (220rpm) for one hour. Cells were centrifuged at 13000 rpm for 20 seconds, and resuspended in 100µl LB which was then plated by the spread plate technique on an LB-agar plate containing the selective antibiotic and was incubated overnight at 37°C. pGL3 plasmid is resistant to ampicillin, pTurboRFP-PRL plasmid is resistant to kanamycin and pSicoR PGK Puro is resistant to Ampicillin.
2.2.9 Purification of plasmid DNA
Purification of plasmid DNA was performed using the QIAprep Spin Miniprep Kit (Qiagen #27106) or home-made method of plasmid purification for miniprep. Briefly, 1.5 ml of overnight culture of a single colony was centrifuged at 13000rpm for 1 minute. Cells were resuspended in 100µl of solution P1 (recipes) and then 200µl P2 and 150µl P3 were added respectively. The mixture was centrifuged at 13000rpm for 10 minutes and the supernatant was transferred to a clean tube. The DNA was extracted by 100% EtOH and washed with 75% EtOH and dissolved in 50µl DNase-RNase free water. For the large scale plasmid DNA purification (maxiprep) the same home-made protocol was used with the appropriate amount of the solutions adjusted to maxiprep
2.3 Analysis of OATL transcript
The PCR primers used to detect OATL transcripts are listed in Table1. Primer Tms were calculated according to the following formula: Tm = 69.3°C + 0.41 (%GC) - 535/n, where n is primer length. For PCR reactions DyNAzyme II HS DNA polymerase (Finnzymes #F-504), dNTP mix (Finnzymes #F-560), forward and reverse primers at final concentrations of 0.03 U/μl, 250 μM and 500 nM, respectively were used in a total volume of 20µl. GAPDH primers were used as a positive control for testing RNA integrity and cDNA amplification. PCR was carried out under the conditions of 94°C for 10 min followed by 35 cycles of 94°C for 60s, 60 s at the appropriate melting temperature, 72°C for 60s, with a final extension at 72°C for 10 min, in an Applied Biosystems 9700 PCR machine.
20
2.4 Mapping the SSX4 minimal promoters in the sense and antisense orientations
2.4.1 Promoter Construct Generation 1: Insert Amplification by PCR
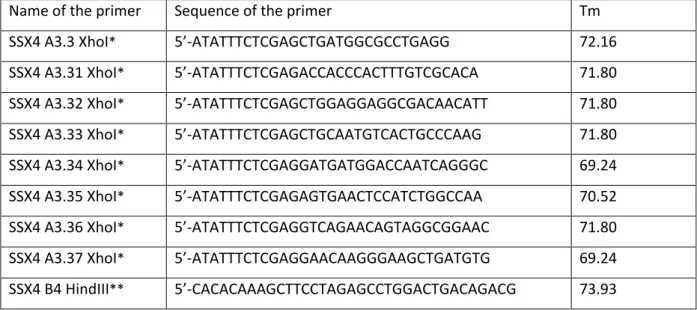
Individual promoter fragments were amplified by PCR to generate products that would then be cloned into the luciferase reporter vector pGL3. The primers used for forward (sense) promoter analysis are listed in Table2 and the primers used for the reverse (antisense) promoter analysis are listed in Table3.
PCR with the appropriate primers were performed with 10 ng of a construct containing the SSX4 promoter region corresponding to -2000 to +1 in reference to the transcription start site as a template. Two PCR reactions for each fragment were performed and all of the PCR products were loaded to 1.5% agarose gel and run as explained before (Figure S1). The fragments were isolated from gel using QIAGEN Gel Extraction Kit (QIAGEN # 28706) according to the manufacturer’s instructions.
2.4.2 Promoter Construct Generation 2: Vectors for luciferase experiments
pGL3-Basic (Promega #E1751) vector was used for the promoter activity analyses. The vector lacks eukaryotic promoter and enhancer sequences that control the firefly luciferase gene so that the expression of luciferase depends on the putative promoter that can be cloned within the MCS immediately upstream the luciferase ORF. The pGL3-Basic vector lacking an insert cotransfected with the pRL-TK (Promega E2241) vector was used as an internal control reporter. pRL-TK contains herpes simplex virus thymidine kinase (HSV-TK) promoter 5’ to Renilla luciferase to provide low to moderate levels of Renilla luciferase expression in co-transfected mammalian cells.
2.4.3 Promoter Construct Generation 3: Restriction Enzyme Digestion and Ligation
XhoI (New England Biolabs #R0146L), HindIII (New England Biolabs # R0104L) restriction enzymes were used to double digest both the vector and the PCR fragments using NEB Buffer4 (Figure S2). Ligation reactions were performed as explained in section 2.6
21
2.4.4 Promoter Construct Generation 4: Vector construction
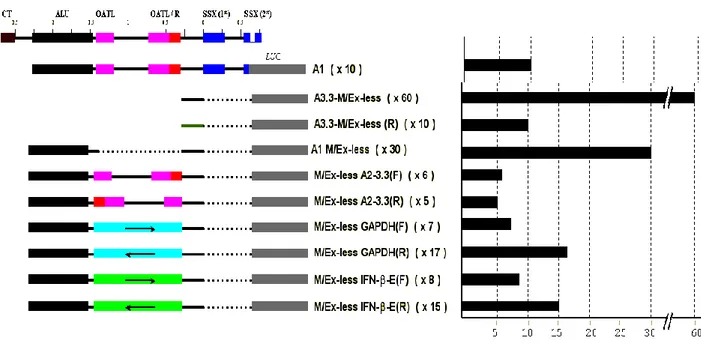
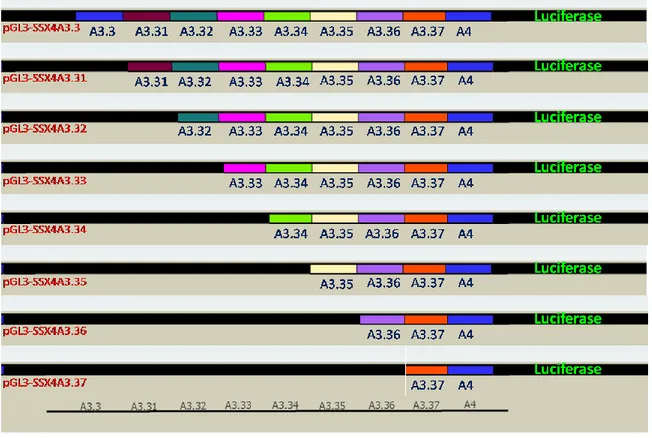
For the fine mapping of the minimal forward promoter SSX4A3.3, SSX4A3.31, pGL3-SSX4A3.32, pGL3-SSX4A3.33, pGL3-SSX4A3.34, pGL3-SSX4A3.35, pGL3-SSX4A3.36, pGL3-SSX4A3.37 constructs were prepared. For the fine mapping of the minimal reverse promoter, pGL3-SSX4A3.3R, pGL3-SSX4A3.31R, pGL3-SSX4A3.32R, pGL3-SSX4A3.33R, pGL3-SSX4A3.34R constructs were prepared. (Figure 4.2 and Figure 4.4) To control the integrity of the constructs, XhoI and HindIII double digestions were performed to excise the fragments (Figure S3).
2.4.5 Transient Transfection of the Reporter Constructs
For transfection experiments LipofectamineTM 2000 (Invitrogen #11668-019) was used. For luciferase reporter experiments, cells were plated in a 24-well culture plate according to the manifacturer’s instructions. 0.8 µg pGL3 vector containing the promoter fragment to be tested was diluted in 50µl OPTI-MEM along with 20ng pRL-TK. In a separate tube 1.6µl of Lipofectamine 2000 was diluted in 50µl of OPTI-MEM to achieve 1:2 DNA:Lipofectamine ratio and incubated for 5 minutes in room temperature. Diluted DNA and Lipofectamine solutions were then mixed gently and incubated 30 minutes at room temperature. Meanwhile the growth medium of the cells to be transfected was replaced with 500µl OPTI-MEM serum free medium. The 100µl DNA-Lipofectamine mixture was then added to the cells and mixed by rocking the plate back and forth. After 5 hours of incubation at 37°C in a CO2 incubator, OPTI-MEM was replaced by RPMI1640 and cells were left for incubation for another 19 hours and collected for luciferase analysis.
2.4.6 Luciferase Reporter Assay System
The Dual-Luciferase® Reporter Assay System from Promega (Cat# E1910) was used for these experiments. Upon delivery of the system The Luciferase Assay Substrate (LARII) was reconstituted according to manufacturer’s instructions and divided into 1ml aliquots and stored at -70°C. Before each use, the necessary amount of LARII was thawed at room temperature in a water bath. Passive Lysis Buffer (PLB) and Stop & Glo® Reagent 1X working solutions were prepared just before use from 5X and 50X concentrates respectively, according to the manufacturer’s instructions. The assays for firefly luciferase activity and Renilla luciferase activity were performed sequentially using one well of a 96 well opaque plate and by using The Reporter Microplate Luminometer (Turner Biosystems). After lysing the cells with 100µl PLB the day after the transfection, 10µl from the lysate was used for
22 the measurement. First 50µl of LARII was added and the luminescence was read immediately. Then 50µl Stop & Glo® Reagent was added, mixed by pippeting and Renilla luciferase activity was determined by reading the luminescence immediately again. All the samples were read one by one to avoid any decrease in the luminescence. Luciferase activities were acquired as RLU (relative luciferase unit), corrected by renilla luciferase activity, adjusted to pGL3-Control activity, and expressed in fold of pGL3-Basic activity +/- standard error of the mean.
2.5. Analysis of bidirectional SSX4 promoter activity by flow cytometry and
fluorescent microscopy
2.5.1 Vectors used
pTurboRFP_PRL vector was purchased from Evrogen (#FP235). This is a promoterless vector encoding red fluorescent protein TurboRFP that can be used as an in vivo reporter of gene expression (Figure
2.1).
FIGURE 2.1 Map of pTurboRFP_PRL construct
pHygEGFP vector (Clontech #6014-1) was used as a control that expresses high levels of Green Flourescent Protein(GFP). pHygEGFP expresses a fusion of the hygromycin resistance gene with enhanced green fluorescent protein (EGFP) under control of the strong immediate early promoter of human cytomegalovirus (CMV) (Figure 2.2)