Measuring residential sustainability performance:
an indexing approach
Didem Dizdaroglu
School of Urban Design and Landscape Architecture, Bilkent University,
06800 Ankara, Turkey
Email: [email protected]
Abstract: This research investigates the environmental impacts of urban
development by developing a parcel-level sustainability assessment tool to guide sustainable urban development. The paper introduces a GIS-based model called the ‘micro-level urban-ecosystem sustainability index (MUSIX)’, which has been designed as a policy-making support tool to highlight key environmental issues at a micro-level, concentrating specifically on residential developments. The model has been tested in a comparative study of Angora Evleri (Angora Houses, Turkey) and East Killara (Australia). Despite certain limitations in its implementation, the results of the study demonstrate that a parcel-based spatial analysis can be used as a tool to identify problems in current local policies and to suggest ways to improve their efficiency. As a future research direction, MUSIX could be combined with a new module for the evaluation of alternative development scenarios. By producing accessible, accurate and easily combined parcel-level data, planners, governments and other actors could benefit from the model outputs in many ways during the decision-making process.
Keywords: sustainable development; sustainability assessment; sustainability
indicators; GIS-based spatial analysis.
Reference to this paper should be made as follows: Dizdaroglu, D. (2019)
‘Measuring residential sustainability performance: an indexing approach’, Int. J. Sustainable Development, Vol. 22, Nos. 1/2, pp.1–23.
Biographical notes: Didem Dizdaroglu is an Assistant Professor at the School
of Urban Design and Landscape Architecture, Bilkent University. She received her PhD degree from Queensland University of Technology, Brisbane, Australia. Her research interests include sustainable planning of urban ecosystems, sustainability assessment using geospatial analysis, sustainability indicators, biophilic city and green infrastructure. She teaches the following courses: designing the sustainable city, landscape plants, flora of Turkey and urban design studio.
1 Introduction
Cities are complex human-modified systems that comprise built-up areas and natural environments that interact with one another to sustain life, and there is currently a global search for tools to monitor this interaction. Sustainability assessment (SA) is an umbrella term including a range of methodologies that target the measurement of sustainability at
different spatial levels (local, regional, national, international) and with different temporal focuses (ex-ante, concurrent, ex-post). They generate information in support of policies for the creation of liveable and sustainable biophysical and socio-economic environments. A number of SA categorisation exists in literature (Devuyst et al., 2001; Ness et al., 2007; Singh et al., 2009; Štreimikienė et al., 2009; Mori and Christodoulou, 2012; Gasparatos and Scolobig, 2012; Waas et al., 2014; Berardi, 2015; Pope et al., 2015; Dizdaroglu, 2015). SA, by using the indicator-based approach that is classified as one of the categories, provides information for the making of short-term projections, and, moreover relevant decisions for long-term development prospects. Sustainability indicators are quantifiable attributes that are used in the policy development cycle to direct progress towards the meeting of sustainability goals. They play a considerable role in evaluating the adverse consequences of urban growth and assist in the formulation of sustainable policies and programs. The selection of indicators is important, as they should be related to a specific issue of concern, precisely defined, and easily quantified, achievable, trackable over time and cost effective (Hák et al., 2007; Cornescu and Adam, 2014; Mascarenhas et al., 2015).
In previous studies there has been significant focus on developing indicators to measure sustainable development at international, national and city-wide scales, with little emphasis on the scale of individual households or neighbourhoods. Most currently available initiatives fail to garner reliable and accurate information due to the lack of detailed data, while the unavailability of data during the indicator development process leads to problems of missing data in many indices (e.g., environmental sustainability index, environmental performance index, human development index and European green city index). As a result of the weak participatory approaches to data collection at a micro-level, some countries struggle to provide sufficient information to international organisations, which results in the production of biased and incomplete indicator sets. According to many studies, consideration of the spatial scale is limited in many of the currently used initiatives (Mayer, 2008; Tanguay et al., 2010; Dahl, 2012; Moldan et al., 2012; Fredericks, 2014; Wong, 2015; Somogyi, 2016; Yigitcanlar et al., 2015). Consequently, SA tools based on sustainability indicators need to include a range of indicators that provide information to allow their functioning under the regional and national planning systems, while at the same time contributing effectively to the local development agenda. Detailed data is necessary for the performance of a comprehensive SA that produces results at a more disaggregated level, and then aggregates them to contribute to a better understanding of sustainability issues at a macro-level.
This paper presents a geographic information systems (GIS)-based SA model called micro-level urban-ecosystem sustainability index (MUSIX) that has been developed to evaluate the environmental impacts of urban areas through the use of remote sensing imagery. MUSIX is designed as a policy-making support tool for highlighting key environmental issues at a local level, concentrating specifically on residential developments. MUSIX measures the sustainability performance of a residential area by generating a set of parcel-scale indicators. The spatial data unit for this study is the land parcel defined by WG-CPI (2006, p.1) as “a single area of land, or more particularly, a volume of space, under homogeneous real property rights and unique ownership”. An individual parcel represents the smallest spatial unit for analysis in urban studies. With their finely grained development patterns, parcels are a source of reliable and accurate data for policy and decision-makers. Parcel-level data provide comprehensive land related information that is suitable for us in:
1 detailed analyses of environmental quality
2 improvements to the quality of infrastructure and utilities 3 the management of the efficient use of resources
4 the implementation of efficient land use-policies.
The model is tested in a comparative study of Angora Evleri (Ankara, Turkey) and East Killara (Sydney, Australia) to evaluate the policy actions undertaken by different governmental institutions for sustainable urban development. This paper provides a summary of the results and concludes with a discussion of the limitations and future research directions.
2 Methods and materials 2.1 Study areas
The study areas have been selected based on their comparable: 1 urban morphology
2 land use and dwelling types 3 proximity to the city centre 4 housing age
5 population density (see Figure 1).
Ankara is the capital and the second largest city in Turkey, located in Central Anatolia. The 2015 population of the city was approximately 5,270,575 (TSI, 2016). Angora Evleriis located 15 kilometres west of the city centre of Ankara at the boundary of Çankaya Municipality. The area is bounded by the Kanuni Sultan Suleyman and Saltoglu Boulevards from north-northwest to south, andis surrounded by ongoing residential developments. The Hacettepe University campus borders the site from the northeast to the southeast. It is a gated community that comprises high-rise apartments, terrace houses and villas with a total population of 8,000. In the scope of the study, only the villas (with a total population of 2,500) are included in the implementation of the model. The study area contains two-story detached dwellings that are in good condition, and that predominantly have large rear gardens. The total size of the area is approximately 06 hectares; and thetotal number of parcels is 987(Minimum parcel size: 454 m2 / maximum parcel size: 7,669 m2 / average parcel size: 952 m2). The population density of the area is 23.58 persons/ha. There is an elementary school, a fine arts and sports high school, a shopping centre, two mosques, three small parks and a multi-use park (including a café/restaurant, a playground, an outdoor gym, basketball, tennis courts and a running track) located in the area. Additionally, there is a proposed shopping mall development on a large empty parcel that is surrounded by high-rise apartments. The area is heavily dependent on the use of personal motor vehicles. There is a taxi rank at the main entrance gate and the nearest metro station is approximately 3 kilometres away.
Figure 1 (a) Map of Angora Evleri (b) Map of East Killara (see online version for colours)
(a)
(b) Source: Google Maps (2016a, 2016b)
Sydney is the state capital of New South Wales, located on the east coast of Australia. The 2011 population for Greater Sydney was approximately 4,391,674 (ABS, 2016a). East Killara is located 15 kilometres north of the Sydney Central Business District in the local government area of Ku-ring-gai Council. The area is bounded by Rocky Creek to
the north, Middle Harbour Creek to the east, Gordon Creek to the south, and the Eastern Arterial Road and Birdwood Avenue to the west. Total population of the area is 2,874 (Profile.id.com.au, 2016). The study area contains one- or two-storey detached dwellings that are in good condition, and that predominantly have large rear gardens. The total size of the area is approximately 129 hectares, and the total number of parcels is 987 (minimum parcel size: 488 m2 / maximum parcel size: 5,709 m2 / average parcel size: 1,062 m2). The population density of the area is 22.32 persons/ha. There is a preschool, a high school, a small shopping centre, a church and a multi-use park (including a playground, a cricket pitch, and basketball and tennis courts) located in the area. The area is heavily dependent on the use of personal motor vehicles. There is one bus service in the entire area and the nearest train station is approximately 2 kilometres away.
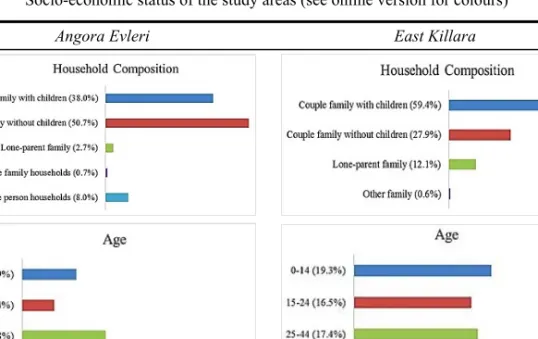
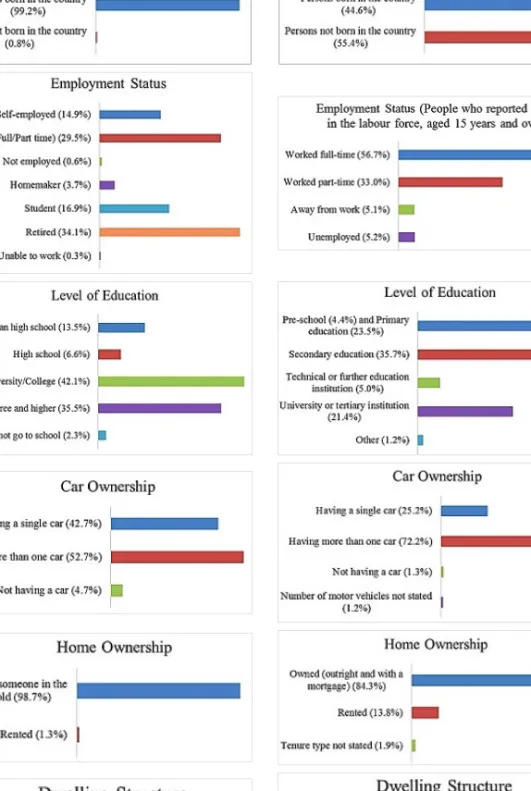
In East Killara, socio-economic indicator data was obtained from the 2011 Census QuickStats (ABS, 2016b). As census data for Angora Evleri is unavailable, socio-economic indicator data was collected using a questionnaire survey of the households in the area (Appendix 1). The administration of Angora Evleri did not allow us to conduct a survey of all dwellings on the site for reasons of privacy. Consequently, sample households were selected by the administration of Angora Evleri who were given questionnaires via the drop-off survey method. The population size of the study area was approximately 2,500 and the total number of respondents was 357. It should be noted that the respondents did not provide information on their household income owing to their reluctance to share such information, and as this information could not be generated from the survey data, the indicator was eliminated from the evaluation. The socio-economic characteristics of the study areas are presented in Table 1.
Table 1 Socio-economic status of the study areas (see online version for colours)
Table 1 Socio-economic status of the study areas (continued) (see online version for colours)
2.2 The methodology of MUSIX
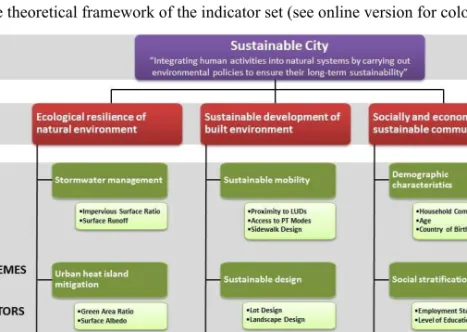
The construction of MUSIX follows the methodological steps defined by Nardo et al. (2008). As the first step, a theoretical framework is necessary to discuss the rationale behind each indicator. As sustainable urban development encompasses three interrelated policy dimensions, the theoretical framework needs to be simple and understandable if the relevant indicators are to be linked to policy questions and are to be useful in decision-making processes. The theoretical framework behind the selection of indicators and their categorisation is based on the concept of ‘sustainable city’. As defined by Hoornweg and Freire (2013), sustainable cities are urban communities that are committed to improving the well-being of current and future residents through the integration of economic, environmental and social systems. Sustainable cities are:
1 socially inclusive in their growth
2 environmentally responsible (i.e., have positive or at least only minimal adverse impacts on the environment)
3 have a sustainable economy
4 based on good urban governance principles.
The inter-linkages among the four pillars of sustainable development are evident in cities, which function as integrated systems (European Investment Bank, 2012). In this sense, a sustainable city has three overarching objectives:
1 ecological resilience of the natural environment 2 sustainable development of the built environment 3 socially and economically sustainable communities.
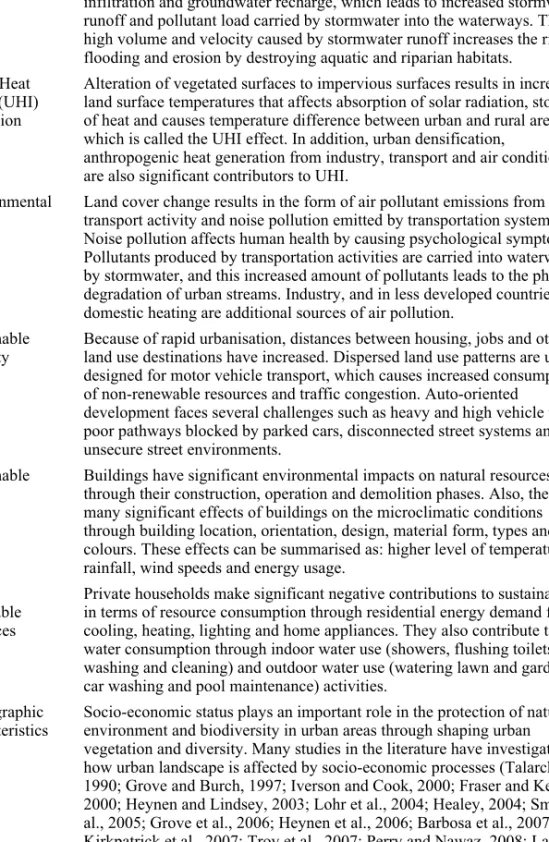
Table 2 Nine key themes and their contribution to sustainability Key themes Their contribution to sustainability Stormwater
management Impervious surfaces play an important role on urban hydrology and stormwater management. Built and paved surfaces impede rainwater infiltration and groundwater recharge, which leads to increased stormwater runoff and pollutant load carried by stormwater into the waterways. The high volume and velocity caused by stormwater runoff increases the risk of flooding and erosion by destroying aquatic and riparian habitats.
Urban Heat Island (UHI) mitigation
Alteration of vegetated surfaces to impervious surfaces results in increased land surface temperatures that affects absorption of solar radiation, storage of heat and causes temperature difference between urban and rural areas which is called the UHI effect. In addition, urban densification,
anthropogenic heat generation from industry, transport and air conditioning are also significant contributors to UHI.
Environmental
quality Land cover change results in the form of air pollutant emissions from transport activity and noise pollution emitted by transportation systems. Noise pollution affects human health by causing psychological symptoms. Pollutants produced by transportation activities are carried into waterways by stormwater, and this increased amount of pollutants leads to the physical degradation of urban streams. Industry, and in less developed countries, domestic heating are additional sources of air pollution.
Sustainable
mobility Because of rapid urbanisation, distances between housing, jobs and other land use destinations have increased. Dispersed land use patterns are usually designed for motor vehicle transport, which causes increased consumption of non-renewable resources and traffic congestion. Auto-oriented
development faces several challenges such as heavy and high vehicle traffic, poor pathways blocked by parked cars, disconnected street systems and unsecure street environments.
Sustainable
design Buildings have significant environmental impacts on natural resources through their construction, operation and demolition phases. Also, there are many significant effects of buildings on the microclimatic conditions through building location, orientation, design, material form, types and colours. These effects can be summarised as: higher level of temperatures, rainfall, wind speeds and energy usage.
Use of renewable resources
Private households make significant negative contributions to sustainability in terms of resource consumption through residential energy demand for cooling, heating, lighting and home appliances. They also contribute to water consumption through indoor water use (showers, flushing toilets, washing and cleaning) and outdoor water use (watering lawn and gardens, car washing and pool maintenance) activities.
Demographic
characteristics Socio-economic status plays an important role in the protection of natural environment and biodiversity in urban areas through shaping urban vegetation and diversity. Many studies in the literature have investigated how urban landscape is affected by socio-economic processes (Talarchek, 1990; Grove and Burch, 1997; Iverson and Cook, 2000; Fraser and Kenney, 2000; Heynen and Lindsey, 2003; Lohr et al., 2004; Healey, 2004; Smith et al., 2005; Grove et al., 2006; Heynen et al., 2006; Barbosa et al., 2007; Kirkpatrick et al., 2007; Troy et al., 2007; Perry and Nawaz, 2008; Landry and Chakraborty, 2009; Larson et al., 2009; Luck et al., 2009; Zhou et al., 2009; Pincetl, 2010; Kendal et al., 2012; Szantoi et al., 2012; Melendez-Ackerman et al., 2014; Warhurst et al., 2014). In Table 3, detailed information is given about these studies and their results.
These constitute a basis for the indicator selection of the model. MUSIX is composed through the aggregation of a set of 20 parcel-level indicators, which are combined into nine key themes under three overarching objectives for the attainment of a sustainable city development, as shown in Figure 2. The model incorporates nine key themes that have significant importance in sustainability, as summarised in Table 2.
The selected indicators are characterised by different measurement units which makes them difficult to compare with each other. Accordingly, a normalisation process is necessary to remove the scale effects of different units. A benchmarking normalisation is applied to convert the original indicator units to a common measurement unit. A normalised value to each indicator is assigned ranging between 0 and 5, based on its level of sustainability:
1 low (0.00–1.00): extremely unsustainable level
2 medium–low (1.01–2.00): unsustainable but not as severely as in the previous level 3 medium (2.01–3.00): a discrete level of sustainability; far from the target
4 medium-high (3.01–4.00): satisfactory level of sustainability, but not meeting the target
5 high (4.01–5.00): the targeted sustainability level.
The benchmark values of each indicator are derived from the environmental policy targets assigned by local governments, regional, national and international authorities, or from the values recommended in scientific literature. It must be mentioned that normalisation is only implemented for the indicators belonging to the natural environment and built environment categories. Due to the qualitative nature of socio-economic indicators, it is not possible to categorise them into different levels of sustainability, and so their contribution to sustainability is assessed through household surveys and available census data which is explained in detail in the next chapter. The calculation method and benchmark values used to evaluate the performance of each indicator are presented in Appendix 2.
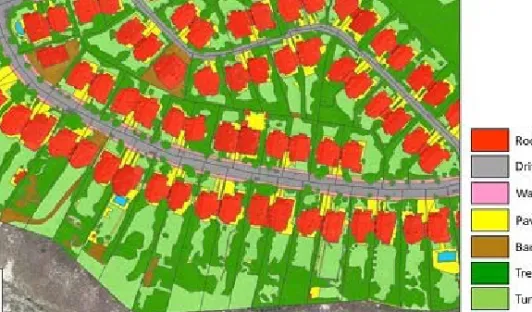
To examine the relationships between indicators both within and between the subsystems, a statistical analysis is applied. The Spearman’s rank correlation coefficient is calculated to investigate the relationship and the results show no high correlations among the indicators (Appendix 3). In the next step, a spatial analysis is carried out to detect land cover changes using up-to-date remote sensing data. The total area of each land cover type within the parcels are measured using the ArcGIS Editor Toolbar (for drawing polygons) and ArcTool Box – analysis tools – overlay - union (for combining the layers). The land cover classification is based on nine main types: roof-building, pavement (e.g., stone, concrete and brick), driveway, cycleway, walkway, tree-shrub, water, turf-grass (i.e., low-lying vegetation) and barren soil. Figure 3 offers an example of land cover classes. As the measurement is conducted through aerial photography, there were some challenges faced during the land cover detection. Alternative solutions are implemented for the success of the study as follows:
the measurement is based on the uppermost surface area that is visible in the aerial photo
as a result of the overlapping problem, trees and shrubs are measured under one category as ‘tree-shrub’
as a result of data resolution, permeable pavers and solar roof titles cannot be detected and different pavement types cannot be differentiated between, and so are measured under one category as ‘pavement’
driveways (shared between adjacent dwellings) are divided into two equal parts and each part is included in the measurement of the parcel area located along the side of the road
as cycle ways and walkways are sometimes difficult to separate, they are measured under one category as ‘walkway’ in shared paths.
Figure 3 Illustration of the land cover classes (see online version for colours)
The weighting procedure defines the importance given to indicators comprising the index or the substitution rates between them. Different weighting methods can be used including: statistical models (e.g., factor analysis, data envelopment analysis), and participatory methods (e.g., budget allocation, analytic hierarchy processes). Furthermore, weights can be determined based on expert opinion familiar with policy priorities and theoretical backgrounds. In this study, all indicators are given equal weights to make the sustainability performances between the two countries comparable. It should be noted that differential weightings permit a more nuanced comparison between jurisdictions with different urban forms or other physical characteristics. Afterwards, indicator scores for each parcel are calculated using Microsoft Office Excel and ArcGIS software, with each parcel is scored using a five-point Likert scale to represent its sustainability performance.
The intention of aggregation is to simplify the interpretation of many indicators in an effective manner by forming a single meaningful composite index. The additive aggregation method is used when all indicators have the same measurement unit. Additive aggregation is the linear summation of the weighted and normalised indicators. The composite index score is calculated based on the following formula:
1 n i i i MUSIX CI w x
where CI is the composite index, w corresponds to the weight of each indicator, x corresponds to the normalised indicator score.
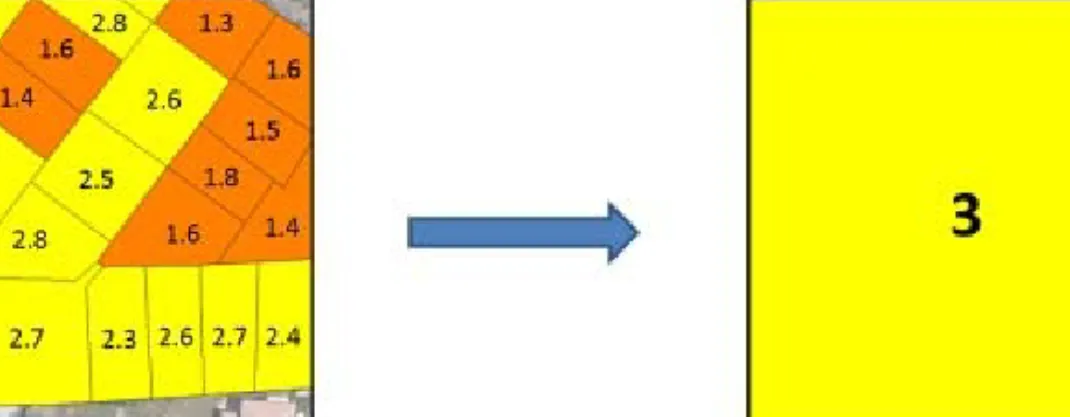
As defined by Rao (2016), spatial aggregation is the process of grouping spatial data at a level of detail or resolution that is coarser than the level at which the data is collected. The aim in the spatial aggregation of parcel-level scores is to assist policy and decision-makers in delivering a ‘big picture’ understanding of the issue of sustainability at neighbourhood/suburb, city/region and supra-national levels. After additive aggregation, the study area is divided into grid cells of 100 × 100 metres. To obtain a better integration of the parcel-level model results with the other scale assessment tools in the planning process, 100 metres is chosen as the grid cell size. ArcGIS software (ArcTool Box – analysis tools – statistics) is used to transfer the parcel-level aggregated composite index scores into grid cell scores. Figure 4 provides an example of the spatial aggregation of a grid cell. As seen from the example, each parcel’s composite index score is multiplied by its percentage area within the grid cell and then summed into a single composite score.
Figure 4 An example of spatial aggregation for a grid cell (see online version for colours)
3 Results and discussion
3.1 Interpretation of MUSIX results
Parcel-level and grid-based scores are illustrated in Appendices 4, 5 and 6. In both study areas, the results show that, as a consequence of fast growing urbanisation, the increased impervious surfaces (average composite score of this indicator for Angora Evleri: 2.25; for East Killara: 2.58), have had significant impacts on site hydrology causing increased surface runoff (Angora Evleri: 2.52; East Killara: 2.82), and such surfaces pose significant threats to the ecology of the area through the clearing of natural vegetation (Angora Evleri: 2.48; East Killara: 3.68). Removing vegetation also contributes to increased land surface temperatures, affecting the absorption of solar radiation and the storage of heat (Angora Evleri: 3.11; East Killara: 2.78). High-density and auto-dependent development createsa distinctive impact on the quality of the
environment, and the results reveal that residents who live close to major roads are exposed to high levels of noise pollution (Angora Evleri: 2.94; East Killara: 2.95). As an important indicator of the air pollution resulting from transport sources, the air quality of Angora Evleriis rated as moderate (PM10 annual average concentrations reported as 52 μg/m3), while the other hand, the air quality of East Killara is rated as good (PM10
annual average concentrations reported as 14 μg/m3). The development patterns create
an environment that limits site accessibility for cyclists and pedestrians (Angora Evleri: 1.65; East Killara: 1.14) and there is only limited accessibility to land-use destinations (LUDs) on foot in both areas (Angora Evleri: 3.26; East Killara: 2.73). While Angora Evleri offers moderate accessibility to public transport (PT) (average composite score: 3.85), East Killara provides good accessibility to PT (average composite score: 4.15). The results indicate that existing parcel layouts in both areas do not meet the principles of passive design in terms of lot shape, building orientation and form, solar shading, and so on (Angora Evleri: 2.16; East Killara: 1.86). Furthermore, the landscape designs of the parcels tend not to meet the principles of climate-responsive design (Angora Evleri: 1.87; East Killara: 1.98). Finally, the use of renewable energy systems is uncommon in both areas (Angora Evleri: 1.10; East Killara: 1.37).
An evaluation of existing policies provides an understanding of what works, what is being done well, and what should be followed, or vice versa. By examining their strengths and weaknesses, local governments and policy-makers can improve the quality of the services they provide. The effectiveness of existing sustainable development policies are discussed in the light of the model findings under the following areas described below.
3.1.1 Stormwater management
Due to the auto-oriented transportation and land use patterns, both study areas are largely covered by impervious surfaces, leading to increased rates of surface runoff. In Turkey, there is no legal framework for surface water rights, and Çankaya Municipality does not implement design strategies or water saving programs to guide stormwater management activities. In East Killara, the Ku-ring-gai Council has adopted the Water Management Development Control Plan, which was developed in accordance with the web-based assessment tool Building Sustainability Index (BASIX), and includes on-site stormwater and wastewater management, stormwater discharge from the site, development over/adjacent to drainage systems and road drainage design. The Council implements many Water Sensitive Urban Design (WSUD) solutions, such as swales and raingardens (bio-filtration systems) for surface runoff management. The Council also applies an annual stormwater management charge to properties that is used to fund such projects, as the construction of new stormwater inlets and grates, retrofitting pipes to improve water capacity and cleaning pollutant traps. There is another water saving program called the Greenstyle Home Sustainability Advice Service which identifies ways of reducing water use around the home, as well as how to design gardens to be more water efficient and drought-tolerant. The results, however, reveal that these strategies and programs are not carried out effectively in the area. In general, both local councils should encourage individual households and community groups to install sustainable stormwater systems through a variety of regulations, or through educational or incentive programs.
3.1.2 Urban heat island mitigation
The percentage of green spaces is low in both areas, with only a few large urban green spaces in existence that are, unfortunately, threatened by development pressure. Increased impervious surfaces have a negative impact on the thermal comfort of the areas, while the native vegetation cover is under threat from increased urbanisation. In response, the Ku-ring-gai Council has prepared the Local Environmental Plan (KLEP 2015),as a statutory planning instrument that controls what can be developed on various parcels of land in the local government area of Ku-ring-gai. This plan also provides protection for trees, heritage conservation areas and environmentally sensitive areas, and there are other programs which aim to support the native wildlife around the homes and the local neighbourhood, such as:
1 converting unused swimming pools into ponds 2 supplying native bee hives
3 encouraging residents to create habitat stepping stones between existing wildlife corridors.
In Turkey, in accordance with the development and regional plans, the Environmental Order Plans specify the settlement and land use decisions at 1:100000, 1:50000, 1:25000, or smaller scales. Specifically, however, Çankaya Municipality does not implement policies, guidelines or programs for environmental protection. The results reveal that the community awareness of environmental issues and the policies to encourage the management of biodiversity and green areas needs to be enhanced in both areas.
3.1.3 Environmental quality
As both study areas are on the periphery of their respective cities, they represent a good picture of air quality. To promote air quality, the New South Wales Government has established two policies: The Protection of the Environment Operations Act 1997 and the Protection of the Environment Operations (Clean Air) Regulation 2010. The Council also provides an online lodgement system for the reporting of noise and air pollution. In Turkey, the Ministry of Environment and Urbanization established the Environment Law (No. 2872) which includes provisions about environmental pollution and its prevention. Additionally, Road Traffic Law (No. 2918) includes a provision indirectly relating to air pollution. The noise pollution level of both areas ranges from 55 to 65 dBA, which is considered moderate. More specifically, the parcels located near major roads have unacceptable noise levels ranging from 65 to 75 dBA. The results indicate that the impacts of noise pollution need to be reduced through dense planting, sound insulation and other techniques. Additionally, transport-related emissions need to be reduced by promoting green transportation.
3.1.4 Sustainable mobility
LUDs are defined as the local services provided for residents to satisfy their needs, such as shopping, financial, health and recreation facilities. In Angora Evleri, the accessibility of LUDs from households (< 800 m walking distance) is slightly better than in East Killara. On the peripheries of both study areas, there is no easy access to LUDs within
walking distance, and the pedestrian facilities are inadequate. In 2012, the Ku-ring-gai Council adopted the Bicycle Plan to encourage more people to cycle, and there are also car-sharing and car-pooling services to reduce the number of vehicles and the demand on parking. However, the study area does not encourage bicycle travel, and so a network of safe, linked pedestrian and cycle paths is needed. Both areas provide favourable access to bus stops, but the frequencies of bus services are limited. PT needs to be encouraged in the areas by providing efficient PT routes and times. In response, the New South Wales Government prepared the Long-Term Transport Master Plan 2021 to reduce car dependency by creating an integrated and sustainable transport system. Similarly, Ankara has an extensive network of roads resulting in higher traffic volumes which increases the safety risk to pedestrians and cyclists. In response, the 2023 Capital Ankara Master Plan, which was prepared by the Ankara Greater City Municipality, presents a set of strategies for sustainable transportation.
3.1.5 Sustainable design
The built environment alters the microclimate through building location, orientation, design, material form, types and colours, and in this context, the planning and design of urban areas appropriate for the climate is required. Climate-responsive design plays an important role in encouraging energy efficiency by creating the optimum conditions for the use of solar design strategies. However, neither area meets the principles of climate-responsive design. The dwellings in both areas are generally of deep-plan layout, have no awnings or pergolas and rarely have balconies or verandas. They are exposed to direct summer sunlight and receive no direct sunlight in winter, which affects thermal comfort while also increasing cooling/heating costs. As a result of high-density development, most of the parcels perform very poorly in terms of landscape design. Both areas consist of narrow parcels with small rear gardens or large parcels with limited vegetation cover. These parcels usually have large amounts of impervious surfaces and swimming pools in their rear gardens. The Ku-ring-gai Council website provides some information about sustainable homes. As a pilot program, the council is offering rebates towards independent reviews of building plans by sustainability assessors. Çankaya Municipality does not implement any specific policies, guidelines or programs that support climate-responsive design; and moreover, the new residential areas in Ankara are planned without consideration of climatic conditions, improving outdoor comfort or reducing energy consumption. This clearly shows that both councils need to put more effort into the sustainable design of the urban environment.
3.1.6 The use of renewable resources
As another important aspect of climate-responsive design, the implementation of renewable energy systems (i.e., solar power systems, roof-mounted wind turbines, rainwater tanks and cool roofs) is uncommon in both areas. Specifically, most of the houses have large swimming pools in their rear gardens resulting in increased water usage in the area. They require water reuse, but lack rainwater tanks. The Ku-ring-gai Council has launched the Smart Units program, which offers rebates to residents in apartment blocks if they improve the environmental performance of the common areas of the apartment building. Çankaya Municipality implements no specific policies, guidelines or programs that encourage the use of renewable energy systems. While conducting the
household survey in Angora Evleri, some homeowners stated that they had considered installing solar panel systems, however the prices are not affordable. They also indicated that they are interested in the design of green roof systems, but again complained about the higher installation costs. It is obvious that both councils need to take action to promote sustainable energy and water initiatives, as these would certainly have a significant impact on the behaviour of residents.
3.2 The impact of socio-economic status on land cover change
As stated by Groffman et al. (2014, p.74), “cities are socioecological systems that are built by and for humans”. Socio-economic status plays an important role in the protection of the natural environment and biodiversity in urban areas. Recent studies in literature have investigated the effects of socio-economic status in shaping urban vegetation and diversity, and have found that the greenness of a neighbourhood is related to many socio-economic factors. Different researchers have generated a variety of theories about which socio-economic factors are associated with tree density and distribution (Table 3). In the light of these studies, the impact of socio-economic status on land cover change is investigated under three main categories in the present study, although some limitations came to light during the study. Socio-economic impacts are difficult to monitor and quantify, as they require more in-depth studies which are expensive and time consuming. As mentioned earlier, the privacy concerns of the administration of Angora Evleri did not allow us to conduct a survey of all dwellings; hence, only a sample of dwellings was included in the survey. As a result of the limited survey and census data, this research did not provide enough information to make a definitive evaluation of some indicators, including ‘country of birth’, ‘level of education’, ‘home ownership’ and ‘dwelling structure’. This emphasises the need for in-depth interviews to include the households of all dwellings to gain detailed information about the socio-economic profile. Moreover, specific questions need to be included to obtain information on the households’ consumption patterns, their experiences of the outdoor environment, the garden activities and other environmental behaviours.
Table 3 The findings from other studies
Household composition
Grove et al. (2006) conducted a study in Baltimore, Maryland, which examined the impacts of household characteristics on the vegetation of urban ecosystems. They found that lifestyle behaviours, such as average family size and percentage of single-family detached homes are important predictors of land cover change.
Troy et al. (2007) found that average household size and marriage rates are positively associated with tree cover. Married households prefer living on the outskirts of the city and occupy more open spaces because of needing more space than single households. Married households with more children tend to plant and maintain more trees or chose to move to a neighbourhood with more trees.
Iverson and Cook (2000) found that residential areas dominated with trees and manicured grass in the greater Chicago metropolitan region are associated with lowest household density. Conversely, increases in impervious surfaces are linked with higher household density. According to the research conducted by Melendez-Ackerman et al. (2014), older residents were associated with yards that have more species, trees, plant stems, and taller vegetation.
Table 3 The findings from other studies (continued) Age
Perry and Nawaz (2008) investigated the impact of demographic statistics on garden paving in an area of Leeds, UK. The results indicate that large number of retired people, who are generally older, prefer paved gardens. Because of mobility problems, they need to park their car very near to the house and, they are unable to walk or cycle to public transport and other services. Lohr et al. (2004) conducted telephone surveys with the residents of the largest metropolitan areas in the continental United States regarding their understanding and appreciation of urban trees. Respondents, who did not consider trees important to the quality of life, were more likely to be young (18 to 21 years old).
Barbosa et al. (2007) measured the public green space accessibility for each household in Sheffield, UK. They found that socially disadvantaged groups and older people (aged between 65 and 84) live nearest to the public green space. In addition, there was less space available for vegetation cover within private gardens than advantaged neighbourhoods.
According to Szantoi et al. (2012), people between 40 and 64 years old reside in areas with high urban forest cover in Miami-Dade County.
Country of birth
Luck et al. (2009) tracked 20 years of socio-economic change and 15 years of vegetation change in 32 residential neighbourhoods in south-eastern Australia. They found immigrants are less familiar with the local environment and land management practices than native residents. Pincetl (2010) examined the process of implementation of a new environmental initiative ‘the Million Trees Los Angeles’ program. Many immigrants residing in the poorer neighbourhoods did not request trees because participation required a signature.
Fraser and Kenney (2000) studied the impact of cultural background and landscape history on the attitudes towards trees in the urban environment. The British community, with their heritage of large naturalised parks, were more interested in mature shade trees. The Chinese community, which has evolved a tradition of abstract ornamental gardens, showed less yard maintenance. The Italian and Portuguese communities, which emulates small-scale agriculture, emphasised fruit trees and vegetable gardens.
In Phoenix, Larson et al. (2009) found that long-term residents of historic neighbourhoods prefer the mesic landscapes while newcomers prefer more xeric landscaping. As the city has a desert climate, existing canals are based on the ancient agricultural irrigation system provided to older neighbourhoods. This cultural legacy influences long-term residents to prefer mesic lawns which they have become accustomed.
Employment status
Talarchek (1990) found that in New Orleans, Louisiana, grassy neighbourhoods are related to the presence of persons employed in skilled blue-collar trades.
Kirkpatrick et al. (2007) investigated the relationship between the presence of trees in front garden and socio-economic variables in the different suburbs of Hobart, Tasmania. They found that unemployment rate was the best predictor of non-gardens (which consist of lawn and/or artificial surfaces with less than 10 plant species, usually hardy survivors from a previous garden).
Table 3 The findings from other studies (continued) Level of education
Luck et al. (2009) and Troy et al. (2007) found a positive relationship between the residents with a university degree and vegetation cover that reflects the level of knowledge of land
management and environmentally sensitive behaviours (for example, tree planting).
Zhou et al (2009) investigated household and neighbourhood socioeconomic characteristics as predictors of residential lawn-care expenditures and lawn greenness. They found percent of college graduates and owner-occupied house are significant predictors.
Kendal et al. (2012) found that in the City of Ballarat, Australia, education level is associated with tree cover. Areas of higher tree cover were associated with a higher proportion of residents with graduate education. The study also found that individuals with lower education levels settled in areas with newer housing developments with lower tree cover.
Heynen and Lindsey (2003) analysed variation in urban forest canopy cover among 60 urban areas in Central Indiana and found that increased canopy cover is associated with higher level of education.
Grove and Burch (1997) found that households living in Baltimore with higher levels of education were more likely to contain areas with trees and grass.
Car ownership
Perry and Nawaz (2008) found a significant increase in the paved surfaces of domestic gardens. One of the reasons to explain this trend is the increased car ownership and difficulty of on street parking. Fear of car crime or robbery whilst walking from the car to the house has also been cited as a reason to use front gardens for parking (Healey, 2004).
Warhurst et al. (2014) investigated the permeability change in domestic front gardens in the city of Southampton, UK by using aerial photographs from 1991, 2004 and 2011. They indicated that there is a big shift from gardens to parking areas which cause a potential increase in flooding frequency and severity.
Home ownership
Melendez-Ackerman et al. (2014) conducted social household surveys to evaluate the association of social-economic and demographic factors with vegetated surfaces. Results revealed that ownership status appeared to be an important influence on vegetation and yard characteristics. The results reflect a greater attachment to property or a greater motivation by home owners to invest in their private gardens.
Luck et al. (2009) found a positive relationship between home ownership and vegetation cover, as home owners have the motivation to invest in property and garden maintenance.
Heynen et al. (2006) investigated the distribution of urban canopy cover within Milwaukee by integrating urban canopy cover data from aerial photography, US Census data and qualitative data collected through in-depth interviews. Results showed that renters often concern other issues regarding their satisfaction with rental property, hereby; they have less direct ability and incentive to invest in the planting and maintenance of trees on rental property.
Landry and Chakraborty (2009) evaluated the spatial distribution of public right-of-way trees in the city of Tampa, Florida. The results indicated that a lower proportion of tree cover on public ROW in neighbourhoods contain a higher proportion of renters.
Table 3 The findings from other studies (continued) Dwelling structure
Perry and Nawaz (2008) found that people in semi-detached houses tend to have retained a large portion of grass in their back garden. This may be due to householder aiming for better
functionality from their front garden. A lawn in front of the house is not a comfortable place for many garden activities (for example, kids playing, reading the papers or sunbathing). By paving the area an extra car parking space is provided increasing the functionality of the area.
Smith et al. (2005) investigated the contribution of private gardens to urban green spaces in residential areas consist of four main dwelling types (apartments, terraced, detached and semi-detached) in Sheffield, UK. They found that the variation in rear garden area was related to housing type. Gardens of terraced houses were significantly smaller than gardens of detached and semi-detached houses.
Troy et al. (2007) found that households dominated by singles (between 25 and 44 years old) live in a rental unit in multi-unit buildings, whereas households dominated by married couples (who are 45 years or older) live in their own single-family detached homes in greener neighbourhoods.
In Angora Evleri, the households are mostly couple families with no children, aged between 45 and64 years and 65 over. The aerial photo of the site shows that the gardens are well-maintained, with shrubs and manicured grass being dominant. The gardens contain small quantities of paved surfaces and the residents are largely involved in urban farming in their rear gardens. The recently planted trees and shrubs reveal a high rate of land clearance for housing development. In East Killara, the households are mostly couple families with children, aged between 45 and 64 and 0–14 years. An aerial photo of the site shows that the gardens are dominated by scattered old-growth trees and neglected grass areas. The rear gardens contain large quantities of paved surfaces with swimming pools or tennis courts. In Angora Evleri, the households are predominantly retired, and there are a large number of middle-aged and older people living in the area who enjoy spending time in their gardens. In East Killara, a significant proportion of the households are in full or part-time working, and so do not have time for gardening activities. Additionally, there is less available space for gardening when compared to Angora Evleri. In both areas, the vast majority of households own more than one car. In East Killara, the residents tend to prefer excessive front yard paving than in Angora Evleri. Furthermore, only a very small proportion of the area is designed with pedestrian footpaths which does not encourage walking, cycling or PT use Angora Evleri has the largest quantity of walkways, although, the area is not comfortable to walk and cycle around. Lastly, in Angora Evleri, a significant proportion of households live in their own homes. The large number of well-maintained gardens in the area reflects a greater motivation by home owners to invest in their private gardens.
4 Conclusions
The data quality plays an important role in the analysis and reporting of indicators. Geographers, environmental scientists, researchers and urban planners face difficulties when using existing data for environmental analyses and planning applications due to the lack of accurate, reliable and timely data at the finer scales. This lack of data at a finer scale, leads to the classifications and methodologies for indicators remaining incomplete. To address this issue, this research established a composite index model called MUSIX
that provides information about the environmental problems in urban areas by generating a set of micro-level indicators. In a comparative study of Angora Evleriand East Killara, MUSIX evaluated their sustainability performance under the six main policy areas – i.e., stormwater management, urban heat island mitigation, environmental quality, sustainable mobility, sustainable design and the use of renewable resources. Additionally, socio-economic analysis provided insights into how the spatial structure of urban areas is shaped by household characteristics. That said, more research is needed on this subject to gain a better understanding of the influence of socio-economic status on land cover change.
This research contributes to the existing knowledge by developing and testing a tool that can assist local government authorities in measuring their performance in terms of sustainable planning and the management of the urban environment. The MUSIX investigates the multidimensional nature of sustainability by providing details of the environmental pressures and their driving forces in highly developed residential areas. Moreover, it has the potential to guide future planning applications by setting the standards for sustainable development. The research results demonstrate that a parcel-based spatial analysis can be used as a tool for revealing the problems of current local policies and suggests ways to improve efficiency. The proposed model can be used by different stakeholders for many purposes. With the assessment and analysis provided, the model highlights the most vulnerable areas where action needs to be taken by decision-makers. The model findings further assist local governments in developing new policies and regulations to improve infrastructure and services. Policy-makers, planners and designers use such information to monitor their progress towards sustainability over time, while non-governmental organisations (NGOs) use this information in campaigns to raise public awareness on environmental issues and sustainable solutions. This information can also be used by the private sector in the design of new sustainable products or technologies. Moreover, the model findings can provide useful insights for academicians and research bodies in their research projects.
This research has some limitations that should be stated. The main limitation was the lack of available data during the indicator selection. At the beginning of the research, a number of indicators were eliminated due to problems with the collection of household-level data and privacy issues. Based on best available information, a number of assumptions were made for the benchmarking and calculation of indicators that are subject to limitations (for more information, see Appendix 2). This research has shown that the available data on environmental problems is not enough. The scale of the available data for the calculation of indicators affects their utility for policy-making. More detailed data is needed at a micro-level to produce information at national and international levels. Another challenge was encountered when mapping the heterogeneity of the urban environment at a parcel-level from aerial photography. Even though high-resolution aerial photographs were provided, the areas of each land cover type were measured manually by using the ArcGIS software. Such a visual examination is extremely time-consuming, laborious, and subjective. As the urban environment has complex and heterogeneous land cover patterns, including buildings and roads lying alongside vegetation and water bodies, the available pixel-based image classification methods are insufficient for the automatic detection of detailed urban land cover at parcel-level. Thus, more research is needed to develop new approaches for the detection of land cover change using remote sensing and GIS techniques.
The MUSIX is currently focused on the SA of residential neighbourhoods, and so is applicable to any city, municipality or local government, although the model also has the potential to be applied to other urban areas. To implement this methodology in different urban areas, the indicator set of the model will need to be customised in relation to the land use, environmental characteristics and data coverage. Despite certain limitations in its implementation, this comparative study demonstrated that micro-level SA tools may provide impetus to local sustainability initiatives at a macro-level; and may improve the coordination of SA between national and international planning authorities. As a future research direction, MUSIX could be combined with a new module for the evaluation of alternative development scenarios. By producing accessible, accurate and easily combined parcel-level data, planners, governments and other actors could benefit from the model outputs in many ways during the decision-making process. For instance, the outputs may provide information for a comparison of proposed development projects or plans, or may assist practitioners in choosing the most appropriate plan for the accomplishment of sustainability targets, while also providing coordination and collaboration between different government bodies.
Acknowledgements
This work was supported by the Scientific and Technical Research Council of Turkey (TUBITAK) 2219-International Post-Doctoral Research Fellowship Program (Grant Number: 1059B191500492).
Appendices/Supplementary materials are available on request by emailing the corresponding author.
References
ABS (2016a) 2011 Census QuickStats. Sydney [online] http://www.censusdata.abs.gov.au/ census_services/getproduct/census/2011/quickstat/1GSYD (accessed 12 March 2016). ABS (2016b) 2011 Census QuickStats. East Killara [online] http://www.censusdata.abs.gov.au/
census_services/getproduct/census/2011/quickstat/SSC10775?opendocument&navpos=220#e mployment (accessed 12 March 2016).
Barbosa, O., Tratalos, J.A., Armsworth, P.R., Davies, R.G., Fuller, R.A., Johnson, P. et al. (2007) ‘Who benefits from access to green space? A case study from Sheffield, UK’, Landscape and Urban Planning, Vol. 83, Nos. 2–3, pp.187–195.
Berardi, U. (2015) ‘Sustainability assessment of buildings, communities and cities’, in Klemeš, J. (Ed.): Assessing and Measuring Environmental Impact and Sustainability, pp.497–545, Elsevier, London.
Cornescu, V. and Adam, R. (2014) ‘Considerations regarding the role of indicators used in the analysis and assessment of sustainable development in the EU’, Procedia Economics and Finance, Vol. 8, pp.10–16.
Dahl, A.L. (2012) ‘Achievements and gaps in indicators for sustainability’, Ecological Indicators, Vol. 17, pp.14–19.
Devuyst, D., Hens, L. and De Lannoy, W. (Eds.) (2001) How Green is the City: Sustainability Assessment and the Management of Urban Environments, Columbia University Press, New York.
Dizdaroglu, D. (2015) ‘Developing micro-level urban ecosystem indicators for sustainability assessment’, Environmental Impact Assessment Review, Vol. 54, pp.119–124.
European Investment Bank (2012) Joint European Support for Sustainable Investment in City Areas [online] http://www.eib.org/attachments/documents/jessica_horizontal_study_smart_ and_sustainable_cities_en.pdf (accessed 1 February 2016).
Fraser, D.G.E. and Kenney, W.A. (2000) ‘Cultural background and landscape history as factors affecting perceptions of the urban forest’, Journal of Arboriculture, Vol. 26, No. 2, pp.106–112.
Fredericks, S.E. (2014) Measuring and Evaluating Sustainability: Ethics in Sustainability Indexes, Routledge, New York.
Gasparatos, A. and Scolobig, A. (2012) ‘Choosing the most appropriate sustainability assessment tool’, Ecological Economics, Vol. 80, pp.1–7.
Google Maps (2016a) Angora Evleri, Ankara, Street map [online] https://www.google.com.au/ maps/@39.8766657,32.7137704,15.79z?hl=en (accessed 12 March 2016).
Google Maps (2016b) East Killara, Sydney, Street map [online] https://www.google.com.au/ maps/place/East+Killara+NSW/data=!4m2!3m1!1s0x6b12a855ceecae77:0x5017d681632b580 ?sa=X&ved=0ahUKEwj8kN7ou_TLAhWHk5QKHeooDVsQ8gEIdjAK (accessed 12 March 2016).
Groffman, P.M., Cavender-Bares, J., Bettez, N. et al. (2014) ‘Ecological homogenization of urban USA’, Frontiers in Ecology and the Environment, Vol. 12, No. 1, pp.74–81.
Grove, J.M. and Burch Jr., W.R. (1997) ‘A social ecology approach and applications of urban ecosystem and landscape analyses: a case study of Baltimore, Maryland’, Urban Ecosystems, Vol. 1, No. 4, pp.259–275.
Grove, J.M., Troy, A.R., O’Neil-Dunne, J.P.M., Burch Jr., W.R., Cadenasso, M.L. and Pickett, S.T.A. (2006) ‘Characterization of households and its implications for the vegetation of urban ecosystems’, Ecosystems, Vol. 9, pp.578–597.
Hák, T., Moldan, B. and Dahl, A.L. (Eds.) (2007) Sustainability Indicators: A Scientific Assessment, Island Press, Washington, DC, USA.
Healey, P. (2004) Hard Surfacing of Front Gardens: Report on Desk Research for the Borough of Ealing, Pene Healey Associates, Middlesex.
Heynen, N.C. and Lindsey, G. (2003) ‘Correlates of urban forest canopy cover implications for local public works’, Public Works Management & Policy, Vol. 8, No. 1, pp.33–47.
Heynen, N.C., Perkins, H.A. and Roy, P. (2006) ‘The political ecology of uneven urban green space the impact of political economy on race and ethnicity in producing environmental inequality in Milwaukee’, Urban Affairs Review, Vol. 42, No. 1, pp.3–25.
Hoornweg, D. and Freire, M. (2013) Building Sustainability in an Urbanizing World: A Data Compendium for the World’s 100 Largest Urban Areas, World Bank, Washington, DC [online] https://openknowledge.worldbank.org/handle/10986/18666 (accessed 19 March 2016).
Iverson, L.R. and Cook, E.A. (2000) ‘Urban forest cover of the Chicago region and its relation to household density and income’, Urban Ecosystems, Vol. 4, No. 2, pp.105–124.
Kendal, D., Williams, N.S.G. and Williams, K.J.H. (2012) ‘Drivers of diversity and tree cover in gardens, parks and streetscapes in an Australian city’, Urban Forestry & Urban Greening, Vol. 11, No. 3, pp.257–265.
Kirkpatrick J.B., Daniels, G. and Zagorski, T. (2007) ‘Explaining variation in front gardens between suburbs of Hobart, Tasmania, Australia’, Landscape and Urban Planning, Vol. 79, Nos. 3–4, pp.314–322.
Landry, S.M. and Chakraborty, J. (2009) ‘Street trees and equity: evaluating the spatial distribution of an urban amenity’, Environment and planning A, Vol. 41, No. 11, pp.2651–2670.
Larson, K.L., Casagrande, D., Harlan, S. and Yabiku, S. (2009) ‘Residents’ yard choices and rationales in a desert city: Social priorities, ecological impacts, and decision tradeoffs’, Environmental Management, Vol. 44, No. 5, pp.921–937.
Lohr, V., Pearson-Mims, C., Tarnai, J. and Dillman, D. (2004) ‘How urban residents rate and rank the benefits and problems associated with trees in cities’, Journal of Arboriculture, Vol. 30, No. 1, pp.28–35.
Luck, G.W., Smallbone, L.T. and O’Brien, R. (2009) ‘Socioeconomics and vegetation change in urban ecosystems: patterns in space and time’, Ecosystems, Vol. 12, pp.604–620.
Mascarenhas, A., Nunes, L.M. and Ramos, T.B. (2015) ‘Selection of sustainability indicators for planning: Combining stakeholders’ participation and data reduction techniques’, Journal of Cleaner Production, Vol. 92, pp.295–307.
Mayer, A.L. (2008) ‘Strengths and weaknesses of common sustainability indices for multidimensional systems’, Environment International, Vol. 34, No. 2, pp.277–291.
Melendez-Ackerman, E.J., Santiago-Bartolomei, R., Vila-Ruiz, C.P., Santiago, L.E., García-Montiel, D., Verdejo-Ortiz, J.C., Manrique-Hernández, H. and Hernández-Calo, E. (2014) ‘Socioeconomic drivers of yard sustainable practices in a tropical city’, Ecology and Society, Vol. 19, No. 3, p.20.
Moldan, B., Janoušková, S. and Hák, T. (2012) ‘How to understand and measure environmental sustainability: indicators and targets’, Ecological Indicators, Vol. 17, pp.4–13.
Mori, K. and Christodoulou, A. (2012) ‘Review of Sustainability Indices and Indicators: towards a new city sustainability index (CSI) ’, Environmental Impact Assessment Review, Vol. 32, No. 1, pp.94–106.
Nardo, M., Paisana, M., Saltelli, A., Tarantola, S., Hoffman, A. and Giovannini, E. (2008) Handbook on Constructing Composite Indicators, OECD, Paris.
Ness, B., Urbel-Piirsalu, E., Anderberg, S. and Olsson, L. (2007) ‘Categorising tools for assessing sustainability’, Ecological Economics, Vol. 60, No. 3, pp.498–508.
Perry, T. and Nawaz, N.R. (2008) ‘An investigation into the extent and impacts of hard-surfacing of domestic gardens in an area of Leeds, United Kingdom’, Landscape and Urban Planning, Vol. 86, pp.1–13.
Pincetl, S. (2010) ‘Implementing municipal tree planting: Los Angeles million-tree initiative’, Environmental Management, Vol. 45, No. 2, pp.227–238.
Pope, J., Bond, A. and Morrison-Saunders, A. (2015) ‘A conceptual framework for sustainability assessment’, in Morrison-Saunders, A., Pope, J. and Bond, A. (Ed.): Handbook of Sustainability Assessment, pp.20–42, Northampton, UK, Edward Elgar.
Profile.id.com.au (2016) East Killara Community Profile [online] http://profile.id.com.au/ku-ring-gai/about?WebID=100 (accessed 17 June 2016).
Rao, A.S. (2016) What Do You Mean by GIS Aggregation? Geography Knowledge Hub [online] http://www.publishyourarticles.org/knowledge-hub/geography/what-do-you-mean-by-gis-aggregation.html (accessed 10 February 2016).
Singh, R.K., Murty, H.R., Gupta, S.K. and Dikshit, A.K. (2009) ‘An overview of sustainability assessment methodologies’, Ecological Indicators, Vol. 9, No. 1, pp.189–212.
Smith, R.M., Gaston, K.J., Warren, P.H. and Thompson, K. (2005) ‘Urban domestic gardens (V): relationships between landcover composition, housing and landscape’, Landscape Ecology, Vol. 20, pp.235–253.
Somogyi, Z. (2016) ‘A framework for quantifying environmental sustainability’, Ecological Indicators, Vol. 61, pp.338–345.
Štreimikienė, D., Girdzijauskas, S. and Stoškus, L. (2009) ‘Sustainability assessment methods and their application to harmonization of policies and sustainability monitoring’, Environmental Research, Engineering and Management, Vol. 2, No. 48, pp.51–62.
Szantoi, Z., Escobedo, F., Wagner, J., Rodriguez, J.M. and Smith, S. (2012) ‘Socioeconomic factors and urban tree cover policies in a subtropical urban forest’, GI Science & Remote Sensing, Vol. 49, No. 3, pp.428–449.
Talarchek, G.M. (1990) ‘The urban forest of New Orleans: an exploratory analysis of relationships’, Urban Geography, Vol. 11, No. 1, pp.65–86.
Tanguay, G.A., Rajaonson, J., Lefebvre, J.F. and Lanoie, P. (2010) ‘Measuring the sustainability of cities: an analysis of the use of local indicators’, Ecological Indicators, Vol. 10, No. 2, pp.407–418.
Troy, A.R., Grove, J.M., O’Neil-Dunne, J.P., Pickett, S.T. and Cadenasso, M.L. (2007) ‘Predicting opportunities for greening and patterns of vegetation on private urban lands’, Environmental Management, Vol. 40, No. 3, pp.394–412.
TSI (2016) Turkish Statistical Institution [online] http://www.turkstat.gov.tr/ (accessed 28 March 2016).
Waas, T., Hugé, J., Block, T., Wright, T., Benitez-Capistros, F. and Verbruggen, A. (2014) ‘Sustainability assessment and indicators: tools in a decision-making strategy for sustainable development’, Sustainability, Vol. 6, No. 9, pp.5512–5534.
Warhurst, J.R., Parks, K. E., McCulloch, L. and Hudson, M. D. (2014) ‘Front gardens to car parks: Changes in garden permeability and effects on flood regulation’, Science of the Total Environment, Vols. 485–486, pp.329–339.
WG-CPI (2006) Role of the Cadastral Parcel in INSPIRE and National SDIs with Impacts on Cadastre and Land Registry Operations, Joint Working Group of EuroGeographics and the PCC (WG-CPI), Inventory document.
Wong, C. (2015) ‘A framework for ‘city prosperity index’: linking indicators, analysis and policy’, Habitat International, Vol. 45, pp.3–9.
Yigitcanlar, T., Dur, F. and Dizdaroglu, D. (2015) ‘Towards prosperous sustainable cities: a multiscalar urban sustainability assessment approach’, Habitat International, Vol. 45, No. 1, pp.36–46.
Zhou, W., Troy, A.R., Grove, J.M. and Jenkins, J.C. (2009) ‘Can money buy green? demographic and socioeconomic predictors of lawn-care expenditures and lawn greenness in urban residential areas’, Society & Natural Resources: An International Journal, Vol. 22, No. 8, pp.744–760.
1. Dwelling Structure
□ Single-detached house □ Semi-detached house □ Row house
2. Home Ownership
□ Owned by someone in the household □ Rented
3. Car Ownership
□ Having a single car □ Having more than one car □ Not having a car
4. Household Composition
Total number of household members: ………. □ One family household
□ Couple family with children □ Couple family with no children □ Lone-parent family □ Female lone-parent □ Male lone-parent □ Two or more family households □ Non-family households □ One-person household □ Two-person households □ Three or more-person households Member No Age Immigration status Employment Status
Income Level Education Level
1> 0-14 2> 15-24 3> 25-44 4> 45-64 5> 65+
1> Not born in the country
2> Arriving in the country in the last 10 years 1> Self-employed 2> Employed (Full time/Part time) 3> Not employed 4> Homemaker 5> Student 6> Retired 7> Unable to work Please write the exact amount of monthly income (YTL)
1> Less than high school
2> High school 3> University/College 4> Master’s degree and higher
parcel area, as shown below:
Where: 𝑰𝑨𝒕𝒐𝒕𝒂𝒍 is the total impervious area within parcel, 𝑨𝑻𝒐𝒕𝒂𝒍 𝒂𝒓𝒆𝒂 is the total parcel area.
Benchmark values are assigned as shown below.
Limitation: In their study, the U.S. Environmental Protection Agency calculated evapotranspiration rates under four categories: natural ground cover, 10-20% impervious surface, 35-50% impervious surface and 75-100% impervious surface. However, impervious surface ratios are not contiguous. Five reference levels are assigned by taking the arithmetic mean of these evapotranspiration rates and impervious surface ratios. *For the accurate measurement of the evapotranspiration rate, climate classification (including the season and time of day), vegetation species, soil type, field capacity and saturation level needs also to be considered.
Where: 𝑪𝒊𝒏𝒅𝒊𝒗𝒊𝒅𝒖𝒂𝒍 𝒂𝒓𝒆𝒂 is the runoff coefficient of each surface type, 𝑨𝒊𝒏𝒅𝒊𝒗𝒊𝒅𝒖𝒂𝒍 𝒂𝒓𝒆𝒂 is the area of each surface type within parcel, and 𝑨𝒕𝒐𝒕𝒂𝒍 𝒂𝒓𝒆𝒂 is the total parcel area.
Indicator 3 Green Area Ratio Unit: %
Calculation Benchmark Scores
The green area ratio is based on the calculation of the crown area of existing trees and shrubs, green roofs and low-lying vegetation. Green area ratio* for each parcel is calculated by dividing the total green area in a parcel by the total parcel area, as shown below:
Where: 𝑮𝑨𝑻𝒐𝒕𝒂𝒍 𝒂𝒓𝒆𝒂 is the total green area within parcel, 𝑨𝒕𝒐𝒕𝒂𝒍 𝒂𝒓𝒆𝒂 is the total parcel area.
Benchmark values derived from Japanese green rating tool CASBEE (2007) are assigned as shown below.
Limitation: Vertical gardens (which cannot be detected by the model) need also to be considered in terms of their contribution towards sustainability.
Where: 𝑨𝒊 is the area of each surface type within parcel, ∝𝒊 is the albedo value of each surface type.
The albedo values for each surface type are:
Limitation: Vertical surfaces (which cannot be detected by the model) need also to be considered in terms of their effects on outdoor microclimate.
Indicator 5 Air Pollution Unit: μg/m³
Calculation Benchmark Scores
World Health Organization (WHO) and other international studies suggest that PM10 (particulate matter 10 micrometres or less in diameter) is an important indicator of the air pollution resulted from transport sources. This indicator is calculated based on PM10 annual average concentrations in the air.
Benchmark values derived from the U.S. Environmental Protection Agency (2009) Air Quality Guide for Particle Pollution as shown below.