GLOBAL FINANCIAL CRISIS AND RISK PERCEPTION
A Master’s Thesis
by TANDOĞAN POLAT The Department of Economıcsİhsan Doğramacı Bilkent Unıversıty Ankara
GLOBAL FINANCIAL CRISIS AND RISK PERCEPTION
Graduate School of Economics and Social Sciences of
İhsan Doğramacı Bilkent University
by
TANDOĞAN POLAT
In Partial Fulfilment of the Requirements for the Degree of MASTER OF ARTS
in
THE DEPARTMENT OF ECONOMICS İHSAN DOĞRAMACI BİLKENT UNIVERSITY
ANKARA September 2012
I certify that I have read this thesis and have found that it is fully adequate, in scope and in quality, as a thesis for the degree of Master of Arts in Economics.
--- Asst. Prof. Selin Sayek Böke Supervisor
I certify that I have read this thesis and have found that it is fully adequate, in scope and in quality, as a thesis for the degree of Master of Arts in Economics.
--- Asst. Prof. Fatma Taşkın Examining Committee Member
I certify that I have read this thesis and have found that it is fully adequate, in scope and in quality, as a thesis for the degree of Master of Arts in Economics.
---
Assoc. Prof. Bedri Kamil Onur Taş Examining Committee Member
Approval of the Graduate School of Economics and Social Sciences
--- Prof. Erdal Erel Director
iii
ABSTRACT
GLOBAL FINANCIAL CRISIS AND RISK PERCEPTION Polat, Tandoğan
M.A., Department of Economics Supervisor: Asst.Prof. Selin Sayek Böke Co- Supervisor: Asst.Prof. Fatma Taşkın
September 2012
The global financial crisis has caused remarkable deterioration in risk appetite and loss of confidence in financial markets. The countries, which succeeded a recovery in their macroeconomic structure, have been relatively less prone to the adverse effects of the crisis. The studies conducted on the impact of global crisis on economic indicators affecting the risk premiums of developing economies have been very limited. The focus of this thesis was on the revealing the change in market risk perceptions towards developing economies within the framework of a rolling base panel data analysis. The five-year Credit Default Swap (CDS) premium has been used as an indicator of country risk premium. According to the results of the panel analysis, in the pre-crisis period risk premiums are more heavily affected from the global developments as compared to domestic indicators, whereas investors have been giving more emphasis on domestic indicators in their risk perceptions with the burst of financial crisis.
Keywords: Credit Default Swap Premiums, Emerging Countries, Global Financial Crisis, Panel Data Analysis, Rolling Base Analysis
iv
ÖZET
KÜRESEL FİNANSAL KRİZ VE RİSK ALGILAMALARI Polat, Tandoğan
Master, Ekonomi Bölümü
Tez Yöneticisi: Doç. Dr. Selin Sayek Böke Ortak Tez Yöneticisi: Doç.Dr. Fatma Taşkın
Eylül 2012
Küresel finans krizi risk alma iştahında ciddi bir gerilemeye ve finansal piyasalarda güven kaybına sebebiyet vermiştir. Makroekonomik göstergelerinde toparlanma başarısı göstermiş ekonomiler, krizin olumsuz etkilerine karşı nispeten daha az maruz kalmıştır. Global krizlerin ülkelerin risk primlerini etkileyen faktörler üzerindeki etkisini inceleyen çalışmalar oldukça sınırlı sayıdadır. Bu tez çalışmanın temel amacı, kaydırmalı panel veri analizi çerçevesinde küresel kriz ile birlikte gelişen ekonomilere yönelik risk algılamalarındaki değişimi ortaya koymaktır. Ekonomi yazınından farklı olarak, ülke risk priminin göstergesi niteliğinde 5 yıllık Kredi İflas Takası primi kullanılmıştır. Panel veri analizi sonucunda küresel kriz öncesi dönemde ülke risk primlerinin yurtiçi göstergelere nazaran global gelişmelerden daha fazla etkilendiği ve küresel krizin başlaması ile birlikte yatırımcıların risk algılamalarında yurtiçi göstergelere daha fazla önem verdiğini anlaşılmıştır.
Anahtar Kelimeler: Kredi İflas Takası Primi, Gelişmekte Olan Ülkeler, Küresel Finansal Kriz, Panel Veri Analizi, Kaydırmalı Veri Analizi
v
TABLE OF CONTENTS
ABSTRACT ... iii ÖZET... iv TABLE OF CONTENTS ... v LIST OF TABLES ... viLIST OF FIGURES ... vii
CHAPTER 1: INTRODUCTION ... 1
CHAPTER 2: GLOBAL FINANCIAL CRISIS AND RISK PERCEPTION ... 4
2.1. Emerging Market CDS Premiums Since 2003... 4
2.2. Literature Review ... 7
2.3. Methodology ... …..16
2.4. Model and Data ... 19
2.5. Estimations and Results ... .23
2.5.1. 2003 Q1- 2011 Q1 ... 25
2.5.2. Rolling Base Analysis ... 29
CHAPTER 3: CONCLUSIONS ... 39
BIBLIOGRAPHY ... 43
vi
LIST OF TABLES
Table 2.1. Credit Default Swap Contract ... 4
Table 2.2. Literature Review Summary ... 15
Table 2.3. Model Variables and Sources ... 23
vii
LIST OF FIGURES
Graph 2.1. Emerging Economies CDS Spreads ... 5 Graph 2.2. Emerging Economies Macroeconomic Indicators ... 6 Graph 2.3. Rolling Coefficients - Economic Structure and Performance Indicators .... 32 Graph 2.4. Rolling Coefficients - Global Indicators ... 34 Graph 2.5. Rolling Coefficients - Liquidty Variables ... 36 Graph 2.6. Rolling Coefficients - Solvency Variables ... 38
1
CHAPTER 1
INTRODUCTION
Since the last quarter of 2008, global financial crisis and its impacts on world economies have been very fast and devastating. Deterioration in risk appetite and loss of confidence in financial markets has prevented the healthy functioning of the credit mechanism. As a result, the real sector’ borrowing and credit facilities have disappeared due to the significant increases in credit costs. With the impact of the crises, the growth rates of the world economies declined sharply, industrial production indices significantly narrowed to a level never seen since the World War II, unemployment rates increased rapidly, households and the real sector confidence index declined to historic low levels.
The major factors leading world economies to financial turmoil can be gathered under three headings (Yılmaz, 2010). In pre-crisis period, while high saving rates are seen in the Far East and in oil producing countries, many developed countries particularly the US show a tendency to over-consumption. The most interesting reflection of the macro imbalances is that relatively rich countries' consumption expenditures are financed by the relatively poor countries. The second
2
element causing global crisis is unprecedented level of global liquidity in global financial markets. The emergence of a wide variety of products in financial markets and the increase in the leverage ratios of financial institutions play crucial role on the rapid increase of liquidity in financial markets. Beyond the control of central banks, rapidly expanding supply of global liquidity with interest rates' remaining at low levels caused the formation of asset bubbles and an excessive blowup in household indebtedness.
Development of financial markets at an incredible pace and the institutions’, responsible for inspection and supervision, not being able to keep up with the pace of the deepening of financial markets can be categorized as the third reason of the global crisis. Inadequate supervision and oversight of financial markets activities entail to an uncontrolled increase in global liquidity, rise in indebtedness ratios and systemic risks at the markets.
Determination of the economic indicators that affect the risk premiums of developing economies is among the most frequently discussed issues in the literature. However, the studies conducted on the impact of global crisis on factors determining risk premiums have been very limited. Identification of the factors affecting the risk premiums of developing countries needs attention from different perspectives. Firstly, in terms of country governance determining the factors which are effective on the risk premiums is crucial for the effectiveness of the policies that will be applied. In the case of risk premiums more affected by global factors, the policy space which may be used by policy-makers to reduce the risk premium is limited. Secondly, in the last decade, there has been a rapid increase in international capital investments and the developing country bonds have become an important investment
3
tool. In this context, the developments in the t-bills and bonds issued by emerging economies have begun to be carefully monitored especially by investors. Capital owners determine their investment preferences by taking into account the difference between the risk premiums implied by the domestic and global indicators and risk perceptions in the market.
The focus of this thesis will be on the determination of the factors affecting risk premiums of developing countries and within the framework of a rolling base analysis this study aims at revealing the change in market risk perceptions towards developing economies, whether these factors show variability in pre and after the recent financial crisis. Accordingly, the panel data analysis have been carried out and the five-year Credit Default Swap (CDS) premium has been used as an indicator of country risk premium. The panel study at first was held for the entire sample period of 33 quarters covering Q1 2003-2011 Q1. Then, panel data analyses were repeated to examine the risk perception change in the financial market towards emerging countries on a rolling 16 and 20 quarter basis from the beginning of 2003 Q1.
The sections in the thesis are listed as follows; In the second part, the operation of the CDS contracts, the development in the emerging markets CDS premiums since the beginning of 2003 are discussed, the previous articles, which are related to the factors affecting the country risk premiums, are examined and also the panel data analysis methods and tests are emphasized. The panel data analysis performed for developing country risk premiums can also be found later in this chapter. In the third, as the last section, evaluation of the findings will be given.
4
CHAPTER 2
IMPACT OF GLOBAL FINANCIAL CRISIS ON RISK
PERCEPTION
2.1. Emerging Market CDS Premiums Since 2003
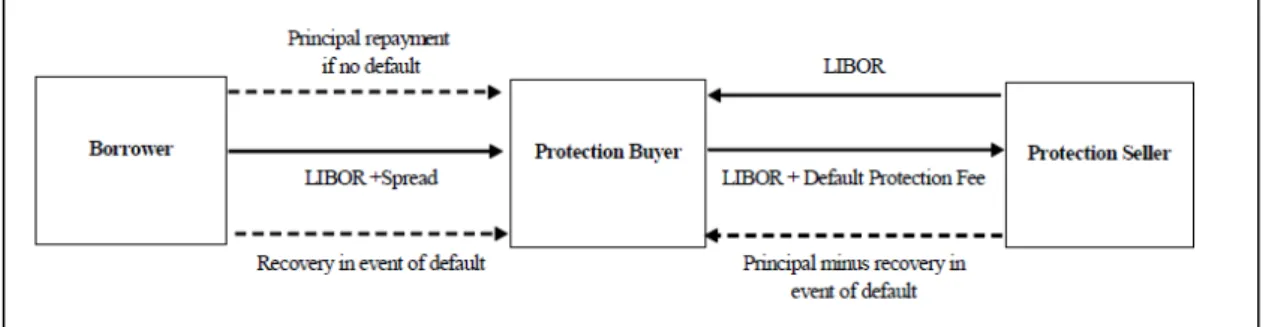
CDS contract is one of the widely used and important credit derivative products in recent years. CDS contracts, without the need for transferring the bond or another asset having credit risk, enable investors to reduce their credit risk by transferring it from one party to the other. CDS is a double-sided contract expressing insurance in exchange for a certain premium for the investor who is exposed to a credit risk. In this contract, the contractor who purchased the protection is the one subjected to credit risk and pays a premium periodically in return to the selling party for this protection, thus, by doing so, ensures the risk against a possible credit event. The credit event is the not fulfillment of the principal and interest payments by the borrower to lender (Table 2.1.).
5
Table 2.1. Credit Default Swap Contract (Chan-Lau, Kim 2004)
During the period covering 2003-2011, the fluctuations arising from developed countries, particularly market swings in US, seriously influenced the emerging economies. As understood from the Graph 2.1, developing economies CDS premiums displayed an overall downward trend between the years 2003-2007; in the period covering the months of April-May of 2004 and May-June of 2006 short-term increases in the country risk premiums were experienced. In the period covering the month of April and May of 2004, the markets of the developing countries were negatively affected by the uncertainties resulting from whether the FED would sustain the lower interest rate or not. In May and June of 2006, the inflation rates increased on a global scale due to the supply shock and as a result of this, central banks increased interest rates; all these gave way to significant increase in the risk premiums. It is seen that the country risk premiums increased significantly due to the global crisis erupted from the U.S. sub-prime mortgage sector since the second half of 2007. As a result of this, after the measures taken on the global scale, the CDS premiums of developing countries declined.
6
Graph 2.1. Emerging Economies CDS Spreads (Sample Average)
It is estimated that the decline in the countries risk premiums in the period of 2003 Q1 and 2007 Q2 has resulted from two main developments. The first one was the increase in liquidity on a global scale experienced in the period after 2001, and as a result the increase in global risk taking appetite. Another reason for the decline was the improvement in macroeconomic indicators of emerging countries. The significant improvements in the macroeconomic structures of developing countries were observed in the post-2002 period. During so called period, the main risk factor for many developing countries such as the budget deficit, current account deficit, external debt and total debt stock to GDP ratios, public and public sector foreign currency debt ratio narrowed significantly and such economies experienced significant improvements in the ratio of international reserves to GDP. Chart 2.2 depicts the main developments in domestic indicators of the developing countries after 2003. 40 80 120 160 200 240 280 320 360 400 440 2003 2004 2005 2006 2007 2008 2009 2010 2011
7
Graph 2.2. Emerging Economies Macroeconomic Indicators (average of 16 countries)
The contraction in the countries risk premiums observed in the post-crisis periods can be described from two viewpoints. Firstly, it is stated that after the fluctuation periods, the policy makers in developing countries gave greater consideration to improve the structure of macro economy and as a result of this, country risk premiums narrowed. It is suggested in the second view that in the post-crisis periods, the assets of developing economies decline to very low levels as compare to safe haven assets and with the help of increased international liquidity the demand for these assets increases therefore there occurs a decline in risk perceptions towards emerging economies. That determining which of these explanations is valid is important for governments of developing economies and facilitates making a choice of policy instruments for policy makers. Another important issue is that whether the factors giving way to an increase in country risk premiums are different or not during the periods of volatility and contraction of global liquidity conditions. Besides determining the factors affecting the risk premiums for a single time period, it is also important to investigate these during and after global fluctuations to set significant findings. -2 -1 0 1 2 3 4 5 03 04 05 06 07 08 09 10
Budget Def icit to GDP
-3.0 -2.5 -2.0 -1.5 -1.0 -0.5 03 04 05 06 07 08 09 10
Current Accunt Def icit to GDP
2 3 4 5 6 7 8 9 03 04 05 06 07 08 09 10
Inf lation Rate
34 36 38 40 42 44 46 48 03 04 05 06 07 08 09 10 External Debt to GDP 32 36 40 44 48 03 04 05 06 07 08 09 10 Public Debt to GDP 20 24 28 32 36 40 03 04 05 06 07 08 09 10
Public FX Debt Ratio
16 18 20 22 24 26 03 04 05 06 07 08 09 10 International Reserv es to GDP 16 18 20 22 24 26 03 04 05 06 07 08 09 10
8
2.2. Literature Review
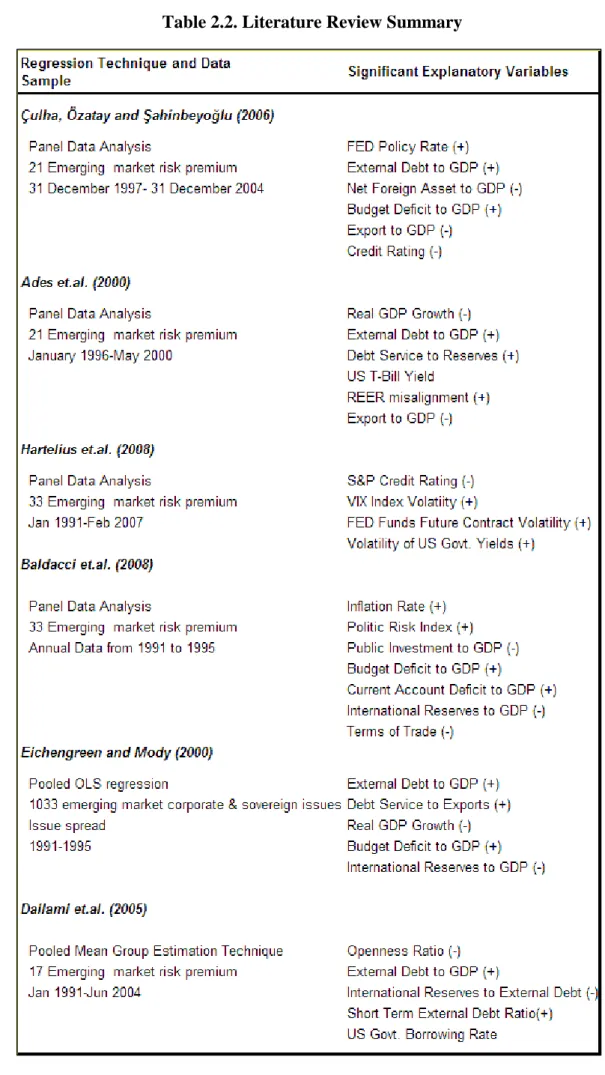
A comprehensive review of literature was conducted based on the factors that affect risk premiums of developing countries and the articles facilitated the panel data models were examined. In the large part of the studies, the difference between the country foreign currency bond yields and risk-free bond yields with the same maturity were used as an indicator of the risk premium. The studies reviewed, the analysis techniques used in the articles, data range, and the significant variables of models were summarized in Table 2.2.
Culha et al., in their panel data study, examined the degree of significance of domestic macroeconomic indicators, the recent developments in global financial markets and macroeconomic data of the U.S. economy in explanation of the country risk premium. 21 developing countries were included in the panel data analysis and as for the sample period, the time between 31 December 1997 and 31 December 2004 was considered. The EMBI yield spreads issued by JP Morgan were used as the indicator of countries borrowing rate differentials, the FED short term policy rate which was considered as a benchmark for the global financial developments and an indicator of risk taking appetite, and S&P long term credit rates reflecting the status of the macroeconomic structure were included in the model. In the panel data analysis by using daily data, the authors concluded that the global factors and the macroeconomic structure significantly affected the risk premium of the developing countries.
Culha et al. repeated the analysis by using monthly data to test the robustness of the results obtained through daily data and took the sample period between January 1998 and December 2004 in their monthly analysis. At the same
9
time, in order to explain yield differences, the domestic macroeconomic indicators such as the total public debt, the budget balance, total exports and net foreign assets to GDP ratios were added as explanatory variables to monthly data analysis. Just like the case in the daily frequency, monthly study also revealed that FED policy rate and credit ratings significantly influenced the countries yield spreads, and subsequently total public debt, budget balance, exports and net foreign assets to GDP ratios added to the model were turned out to be significant explanatory variables. As opposed to Cantor and Packer's claims in 1996, including country-specific macroeconomic variables besides credit rating did not made these additional variables statistically insignificant.
In order to detect the right prices of the developing countries' bonds and arbitrage opportunities on country risk premiums, Ades et al developed a model and in that, monthly borrowing rate differentials of 15 developing counties were investigated within the sample period of January 1996 and May 2000. Instead of EMBI+ return differences, often preferred in other studies, as for each country international bond with the maturity of which was between 10-20 years was utilized. The monthly averages of the variables were used in the model, and the non-monthly series were converted to monthly series by econometric methods. The "pooled mean group" (PMG) estimator was used in the panel data analysis and while the long run elasticity coefficients were considered the same for all countries, the parameters were allowed to differ between country groups in the short-term model. Moreover, the long-term tendencies of the independent variables were determined by the Hodrick-Prescott filter method in order to eliminate the high volatility of the variables. In the study, it was concluded that the budget balance, total external debt and exports to GDP ratios, the growth rate, external debt service to international reserves ratio, the
10
deviation of the real exchange rate from its steady state level, the international interest rates and the countries’ fall in default in the past were significant in explaining the risk premiums.
Hartelius et al., (2008) showed that the global and domestic macro-economic variables were effective on the rapid decline in the risk premiums of emerging economies. An index was created through country credit ratings and credit outlook representing the macroeconomic structure and thus it was obtained from the model results that the index was more explanatory power than the credit rating on countries risk premiums. VIX index, which reflects developments in global risk perceptions and liquidity, the FED funds future market volatility and the U.S. interest rates were included in the model.
The major finding of the paper was that U.S. spot and expected interest rates seriously were affecting developing country risk premiums and in this sense, the FED’s managing the market expectations in a successful manner meant its high influence on the developing economies. In addition to these findings, it was also concluded from the results of the study that during the periods of global liquidity conditions in favor of developing countries, policy makers of emerging economies should apply policies improving macroeconomic structure. Thus, deterioration of the macroeconomic structure would be prevented in times of global volatility. In addition, Hartelius and et al (2008), proved in their study that even in the times when FED benchmark interest rate increased, implementation of the policies to improve macroeconomic structure would limit the negative effects of the process of raising the interest on the economy. The authors, as a continuation of their analysis, divided the sample period into two parts in order to find out how much of the decline in the
11
risk premiums of developing countries was due to strengthening of the macroeconomic structure. As a result of this application, it was understood that 51 percent of the decline in the country risk premiums resulted from global factors and 43 percent was due to the domestic macroeconomic factors.
In the study published in 2008 by Baldacci et al., the impacts of potential political risks, fiscal policy implementations and the global financial developments on the country risk premiums were examined through the annual average data of 30 developing countries between the sample periods of 1997-2007. For this purpose, different models were established by making use of logarithmic forms of variables. When the results of the analysis were examined, it was understood that the effect of fiscal policy on the risk premiums were relatively high as compared to political risk and in the case of supporting the country growth, the increase in public investment reduced the risk premiums. The model coefficient of budget surplus to GDP ratio was found to be higher than the coefficient of public investment. This result was interpreted as public investment through borrowing effects risk premiums negatively.
At the same time in order to reflect the country's liquidity and solvency international reserves, current account balance, terms of trade index and the inflation rate, and also FED interest rate policy as the indicator of the global developments were added to the model. The variables other than the FED interest rate were found to be statistically meaningful. As a main result of the study, it was emphasized that the macroeconomic indicators that reflect the improvements in public finance was more effective than the global factors in reducing the risk premium.
In the paper which was published on the same subject by Eichengreen and Mody (2000), 1300 bonds issued by the private and public sectors of emerging
12
economies were examined in the sample period of 1991-1997. The factors that caused narrowing the gap between developed and developing country bond yields were tried to be determined in the period following the 1994 Mexican crisis. Determinants of risk premiums were divided into two groups as domestic and global factors in line with other papers.
Eichengreen and Mody (2000), reviewed the 1033 bond issued by emerging markets in the period of 1991-1996 in order to determine the effectiveness of domestic and global factors on yield spreads and 277 bonds issued by these countries in 1997 were used for out of sample estimation. In the study, country-specific macroeconomic indicators were listed as: the international reserves to GDP ratio, the real growth rate, debt service to export ratio, the budget deficit to GDP ratio, the dummy variable representing whether the country's debt restructuring experienced in the past or not, the external debt to GDP ratio, regional dummy variables and dummy variables reflecting the issuer type, the private or public sector. The U.S. 10-year Treasury bond yield was included in the model in order to reflect the developments in both global liquidity and financial markets.
At the same time, the values given to countries on a scale of 0 to 100 by the Journal of Institutional Investor as an expression of credit rating was planned to be included in the model, but due to the fact that they exhibited a high correlation with domestic indicators they could not be used. In order to solve this problem, a model was developed in which credit rating was dependent and macroeconomic data were explanatory variables and the error terms obtained from the model were included in the model examining the bond yield differentials.
13
In the study the focus was on the evaluations made in the article of Kamin and van Kleist (1997). Kamin and van Kleist emphasized that the amount of debt securities issued by countries during the global surge periods dramatically narrowed, and the countries experiencing problems in macroeconomic indicators were pushed out of the bond issue market due to the contraction in global liquidity conditions in during crisis since international investors are being selective. Kamin and van Kleist concluded under this assessment in the analysis that the increases in policy interest rates in developed countries caused a decline in the country risk premiums of emerging economies. The emergence of this result was due to the fact that in times of global crisis the countries, whose macro-economic indicators were not strong and risk premiums were relatively high, were not able to borrow from global financial markets, but the only countries with strong economic fundamentals could be more active in the bond markets. Eichengreen and Mody (2000) wanted to evaluate the assessments of Kamin and van Kleist and examined the probabilities bond issues bonds of institutions by pooled probit model. As a result, it was realized that the developing economies having unstable macro-economic structure were pushed out of the international bond market by the increase in the U.S. treasury interest rates. It was observed that the having high levels of external debt ratio and total debt service ratio reduced the probability of bond issues. Moreover, authors suggested thet low levels of foreign currency reserves and high budget deficits were among the factors that reduce the possibility of issuing bonds.
In another study on the effects of global developments on country risk premiums, Dailami et al. (2005) focused on 17 developing countries’ data and used the Pooled Mean Group (PMG) estimator in order to estimate the short term dynamic structure by making use of the co-integration relationship between explanatory
14
variables and the dependent variable. In the analysis, both global and domestic factors were used together as explanatory variables and the domestic explanatory variables were listed as total external debt to GDP ratio, trade openness ratio, international reserves to total external debt ratio and short-term external debt ratio. The differences in yield between the U.S. high-and low-risk corporate bonds and the U.S. long-term interest rate were included in the model as global variables.
According to the results of the analysis, the impact of the countries’ macroeconomic indicators on the risk premiums was more than the U.S. interest rates and the openness ratio influenced more heavily risk premiums as compare to the other macro indicators. The high significance level of the openness ratio in the model was interpreted as; the outward-oriented developing economies can increase their external revenues through the balance of payments and meet their needs of external financing more quickly.
As continuation of the analysis, the sample periods were divided into two sub categories, the global financial stress periods and the periods in which there was no global turmoil. According to the results of the second analysis, contrary to the full sample model, the effectiveness of the U.S. interest rate on the risk premiums were higher than domestic indicators in times of global stress, but for the sample periods in which there was no global turmoil, the U.S. interest rate turned out to be statistically insignificant. In addition to this, it was observed that the domestic indicators except openness ratio maintained their significance in the periods of global volatility.
In the analysis, a new variable was obtained by multiplying the total external debt to GDP ratio and the U.S. interest rate, and it was noticed that this
15
variable was more effective on the risk premiums than U.S. interest rates. At the same time, it was realized that the impact of the U.S. interest rates on the country risk premium was not linear during the calm markets periods. The risk premiums of countries with high total external debt ratio responded more to the developments in the U.S. policy rates.
16
17
2.3. Methodology
In applied economics, the three types of data have been utilized: cross-section, time series and panel data. While the cross-sectional data express the data of economic agents such as countries and companies at a specified point in time, the time series include the observations of an economic variable at a certain time period. Panel data, however, obtained by combining the values of economic variables on a particular date with the time series data for each of these variables. The panel data contains more information due to the fact that they include both cross-sectional data and time series. The parameter estimations obtained through these data are considered to be more reliable and they are preferred in econometric studies (Brooks, 2008). The more efficient estimators are obtained through panel data analysis due to the degree of freedom is higher and the problem of multicollinearity between the units is lower in panel data analysis as compared to cross-sectional and time series data. In addition, the panel data allows for testing of more complex models than other data types (Brooks, 2008).
The main crucial step in the analysis with panel data is the determination of appropriate panel data model after gathering the data on the given topic. The most important feature of these models is that the character specific or time specific features of the unobservable explanatory variables can be estimated. The effects of the unobservable explanatory variables are called unobservable individual effects. If the unobservable effect occurs only either in time or cross-sectional dimension such kind of models are named as one-way, and if this effect is observed in two dimensions then these models are named as two-way panel data models. The models in which parameters do not display variability between units and times are called
18
Pooled Data Models. The management types of firms, the demographic structures and the presence or absence of natural resources can be given as examples to the situation where unobservable effect is seen only at the cross-sectional dimension. Oil prices and interest rates can be given as examples to the situation where unobservable effect is seen only at the time dimension. In the panel data studies, the most widely used methods are the Fixed Effects and the Random Effects models.
The fixed effect model is based on the assumption on which the unobservable individual effects are thought to be the constant and in relation with explanatory variables over time. The fixed effect estimation method is preferred in the studies conducted among the members of the countries of a specific geographical region or international organization. The random effect model represents a panel data model where the unobservable effects are considered to be random, not related to the explanatory variables and thus, they are included in the model as part of the error term. As compared to the fixed effects model, the number of parameters to be estimated decreases in random effects model, hence parallel to this, estimations are thought to be more consistent.
The subject of the study and the data structure should be examined carefully in order to choose either the panel data models or estimation methods. For this purpose, the established model should be examined to find out whether individual effects are present at cross-section and/or time dimension and also it should be determined whether the fixed or random-effect models is appropriate for the model.
The F-test and the Lagrange multiplier test (LM) developed by Bruesch Pagan can be used in order to determine the existence of unobservable effects at time and/or horizontal cross-sectional dimensions (Baltagi, 2005). To choose the fixed
19
effects or random effects panel model for the analysis requires the clarification of the relationship between unobservable individual effects and explanatory variables. In the case where the individual effects are associated with explanatory variables then the fixed effects model estimator is both efficient and consistent, if not the case, the random effects model is preferred. The existence of relationship between unobservable effects and explanatory variables is determined through Hausman test, which is obtained from the variance-covariance matrices of the estimators obtained from the random and fixed effects models and tests the null hypothesis that there is no relationship between the explanatory variables and unobservable individual effects. However, the Hausman test is not used in order to make a choice among the fixed and random effects models. The test should be used to determine which of the estimators to be used within the framework of random-effect panel data model. In case the null hypothesis cannot be rejected under Hausman test, the random effects panel data model can be solved through generalized least squares (GLS) and within-group estimators; and in the case the null hypothesis is rejected, the model can be solved through the within-group estimator.
On the other hand, the choice between the fixed and the random effects panel data models is accepted to be done during the formation of panel data set. The fixed effects panel data model should be preferred in the panel data studies related to a specific geographic region, the members of an international organization. On the other hand, the random effects panel model should be used in the panel studies on samples, which were created randomly out of a population, to reach a general conclusion about the population as a result of the model (Guloglu, 2010).
20
One of the problems frequently encountered in panel data analysis is that the error terms display a changing structure with variance. In panel models, the LM test is applied in order to test the phenomenon of heteroscedasticity (Greene, 1997). The variances which are present on diagonal of the error term matrix are assumed to be constant at the null hypothesis of LM test. The problem of heteroscedasticity in the models can be eliminated by using the covariance matrix estimator of White (1980). Another test utilized in the panel data analyses is the autocorrelation test which examines the relationship between the error term and its the lagged values. In the panel model, the Durbin Watson test, LM test and Wooldridge (2002) autocorrelation test are made use of in order to test autocorrelation in the error terms.
2.4. Model and
Data
There are several factors that affect the risk premiums in developing countries. In accordance with the studies examined in literature survey, the potential factors have been determined and categorized in four groups namely; the economic structure and performance indicators, the global indicators, the indicators which reflect the strength of liquidity and solvency. The solvency indicators reflect countries’ capacity of paying the long-term domestic and external debts. The liquidity variables imply the country’s short term ability to repay their debt. Although a country has capacity to repay its debts in the long-term, the same country may also have weakness in repaying its debts in the short-term. At any global crisis, in the periods of international liquidity shortage, the repayment of foreign currency denominated debts may be via international reserves. In this case, the external debt service, total international reserves and the country's export capacity stand out as important
21
variables in the short term. The linear panel data model for CDS premiums is represented by the following equation:
it it it it it it
ES
GI
LI
SI
u
CDS
=
α
+
β
1+
β
2+
β
3+
β
4+
In this model CDS represents the countries 5 year Credit Default Swap premiums, it
it
ES represents the economic structure and performance indicators, GI represents it
the global indicators, LI represents liquidity variables, it SI represents solvency it variables and u represents the error term with zero mean and constant variance. it
α
and β represent the coefficients of the intersection and the slopes of explanatory variables respectively. While the number of the group in the model is represented by i, t refers to the length of time for each group. The model for all sample periods willbe solved by within estimator under the one-way fixed effects model.
In the analysis, the data of 16 developing countries have been used. The countries included in the study can be listed as Brazil, Chile, China, Colombia, Hungary, Indonesia, Israel, Korea, Malaysia, Mexico, Peru, Philippines, Russia, South Africa, Thailand and Turkey. The countries, whose CDS premiums are persistent and which are considered as developing country in the evaluation report of international organizations and the investment companies, are included in the sample. As the indicator of country risk premium, different from economic literature, US 5 Yr CDS premiums have been used instead of bond yield spreads. The sample period covers the time between the first quarters of both 2003 and 2011. Some of the data used in the analysis have been obtained from the IMF's International Financial Statistics (IFS) data set and Bloomberg. Especially the countries’ public finance indicators and country data that cannot be provided by IFS and Bloomberg have been
22
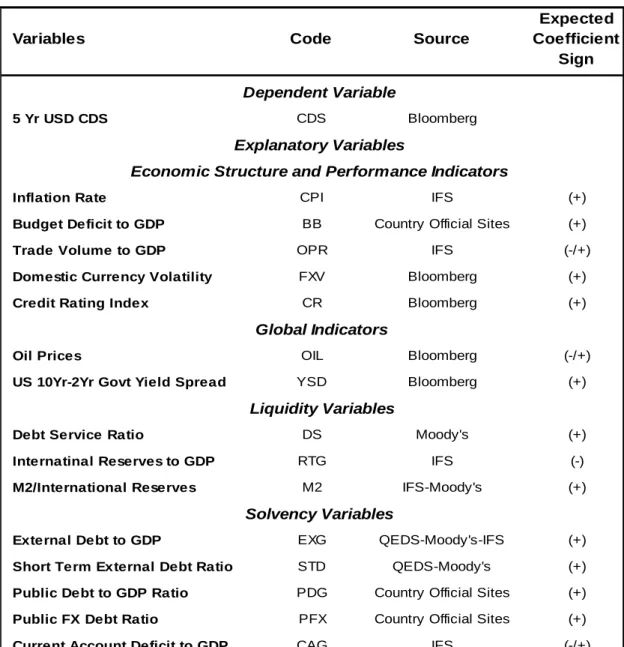
gathered from the countries’ Ministries of Economics, National Statistical Institutes websites and statistical booklet published by Moody's. The codes and resources of all candidate variables for the model, and their expected signs are summarized in Appendix Table 1.
However, some variables which were considered as factor affecting risk premiums represent same types of developments. For that reason, the correlations of all candidate variables with each other were calculated and the variables that had high positive or negative correlation with each other were not used together in the model established for the panel analysis. The correlation matrix of variables is given at Appendix Table 3. The indicators having correlations below 50 percent in positive or negative direction with the other model variables were included in the model1.
Different from the literature, VIX index, as an indicator of global risk appetite, hasn’t been utilized in this study. Instead, volatility in local exchange rate which has high correlation with the index and also contains information about the developments in domestic market has been included in the model. In the same way, instead of the U.S. 3-month Treasury bond interest rate and FED policy rate, accepted as indicators of global liquidity, the price of oil is preferred. By doing so, the slope of U.S. yield curve which has a very high positive correlation with the U.S. short-term interest rates has been included in the model. On the other hand, the total trade volume to GDP ratio indicating openness ratio has been preferred to exports to GDP ratio. Likewise, since there is a high correlation between the credit rating index calculated for the countries and GDP per capita income data, credit rating indices
1 Same type of analysis was conducted with the correlation uper bound of 30 percent and the
coefficients of variables did not exhibited significant change in terms the direction of the impact on risk premiums. So analysis was conducted on the base of 50 percen correlation upper bound in order to include more economic indicators in the model.
23
which are considered to be more influential on risk premium have been included in the model. Between the total external debt to GDP ratio and total external debt to international reserves ratio the former has been preferred, by this choice the international reserves to GDP ratio indicating reserve adequacy could be included in the model. In the same way short-term external debt to total external debt ratio has been preferred to short-term external debt to international reserves ratio since reserve adequacy ratio was included in the model. The codes and resources of the variables in the model, and their expected signs resulting from the model are summarized in Table 2.3. The descriptive statistics for the indicators included in the model are given in Appendix Table 2.
Since the panel data carries time-series feature, the data should be stationary otherwise the estimation results may be biased and inconsistent. The stationarity tests developed for the panel studies resemble to unit root tests applied to time series while displaying some dissimilarities. Unit root tests used frequently in panel data analysis are Im, Pesaran, Shin (IPS) and Levin, Lin, Chu (LLC) (Güloğlu,2010). IPS statistics is derived from the assumption that unit root coefficient varies among the cross-sections and whereas LLC statistics from the assumption that unit root coefficient is constant among the cross-sections. In this study, the IPS unit root test results has been taken into account. The presence of unit root in the budget deficit, the total external debt, international reserves, the public debt stock to GDP ratios and foreign currency denominated public debt ratio has been understood according to the results of the IPS test. The non-stationarity in these variables has been eliminated by taking their first-order difference.
24
Variables Code Source
Expected Coefficient
Sign
5 Yr USD CDS CDS Bloomberg
Inflation Rate CPI IFS (+)
Budget Deficit to GDP BB Country Official Sites (+)
Trade Volume to GDP OPR IFS (-/+)
Domestic Currency Volatility FXV Bloomberg (+)
Credit Rating Index CR Bloomberg (+)
Oil Prices OIL Bloomberg (-/+)
US 10Yr-2Yr Govt Yield Spread YSD Bloomberg (+)
Debt Service Ratio DS Moody's (+)
Internatinal Reserves to GDP RTG IFS (-)
M2/International Reserves M2 IFS-Moody's (+)
External Debt to GDP EXG QEDS-Moody's-IFS (+)
Short Term External Debt Ratio STD QEDS-Moody's (+)
Public Debt to GDP Ratio PDG Country Official Sites (+)
Public FX Debt Ratio PFX Country Official Sites (+)
Current Account Deficit to GDP CAG IFS (-/+)
Liquidity Variables
Solvency Variables Dependent Variable
Explanatory Variables
Economic Structure and Performance Indicators
Global Indicators
Table 2.3. Model Variables and Sources 2
2.5. Estimations and Results
In this part of the study, the panel data application will be held to determine the factors affecting country risk premiums. As a first step, the type of the panel data model which is convenient for the study will be determined and the model will be run to identify the variables which are significantly affecting the CDS premium for the entire sample period. Then, the panel data tests will be performed to identify the
2 Credit notes given by S&P, Moody's and Fitch were paired with the numbers from 1 to 15
respectively for each agency. The highest credit rating was matched with 1 and the lowest credit rating was given a value of 15. Then credit notes issued for the countries were averaged.
25
existence of heteroscedasticity and autocorrelation problems, if necessary these problems will be eliminated. Following to this, the rolling base panel data study will be performed in order to reveal the change in risk perceptions towards to emerging countries in a time trend framework since the first quarter of 2003.
At the creation stage of sample set, most of the countries, which are evaluated under the heading of emerging or developing countries by international organizations and investment reports and have persistent historical data of CDS premiums, were included in the panel data analysis. Due to limited-randomness of cross sections, the fixed effects panel data model has been preferred in the study. Besides, the unobservable individual effects have been assumed to be one-sided in line with the literature review. The analysis was conducted with STATA econometric package due to its wide scope of application and its flexibility in the panel data studies. As a first step, the presence of unobservable individual effects based on different assumptions has been tested by F-test for the entire sample and all sub sample periods. Under the fixed effects model solution, the null hypothesis claiming the non-existence of individual effect was rejected for all sub-sample periods. Then the model for all periods has been solved by within estimator under the one-way fixed effects model.
In the panel data analysis, frequently encountered problem of changing variance structure of the error terms was tested by two different methods, which are the adapted Wald statistic and the LM test, the null hypothesis asserting the non-existence of heteroscedasticity was rejected for all sub-sample periods. Another test used in the panel data analyses was the autocorrelation test which examines the relationship between the error term and its lagged values. In the model panel, the
26
LM test was applied in order to test the presence of autocorrelation in the error terms and following to this the existence of the autocorrelation problem was accepted for all sub-sample periods.
In order to provide consistency and stability in the estimation results of the model, the country dummy variables were included as an explanatory variable in the model, estimation was conducted for all sub-sample periods by applying the generalized least squares estimation method with the correction of autocorrelation and heteroscedasticity problems. On the other hand, the Hausman test with the null hypothesis claiming the non-existence of relationship between the explanatory variables and the unobservable individual effects was conducted. In Hausman tests carried out for all sub-sample periods the null hypothesis was rejected.
2.5.1.
2003 Q1- 2011 Q1
The estimation result of the entire sample period is summarized in Table 2.4. According to the results, the inflation rate, the budget deficit and the openness ratio, which are the economic performance indicators, appeared to be notably significant to explain the country CDS premiums. According to the estimation results, for each 1 percentage point increase in the rate of inflation and the budget deficit to GDP ratio causes respectively 12.14 and 4.80 basis points rise in the country CDS premiums.
On the other hand, in contrast to the literature survey the increase in openness ratio results an increase in risk premiums. It was foreseen in the literature survey that the countries with high trade openness would provide more rapid economic balances through the balance of payments in any fluctuation period
27
compared to the other countries. Moreover, it could be seen that there is a considerable correlation between countries’ openness ratio and real growth rates, and the countries with high linkages with other economies have experienced high real growth rates. However, the estimation results specify the opposite of this situation and the 1 percentage point increase in the openness ratio leads to an increase of 2.85 basis points in CDS premiums. This result can be interpreted as; the emerging economies with high openness ratio could be relatively more affected during a possible global fluctuation periods through both trade and portfolio investments channels; and for the so called periods the domestic demand in those countries is not sufficient to stimulate the economy.
Parallel to the results of previous studies, it is seen that the investors give significant attention to the developments in the solvency and liquidity indicators and they perceive the public sector debt, the debt service ratio and the short-term external debt ratio as important risk indicators. The countries with weak solvency indicators are thought to face with the inability to pay their external debts in time of a global fluctuation. As seen on the Table 2.4., 1 percentage point increase in the public debt stock to GDP ratio, the debt service ratio and the short-term external debt ratio results in an increase of 2.18, 5.27 and 2.94 basis points in country CDS premiums respectively.
In the model, the slope of U.S. yield curve and the oil price that reflect the global developments are significantly effective on the CDS spreads. The developments in the U.S. economy are important for other countries; thus, the structure of the U.S. yield curve reflects expectations for the U.S. economy. The increase in the slope of the yield curve, might indicate the overheating of U.S.
28
economy and increased inflationary pressures, furthermore, the steepening of yield curve may also indicates the uncertainty regarding the future of the overall economy. For the first case scenario the rise of the FED's interest rate will begin in line with overheating of the economy. As the interest rate increase suggests a possible contraction in liquidity, it induces to an increase in the risk premiums of the developing countries. On the other hand, the flattened or inverted yield curve indicates an expected slowdown in the economy and also possible reduction in FED’s policy rates in order to revive the economy. The fall in FED policy rates, as it marks an increase in global liquidity, leads to a decrease in the country risk premiums. According to the model estimations, 1 percentage point increase in the difference between the long-term interest and the short-term yields in the United States leads to a 37.87 basis point increase in the country risk premium.
On the other hand 1 U.S. dollar increase in oil prices induces to 2.01 basis points reduction in the CDS premiums. Although the increase in oil prices impose an upside risk in the inflation rates in all countries and in the external financing needs of the countries which are net importer of petroleum products, the increase in oil price is generally perceived as an indicator of acceleration in world economic activity. While the rise in oil prices enhances the incomes and savings of the oil-exporting countries, at the same time that leads to a significant increase in global liquidity, portfolio and direct investments in developing country markets, as a result diminishing of the risk premiums. High oil prices, on the other hand, affect the oil-exporting economies positively due to its impact on the revenue side. The need for external financing of the oil-exporting economies with rising foreign exchange income from petroleum products is reduced significantly.
29
Coef. Std. Err. Z-value P-value Budget Deficit to GDP 4.80 1.8598 2.58 0.0100 Current Account Deficit to GDP -1.57 1.3640 -1.15 0.2500
Inflation Rate 12.14 1.4692 8.26 0.0000
Oil Prices -2.01 0.1549 -12.97 0.0000
Short Term External Debt Ratio 2.94 0.9618 3.06 0.0020
FX Volatility 48.48 7.4199 6.53 0.0000
US 10-2YR Govt. Yield Spread 37.87 4.1119 9.21 0.0000
Trade Volume to GDP 2.85 0.4561 6.25 0.0000
Credit Rating Index 4.07 6.8057 0.60 0.5490
Total External Debt to GDP 1.00 0.7965 1.25 0.2110 Internatinal Reserves to GDP -1.52 1.1558 -1.31 0.1890
Public Debt to GDP 2.18 1.2402 1.75 0.0790
Debt Service Ratio 5.27 1.0919 4.83 0.0000
M2 to International Reserves -13.64 4.0745 -3.35 0.0010
Public FX Debt Ratio 1.66 1.3930 1.19 0.2320
CDS Premium Full Sample
2003Q1-2011Q1
The nominal exchange rate volatility, which reflects the global and domestic developments, and has a high correlation with the VIX index, is among the factors which create uncertainty. The increase in exchange rate volatility increments the uncertainty, thus constitutes a negative impact on the investments and growth. Parallel to 1 percentage point increase in the exchange rate volatility, there occurs 48.48 basis points increase in the country risk premiums.
30
2.5.2.
Rolling Base Analysis
In this section, panel data analyses were repeated to examine the risk perception changes in the financial market towards emerging countries on a rolling basis from 2003 Q1. 16 and 20 quarters were chosen separately as a length of each sub-sample period in order to eliminate the seasonality on the analysis. Since for each one quarter shift, the same quarter of the next year was added instead of the eliminated previous year correspondent quarter. 18 and 14 sub-sample periods were constructed for 16 and 20 quarter rolling analysis respectively by shifting just one quarter till reaching 2011 Q1 as a final end point. The estimation results of the rolling base panel data analysis were summarized in Appendix Table 4 and 5 for two rolling base analysis. The coefficients of each model variables were depicted on Graphs 2.3, 2.4, 2.5 and 2.6 under the respected category of four groups namely; the economic structure and performance indicators, the global indicators, liquidity and solvency variables. Blue dashed points are representing the significant coefficients with 95% confidence interval. As seen on graphs all model variables represent smooth changes within rolling base analysis and this reflects the robustness of the model. Whereas the structural break tests for the variables, which were significant for all sub-sample, were not carried out and all the assessment are based on the graphical representations of the coefficients.
To mention the key findings from rolling base analysis; Chart 2.3 depicts the developments in the coefficients of domestic indicators within rolling base panel data analysis for 16 and 20 quarter together. As seen on Graph 2.3., the inflation rate seems to be effective on the risk premiums during nearly all sub-sample periods and its coefficient has increased in absolute terms during the sub-samples after the burst
31
of financial crisis. Having significant impact on in nearly all sub-sample periods of analysis confirmed the necessity of inflation targeting regime in the risk perceptions, since the countries facing with the phenomenon of high inflation cannot display sustainable growth rates and show disorders in their public finance.
Another assessment from Graph 2.3. is that the budget deficit, which had meaningful coefficient during the entire sample period and was insignificant in explaining the risk premiums during the sub-sample periods till R10 and R5 for 16Q and 20Q rolling analysis respectively, has gained significance in the latter sub-sample periods with the increase in its coefficient levels. Especially as a result of expansionary fiscal policies implemented in developed countries, fast-growing budget deficits became prominent risk factors that might influence the private consumption negatively by increasing the long-term interest rate since the last quarter of 2009. Because, the concerns over sustainability of the existent budget deficits of the countries with high debt burden, such as Greece, Spain, Portugal and Italy, started to increase and there occurred deterioration in risk perceptions regarding fiscal sustainability of these countries. Furthermore, the high level budget deficits points out that the government cannot sustain the revenue-expenditure balance; especially in the face of a global shock the balance of the debt will even get worse and countries with high budget deficit will lose their flexibility during sharp contraction periods.
As seen on Graph 2.3. the trade volume to GDP ratio has been losing its impact on risk premiums with each quarter shift and its coefficient is converging nearly to zero. The trade channel plays a crucial role in deepening the effect of crisis especially for the developing countries having high trade linkages with developed
32
countries. With the drastic decline in world trade volume with the crisis, a severe recession was estimated in particularly export-oriented developing countries. As known, in pre-crisis period, high saving rates and low domestic demand were seen in the Far East and in export oriented countries; whereas many developed countries particularly the US show a tendency to over-consumption. The rich countries' consumption expenditures are financed by the relatively poor countries. With the burst of crisis, household demand in rich countries deteriorated remarkably and developing countries canalized their savings to increase their domestic demand and started to shift their export markets from rich countries to developing ones in order to have more diversified markets and to eliminate adverse effects of the crisis. As a result, many developing countries presented a remarkable resistance to the crisis and the impact of sharp decline in trade volume on economic growth has been limited.
At same time, credit rating index, which is highly significant in explaining the countries risk premiums in all sub periods and FX volatility are gaining momentum with the burst of the financial crisis. Country credit rating, while providing information to inventors about the risk level of a country’s investment climate, is a significant indicator used by investors intending to invest abroad. Volatility of the nominal exchange rate is among the factors which create uncertainty. The increase in exchange rate volatility increases the uncertainty and thus constitutes a negative effect on growth rate. Taking all these developments into consideration, it can be concluded that individuals have paid greater attention to domestic indicators in their risk perceptions as compared to pre-crisis periods.
33
Graph 2.3. Rolling Base Coefficients - Economic Structure and Performance Indicators 3
3
34
Graph 2.4. depicts the coefficients of global indicators in the rolling base analyses. The first of all, the slope of the U.S. yield curve is significant in explaining CDS premiums during all sub-samples and its coefficient reached its peak with the burst of the crisis and demonstrated downward trend thereafter. As seen on Graph 2.4. the coefficient of oil prices is gaining significance and increasing in absolute terms during all sub-sample periods after R8 and R4. The trends in the coefficients of the slope of yield curve and oil prices can be interpreted as follows; initially, with burst of financial crisis, the credit mechanism stalled within financial markets and market participants hesitated to give long term credits to each other. As known the longer-term tip of the yield curve is determined by coupon bonds which have relatively low liquidity and appear more sensitive to changes in risk perceptions by market players. So the credit crunch caused US yield curve to become one of the prominent risk factor for overall US and World economy at the beginning of the crisis. In the latter periods, central banks implemented expansionary policies and provided liquidity to calm down the credit crunch in the financial markets. The coordinated actions of developed countries central banks and international organizations softened long term financing needs. As a result the steepening of US yield curve has become less affective on countries risk premiums in the subsequent periods. On the other hand an increase in oil prices reflects the recovery in the overall economy in the long run and a decrease in the impact of the crisis.
35
Graph 2.4. Rolling Base Coefficients - Global Indicators
As seen on Graph 2.5., the coefficient of debt service ratio, which has an increasing impact on the CDS premiums in the early sample periods, turned out to be negative in latter sub-samples. Debt service ratio implies the country’s short term ability to repay her debt and represents the ratio of principal and interest payments of external debt within one year horizon to current account revenues for the same year. In a period of global turmoil, the countries having high debt service ratio induces that the probability of default in their short term debts increases. However, downward trend in the coefficient of debt service ratio is thought to be in line with expectations. With the burst of global crisis, the international organizations, governments and central banks of developed countries implemented coordinated expansionary fiscal and monetary policies in order to soften short term impact of the crisis. During so called period IMF provided flexible credit lines to emerging economies having short term financing needs and FED conducted swap operations
36
with emerging economies in order to provide foreign currency to those countries. These measures were thought to eliminate the market expectation of any default in the rollover of developing countries short term debt.
On the other hand the coefficient of international reserves to GDP ratio gained greater impact on risk premiums with the start of current crisis and its effect on CDS has become smaller in latter sub-samples. In the pre-crisis period as a consequence of the support of the abundance of liquidity in international markets and overly optimistic risk perceptions many countries experienced rapid increases in bank lending and the rates of indebtedness for both household and the real sector. Whereas the loss of confidence appeared after the global crisis and liquidity shortage adversely affected the tendency of international markets to lend developing countries. In developing countries having low export to import ratio and only limited access to external credit sources, imports should be met through the country's international reserves. Reserves should also be used for paying external debts of public and private sector in the case of global liquidity shortage. So, having a high level of foreign reserves, especially during global crisis, gives positive signals to market participants and eliminate the likelihood of any short term default in paying debt and providing funds to import necessary input for domestic economy.
37
Graph 2.5. Rolling Base Coefficients - Liquidity Variables
As seen on the Graph 2.6., current account deficit ratio, which is meaningless in explaining risk premiums in the entire sample period and early sub-sample periods, turned out to be significantly meaningful in explaining risk premiums during recent sub-sample periods. So the financing needs for current account deficit became prominent risk factor, since the countries having significant level of current account deficits are more sensitive to fluctuations in global liquidity conditions due to their need for external financing. At the same time, the similar type of trend is observed in the coefficient of public sector foreign currency denominated debt ratio. Having a
38
high level of foreign currency denominated debt in total public debts foreshadows the borrowing ability of the governments in local currency as well as investors’ confidence in local currency. In addition to this, the continuity of this trend in public FX debt ratio gives negative signal on the point that there may take place severe distortions in debt service ratios in periods of major exchange rate adjustment. The movement of coefficients of the current account deficit and public FX debt ratio can be interpreted as follows: in the pre-crisis period, the central banks of developed countries pursued loose monetary policy, there occurred a rapid decrease in policy interest rates and the low levels were maintained for a long time. At the same time, the emergence of a wide variety of products in financial markets and the increase in the leverage ratios of financial institutions play crucial role on the rapid increase of liquidity in financial markets. As a result of low interest rate policy during this period, global liquidity remained at high levels, the risk-taking appetite increased and investors directed their interests to emerging markets with the expectations of higher returns. Whereas, with the burst of financial crisis, international credit markets suddenly cut their lending and the credit facilities disappeared for developing countries for their external financing needs. As a result the sustainability of current account deficit and composition of public sector debt have become prominent risk factor.
In a similar way, public debt stock to GDP ratio reflecting the country’s ability to pay its debt has become statistically significant in explaining risk premiums during recent sub-sample periods and its coefficient has been gaining momentum. As it is known, particularly the governments of developed countries implemented expansionary fiscal stimulus programs and initially these measures were thought to cause recovery signals in the global economy. However, solvency
39
indicators of the countries experienced a serious deterioration due these measures and the negative impact caused by deterioration in fiscal sustainability has started to become one of the crucial factors in markets risk perception.
Graph 2.6. Rolling Base Coefficients - Solvency Variables