COMPARISON OF PERSONAL LOANS AND THE RISKS EMERGING IN THE BANKING SECTORS OF TURKEY AND 25 EUROPEAN UNION COUNTRIES STARTING FROM 2002
Yrd.Doç.Dr. Kemal YAMAN1
ABSTRACT
An eruption in the credits in the Turkish banking sector has been experienced since 2005. The significant economic parameters coming first that cause this situation are economic growth, inflation, foreign trade volume, privatization, and positive developments in the foreign exchange reserves. Personal loans and mortgage loans constitute a significant portion of the growing credit volume. Moreover, the weights of the foreign banks in Turkey have further increased since 2005. Especially, depending on the improving loans prudent risk management and also effective supervision are important. If necessary attention is not given to these subjects, international financial crises may be seen.
Keywords: International financial crisis, corporate and personal loan, mortgage loan, credit
card, non-performing loan
JEL Classification: G01, G21
ÖZET
2005 yılından bugüne Türk bankacılık sektöründe kredilerde bir patlama yaşanmıştır. Bu durumu doğuran önemli ekonomik parametrelerin başında ekonomik büyüme, enflasyon, dış ticaret hacmi, özelleştirme ve döviz rezervlerinde yaşanan olumlu gelişmeler gelmektedir. Bireysel krediler ve ipotek kredileri gün geçtikçe büyüyen kredi hacminde önemli bir payı teşkil etmektedir. Ayrıca, yabancı bankaların 2005 yılından beri Türkiye‟deki ağırlıkları daha da artmaktadır. Özellikle gelişen kredilere bağlı olarak tedbirli risk yönetimi ve bunun yanında etkili denetim önem arz etmektedir. Bu konulara gereken önem verilmediği takdirde uluslararası finansal krizler yaşanabilir.
Anahtar Kelimeler: Uluslararası finansal kriz, kurumsal ve bireysel kredi, ipotekli kredi,
kredi kartı, takipteki kredi
JEL Sınıflaması: G01, G21
1. INTRODUCTION
This article deals with development of personal loans because of their threatening effect andtheir function in economy. The international financial crisis which started in 2007 made it clear that risks have been underestimated when granting credits. Moreover, both banks and capital markets were tempted to do totally inadequate and unacceptable credit checks (poor risk management). They had also ignored information obtained from credit rating in approving loans. All these indicate the weakness in the area of risk management caused by banks (Rudolph, 2009). Rudolph also stated that even if the usual requirement of equity ratio in terms of value for residential real estate should be at least 20%, those commitments have neither been honored nor even totally dropped. Since 2001 the low interest rate levels in the U.S. have led to an increase in mortgage loans for the acquisition of property, thus causing an increase in prices in the housing market. However, interest rates rose in 2006/2007 and housing prices in the U.S. have collapsed. For this reason borrowers were no longer able to finance their mortgage loans with bridge loans as often seen in the past. As a result, borrowers could not pay off their debts. The financial crisis in the U.S. was caused by payment defaults on subprime loans and at the same time this situation soon led to an international liquidity crisis. Therefore, the international banking and financial crisis was unavoidable (Gräf, 2008).
Once the significance of loan granting for personal loans has been demonstrated with the example of international financial crisis in the U.S. , now it is time to look at the development of personal loans in the Turkish banking sector since 2002.
This time period has been chosen due to the increased entry of foreign banks2 in Turkey following the acquisition of bank shares after 2004. In this article an overview of the situation concerning personal loans both before and after the entry of foreign corporations in the Turkish banking sector is given.
First, two components of credit are considered, more precisely private and corporate loans. It is obvious that both total credit and its constituent parts increased from 2002 to March 2008. In particular, a rapid rise in personal loans was recorded, whereas growth in corporate credit was less strong (BDDK, 2008d: 31).
2. GROWING ROLE OF FOREIGN BANKS IN TURKEY
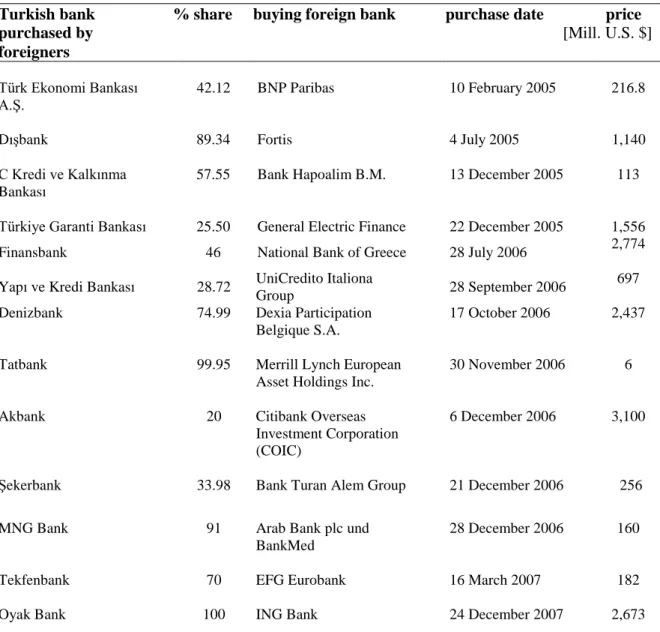
Table 1 and the results from investigation of the financial data obtained from web pages of the involved banks make it clear that, investing foreign banks in Turkey have adequate capital resources. It also follows that eight of these banks are globally famous and the other eight are from countries like Lebanon, Kazakhstan, Kuwait, and Israel. Table 1 also indicates that foreign banks have intensively invested in Turkey since 2005. Until 2002, foreign banks were active through their own branches or subsidiaries in Turkey TBBa. This situation changes with the entry of direct investment in 2005. Since then foreign banks prefer the acquisition of bank-shares as entry form. Their total investment has already reached 16.6 billion [bn] U.S. dollars (Table 1). While in 2003 they only controlled 3% of all assets (TBBb), by December 2006 their share had increased up to 35.9% (BDDK, 2006c: 33). In March 2010, foreign banks managed 39.8% of total assets in the Turkish banking sector (BDDK, 2010: 19).
Table 1: Share of foreign investors in Turkish banks
Turkish bank % share buying foreign bank purchase date price purchased by [Mill. U.S. $]
foreigners Türk Ekonomi Bankası A.Ş. Dışbank 42.12 89.34 BNP Paribas Fortis 10 February 2005 4 July 2005 216.8 1,140 C Kredi ve Kalkınma Bankası
57.55 Bank Hapoalim B.M. 13 December 2005 113
Türkiye Garanti Bankası 25.50 General Electric Finance 22 December 2005 1,556 Finansbank 46 National Bank of Greece 28 July 2006 2,774 Yapı ve Kredi Bankası 28.72 UniCredito Italiona
Group 28 September 2006 697 Denizbank Tatbank Akbank 74.99 99.95 20 Dexia Participation Belgique S.A.
Merrill Lynch European Asset Holdings Inc. Citibank Overseas Investment Corporation (COIC) 17 October 2006 30 November 2006 6 December 2006 2,437 6 3,100
Şekerbank 33.98 Bank Turan Alem Group 21 December 2006 256
MNG Bank
Tekfenbank
91
70
Arab Bank plc und BankMed EFG Eurobank 28 December 2006 16 March 2007 160 182
Turkish Bank 40 National Bank of Kuwait 29 January 2008 160 Türkiye Finans Katılım Bankası 60 The National Commercial Bank 31 March 2008 1,080
Source: Authors„ design based on TBBa and internet pages of involved banks
3. SIGNIFICANT ECONOMICAL COMPONENTS SUPPORTING CHANGES IN THE CREDIT BUSINESS
Turkey was characterized by unstable politics in the period of 1980-2002 as clearly seen by frequent government changes. Since Turkey has been governed by only one party from November 2002 until today, the political situation has stabilized. Simultaneously, the enforcement of laws to liberalize the economy made the implementation of reforms for democratization easier. The entire reform course of Turkey from 2002 till today is rewarded by opening accession negotiations with European Union in October 2005.
The 1980s and 1990s were characterized by a volatile and precarious economic situation, high inflation and especially the barely perceived role of banks as financial intermediaries. Moreover, in the 1990s banks were not involved in the financing of households and companies instead focusing on financing the public sector deficit (Schuss, 2007).
It is also clear that the Turkish economy has developed from an agricultural state to an industrial state. The economy growed sharply from 2002 to 2007, but the situation changed in 2008 by falling to negative territory with a 4.7% decrease in 2009. Inflation also droped significantly from 55.3% in 2001 to 5.3% in 2005 and 5.4% in 2009, with the only exceptions of years 2006 and 2008 (Figure 1). Inevitably, economic growth and inflation data worsened in 2008 probably due to the global financial crisis and its consequences in Turkey. The Central Bank has built up substantial foreign exchange reserves from 28.1 bn U.S. dollars in 2002 to 74.8 bn U.S. dollars in 2009. In addition, foreign trade volume has increased enormously and at the same time period Turkey‟s current account has suffered because of an import pull. Since Turkey imports more than that it exports in 2009, the exports amounted to 102.1 bn U.S. dollars while imports reached 140.9 bn U.S. dollars (TUIK, 2009: 618). Furthermore, foreign debt falls from 56.2% of gross national product (GNP) in 2002 to 43.4% in 2009 (TUIK, 2009: 617). However, foreign debts in absolute figures have increased. This apparent paradox is because of the strong growth in gross domestic product (GDP) (TUIK,
2009: 617). In addition, revenues from privatization since then have reached to significant amounts. In the period of 1986-2002 they have amounted just to 7.5 bn U. S. dollars, whereas they have reached to 30.2 bn U.S. dollars in the period between 2003 and 2009 (ÖİB, 2009: 43). Moreover, the number of foreign companies which have invested in Turkey has grown significantly in the period of 2002-2009. When concrete figures are considered, it becomes clear that only 5,438 companies have come to Turkey for investing in the period of 1954-2002,.However, 18,977 companies have chosen Turkey from 2003 to 2009 (HM, 2008: Tablo-ek-5 and HM, 2011: Tablo-ek-6). Furthermore, the Turkish banking sector has dramatically increased its attractiveness for foreign banks after the changes which were prompted by the restructuring program approved in May 2001 (Schuss, 2007).
This restructuring program was based on four basic components (BDDK, 2006d: 37): 1. Restructuring of the state banks, in particular with the focus on privatization.
2. Solving the problems of poor banks by merger, sale, or liquidation, therefore transferring them to a deposit guarantee fund.
3. Restructuring of the private banks which have been affected by the crisis. 4. New statutory regulations to control and adapt to international standards.
Figure 1: Development of economic growth and inflation
Source: Authors„ design based on TUIK, 2008 and TUIK, 2009: 554 and 6473
3 Important remark: In charts 1, 3, 5 and 7 percentages are given. Since I use a German language version of Microsoft Excel, these
percentages are separated by commas “,” instead of a dot “.”, as it could be expected in the Anglo-Saxon world. Consequently, in chart 2 absolute numbers are given, and these figures are separated by commas instead of dots, as it is done in the Anglo-Saxon world.
-9,5 7,9 5,9 9,9 7,6 6 4,6 0,7 -4,7 55,30 44,40 22,50 9,5 5,3 11,7 6,2 12 5,4 -20 -10 0 10 20 30 40 50 60 2001 2002 2003 2004 2005 2006 2007 2008 2009 Percentage change
4. DEVELOPMENT OF PERSONAL LOANS
By presenting personal loans in absolute figures (bn U.S. dollars) for the period 2002-2009, the importance of personal loans can be emphasized. In this situation a steady growth in personal loans can be observed except in 2008 (Figure 2). The weakness of the Turkish currency on 31 December 2008 when compared with the currency on 31 December 2007 results in contraction of private loans in bn U.S. dollars, although the data indicated a rapid increase in Turkish currency. From this perspective it is seen that private loans reached a total value of 117.4 bn Turkish lira (TL) in December 2008 in comparison with the recorded absolute figure of 94.9 bn TL in December 2007 (BDDK, 2008b: 26 (Tablo 2.2-7)). This corresponds to a percentage rise of 24%. Thereby, it must be recognized that continuous annual increases were attained in the period of 2002-2009. Percentage figures on the bar graph for the year in question show the increase over the previous year. For instance, personal loans increased exactly 130% from 2002 to 2003. Hence, private loans grew nearly by 22 times in the period of 2002-2009 ( Figure 2).
Figure 2: Development of personal loans
Source: Authors„ design based on BDDK, 2006c: 51 and BDDK, 2009: 434
Another important fact is that corporate loans remained as the dominant type of credit product, constituting 78.7% of total credit in 2000 and 84.3% in 2002 (BDDK, 2001: 11 and BDDK, 2004a: 40). Thus, personal loans had less importance before 2003 within the total amount of loans.
4 These values in Turkish currency are converted using the official exchange rate of 31th December of each particular year; see TCMB.
4 9,2 20 34,8 49,2 81,9 77,2 86,8 0 20 40 60 80 100 2002 2003 2004 2005 2006 2007 2008 2009 bn U. S. Do lla rs Private credit 41 % 66 % 74 % 117 % 130 % - 6 % 12 %
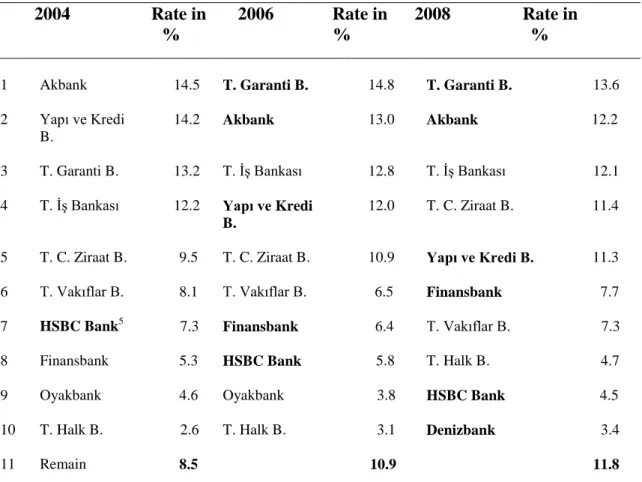
Table 2: Percentage distribution of personal loans among top ten banks
2004 Rate in 2006 Rate in 2008 Rate in
% % %
1 Akbank 14.5 T. Garanti B. 14.8 T. Garanti B. 13.6 2 Yapı ve Kredi
B.
14.2 Akbank 13.0 Akbank 12.2
3 T. Garanti B. 13.2 T. İş Bankası 12.8 T. İş Bankası 12.1 4 T. İş Bankası 12.2 Yapı ve Kredi
B.
12.0 T. C. Ziraat B. 11.4
5 T. C. Ziraat B. 9.5 T. C. Ziraat B. 10.9 Yapı ve Kredi B. 11.3 6 T. Vakıflar B. 8.1 T. Vakıflar B. 6.5 Finansbank 7.7
7 HSBC Bank5 7.3 Finansbank 6.4 T. Vakıflar B. 7.3
8 Finansbank 5.3 HSBC Bank 5.8 T. Halk B. 4.7
9 Oyakbank 4.6 Oyakbank 3.8 HSBC Bank 4.5
10 T. Halk B. 2.6 T. Halk B. 3.1 Denizbank 3.4
11 Remain 8.5 10.9 11.8
Source: BDDK, 2007: 42 and BDDK, 2008c: 39
On the other hand, loans granted by banking sector to real economy have grown significantly in the time period of 2002 to 2009. While in 2002 corporate credit amounted to just 25.9 bn U.S. dollars, in only five years it had reached 164.4 bn U.S. dollars (BDDK, 2007: 54), therefore increasing more than sixfold. It should therefore be pointed out that this is a situation in which the components of credit, private and corporate loans, developed contradictorily. The percentage of corporate credit in the credit business was 81% in 2003 and since then it had been falling constantly until reaching just 67% in 2007. In contrast, personal loans accounted for 19% of all loans in 2003 and their share in the total had been continuously rising until it reached 33% four years later (BDDK, 2007: 54). This trend persisted until 2009 as Figure 3 shows, when personal loans make up 33.3% of all credit volume.
After presenting the absolute values of personal loans for 2002-2009 time period, Table 2 indicates the 10 banks which provided 91.5% of all personal loans in the Turkish banking sector in 2004, 89.1% in 2006, and 88.2% in 2008. It should be noted that these banks have
been progressively loosing prominence since 2004. The banks shown in bold in Table 2 are either foreign banks or banks which have foreign partners. Then it becomes clear that, six of ten most prominent banks already had foreign co-owners in 2008. This tendency also shows their rising role in granting personal loans.
5. COMPOSITION OF PERSONAL LOANS
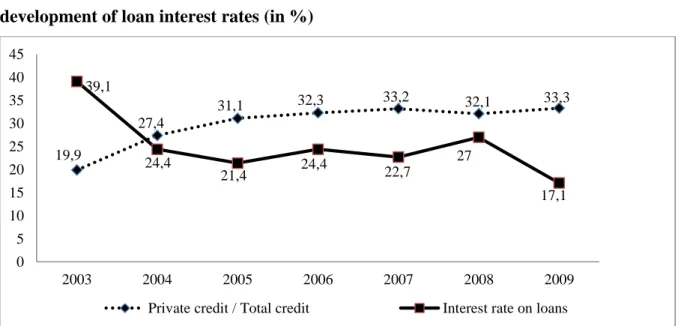
Personal loans made up 13.8% (BDDK, 2006a: 36 (Tablo 2.1-5)) of total loans in 2002, 19.9% in 2003, 33.2% in 2007, and finally 33.3% in 2009 (Figure 3). These figures prove the rising credit consumption of private households and at the same time the growing consumer demand for private loans. It may be assumed that such a situation has been particularly enabled and forwarded as a result of the improved economic situation that Turkey experiences since 2003 (Schuss, 2007), mainly when economic growth and inflation are concerned (Figure 1).
In addition, this situation has been promoted by the falling interest rate on loans from 2003 until 2009 with the sole exception of 2008 (Figure 3). The situation in 2008 with regard to interest rates on loans might be explained as a reaction of Turkish banks to the global crisis that caused a severely volatile situation both in the international arena and also in Turkey.
Once the percentage of personal loans to the total credit volume of the complete sector (Figure 3) and its absolute values (Figure 2) for the years from 2002 to 2009 are illustrated, the next step will be to examine the composition of personal loans for the period of 2003-2009.
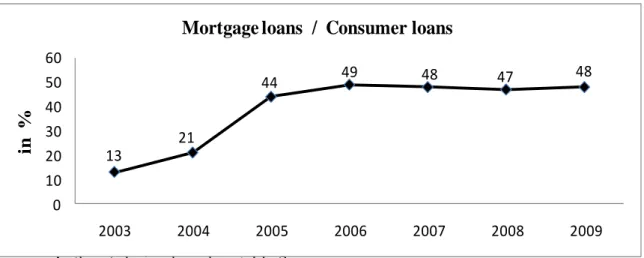
When considering the components of personal loans, it is not possible to miss the fact that mortgage loans had increased extremely in the period of 2002-2007, rising 249% from 2003 to 2004 and 393% from 2004 to 2005. Although in the following years mortgage loans increased to a lesser extent. From 2005 to 2006 there had been an increase of 71%, while from 2006 to 2007 the increase amounted to 68% (Table 3). However, a decline had been observed from 2007 to 2008 in terms of U.S. dollars due to the weakness of the Turkish currency in comparison to the U.S. dollar as of 2008. Mortgage loans amounted to 32,448 mill. TL in 2007 and 39,278 mill. TL in 2008 (BDDK, 2009: 43 (Tablo 2.3-7)). Thus, in Turkish currency terms a sharp growth of 21% from 2007 to 2008 can be detected.
Figure 3: Development of the ratio of personal loans to total credits and development of loan interest rates (in %)
Source: Authors„ design based on BDDK, 2006a: 36, BDDK, 2006b: 42 and BDDK, 2009: 38 and 39
Table 3: Composition of personal loans (in mill. U.S. dollars)
2003 2004 2005 2006 2007 2008 2009 Consumer credit 4,178 9,529 21,957 33,846 58,550 54,685 62,263 • mortgage loans 564 1,969 9,716 16,631 27,989 25,811 30,015 • automobile loans 1,282 3,139 4,804 4,739 5,308 3,634 2,921 • consumer goods n. k.6 4,181 6,495 11,183 22,307 21,820 25,614 • others 2,332 240 942 1,293 2,945 3,420 3,713 Credit cards 5,047 10,419 12,863 15,314 23,379 22,493 24,520
Total personal loans 9,225 19,948 34,820 49,160 81,929 77,178 86,783
Source: Authors„ design based on BDDK, 2004b: 48 and BDDK, 2009: 437
6 Not known.
7 These values in Turkish currency are converted with exchange rate of 31th December of each particular year, see TCMB. 19,9 27,4 31,1 32,3 33,2 32,1 33,3 39,1 24,4 21,4 24,4 22,7 27 17,1 0 5 10 15 20 25 30 35 40 45 2003 2004 2005 2006 2007 2008 2009
5.1 Mortgage loans
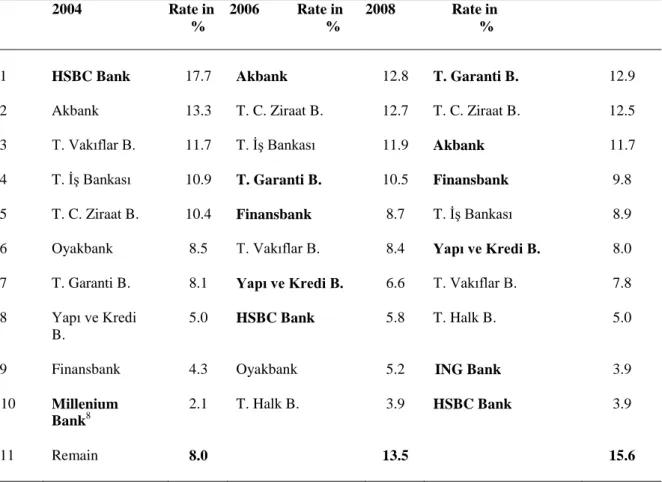
According to Table 3 it can easily be inferred that mortgage credit is becoming more important (Figure 4). It is obvious that there was a great change in the mortgage business between 2004 and 2006. Also, it should not be ignored that mortgage loan volume had increased more than 53 times in the period between 2003 and 2009 (Table 3). As can be seen in Table 1, banks with a co-owner made up a substantial proportion of the mortgage market. While six of the ten leading banks had a foreign co-partner in 2008 , there were just two banks with foreign co-partners in 2004 (Table 4). This development may be due to the growing role of foreign banks starting from 2005 (Table 1).
Figure 4: Share of mortgage loans in consumer loans
Source : Authors„ design based on table 3
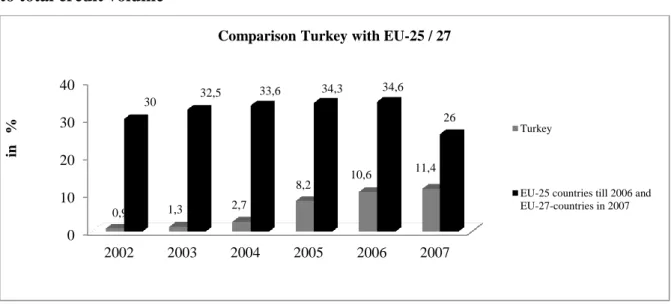
First of all, it is essential to have an overview of this business field in order to find out how intensively the market segment of mortgage business had been dealt with. For this purpose, Turkish mortgage credit values are compared with the EU-25 countries (Figure 5). For the years 2003 to 2006, the values of EU-25 countries are used. However, the values since 2007 of the enlarged EU-27 serve as the basis for the calculation. By analyzing available data, an intensified market cultivation of this segment can be observed since 2003. Mortgage loans, however, take an eminent position within the total credit volume in EU countries. In 2007, mortgage loans made up 26% of total credit volume in the EU-27 countries, a lower percentage than in previous years attributed to the accession of the two new member states Bulgaria and Romania (Figure 5). It is evident that the new members have a less developed banking sector. 13 21 44 49 48 47 48 0 10 20 30 40 50 60 2003 2004 2005 2006 2007 2008 2009 in %
Figure 5: Comparison between Turkey and the EU in terms of ratio of mortgage loans to total credit volume
Source: Authors„ design based on TCMB, 2006: 69, TCMB, 2007: 43 and TCMB, 2008: 50
However, the development of mortgage loans in Turkey can not to be underestimated, as it rose from 1.2% of the total credit volume in 2001 up to 11.4% in 2007 (Figure 5). The maximum refund time of mortgage loans amounted to only 5 years in the period of 2004-2007 in Turkey, whereas in the U.S., the Netherlands, and Denmark it was 30 years, in Germany it was 25-30 years, and in Italy, Spain, and France it was 15 years (BDDK, 2008a: 17 (Tablo 1.3-3)). Therefore, the shorter duration or maturity of mortgage loans is also a barrier that can partially justify Turkish citizens‟ unwillingness to borrow money for financing mortgages compared with EU-25 countries‟ consumers.
From these findings it can be deduced that borrowing had primarily been used for real estate or consumer goods acquisition. In contrast, credit cards had been less used to finance consumption (Table 3). The developments described for the above mentioned period demonstrate that confidence of both individuals and companies in the Turkish economy had been strengthened. 0 10 20 30 40 2002 2003 2004 2005 2006 2007 0,9 1,3 2,7 8,2 10,6 11,4 30 32,5 33,6 34,3 34,6 26 in %
Comparison Turkey with EU-25 / 27
Turkey
EU-25 countries till 2006 and EU-27-countries in 2007
Table 4: Percentage distribution of mortgage loans among top ten banks
2004 Rate in 2006 Rate in 2008 Rate in
% % %
1 HSBC Bank 17.7 Akbank 12.8 T. Garanti B. 12.9
2 Akbank 13.3 T. C. Ziraat B. 12.7 T. C. Ziraat B. 12.5 3 T. Vakıflar B. 11.7 T. İş Bankası 11.9 Akbank 11.7 4 T. İş Bankası 10.9 T. Garanti B. 10.5 Finansbank 9.8 5 T. C. Ziraat B. 10.4 Finansbank 8.7 T. İş Bankası 8.9 6 Oyakbank 8.5 T. Vakıflar B. 8.4 Yapı ve Kredi B. 8.0 7 T. Garanti B. 8.1 Yapı ve Kredi B. 6.6 T. Vakıflar B. 7.8 8 Yapı ve Kredi
B.
5.0 HSBC Bank 5.8 T. Halk B. 5.0
9 Finansbank 4.3 Oyakbank 5.2 ING Bank 3.9
10 Millenium
Bank8
2.1 T. Halk B. 3.9 HSBC Bank 3.9
11 Remain 8.0 13.5 15.6
Source: BDDK, 2007: 44 and BDDK, 2008c: 42
5.2 Borrowing via credit cards
Credit volume caused by the use of credit cards had been significantly raised in the indicated period. In 2008 this amount decreased because of the exchange rate, reaching 22,493 mill. U.S. dollars (Table 3). Total borrowing in Turkish currency was as follows: it amounted to 27,103 mill. TL in 2007 while reaching 34,230 mill. TL in 2008. Therefore, there is no apparent decline of credit volume via credit cards in Turkish currency (BDDK, 2009: 43 (Tablo 2.3-7)). On the contrary, there was an obvious strong growth of 26% in Turkish currency. Furthermore, it can easily be said that the borrowing volume via credit cards had increased almost five times in the period of 2003-2009 (Table 3).
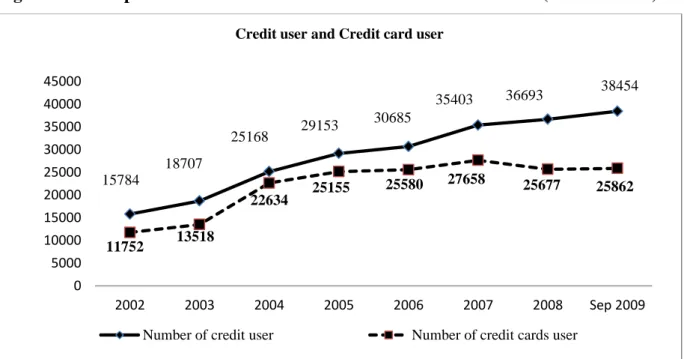
The steady increase in the number of borrowers in connection with credits is conspicuous in this context is there were 15.8 mill. customers of such products in 2002 while in September 2009 already 38.5 mill. clients asked for a loan (Figure 6). Besides, it can be observed that the number of credit card users increased much more than twice between 2002 and 2007. There
8 It is 100% a foreign bank and at the same time a subsidiary of Millennium BCP based in Portugal. It was founded as „BankEuropa A.Ş‟ in
were 11.8 mill. credit card users in 2002 while 27.7 mill. customers used credit cards in 2007. However, this number regressed to 25.7 mill. in 2008 (Figure 6). Such a development starting from 2002 to 2007 reflects growing confidence of private households in the Turkish economy. The decline observed in 2008 may be caused by the insecure economic situation due to the global financial crisis. However in 2009 the number of credit card users gradually started to improve again (Figure 6).
Figure 6: Development of number of credit users and credit card users (in Thousands)
Source: Authors„ design based on BDDK, 2006b: 27 and BDDK, 2009: 26
The percentage of non-performing loans within the entire credit volume had shown a sharp decline from 2002 till 2007 (Figure 7). This downward tendency demonstrates that improved risk management had been applied in the mentioned period and also the economic situation of the debtors had improved. It is also fair to assume that the improved per capita income in the observation period, especially in big cities like Istanbul, helped attainment of lower percentage values in terms of non-performing loans within the total credit volume. However, there was a change regarding non-performing loans in the year the global financial crisis‟ effects started to be felt in Turkey (Figure 7). At this point, it should be remembered that the Turkish economy grew only 0.7% in 2008 while shrinking by almost 5% in 2009 (Figure 1).
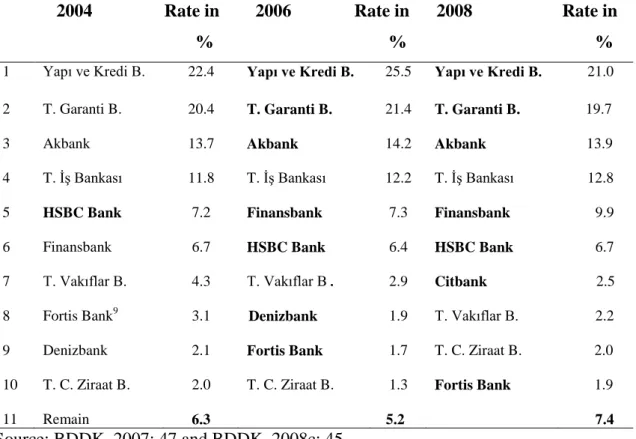
Table 5 indicates percentage values concerning borrowing via credit cards of the ten most important banks which dominate the entire banking sector up to 92.6% in 2008. It is evident
15784 18707 25168 29153 30685 35403 36693 38454 11752 13518 22634 25155 25580 27658 25677 25862 0 5000 10000 15000 20000 25000 30000 35000 40000 45000 2002 2003 2004 2005 2006 2007 2008 Sep 2009
Credit user and Credit card user
that banks with foreign co-owners have been particularly active in this business field since 2006. Seven of the top ten banks had foreign co-partners in 2008, whereas in 2004 there was only one bank among the top ten banks that had foreign co-partner (Table 5).
Table 5: Percentage distribution of credits via credit cards among the top ten banks 2004 Rate in 2006 Rate in 2008 Rate in % % % 1 Yapı ve Kredi B. 22.4 Yapı ve Kredi B. 25.5 Yapı ve Kredi B. 21.0 2 T. Garanti B. 20.4 T. Garanti B. 21.4 T. Garanti B. 19.7
3 Akbank 13.7 Akbank 14.2 Akbank 13.9
4 T. İş Bankası 11.8 T. İş Bankası 12.2 T. İş Bankası 12.8
5 HSBC Bank 7.2 Finansbank 7.3 Finansbank 9.9
6 Finansbank 6.7 HSBC Bank 6.4 HSBC Bank 6.7
7 8 T. Vakıflar B. Fortis Bank9 4.3 3.1 T. Vakıflar B . Denizbank 2.9 1.9 Citbank T. Vakıflar B. 2.5 2.2 9 Denizbank 2.1 Fortis Bank 1.7 T. C. Ziraat B. 2.0 10 T. C. Ziraat B. 2.0 T. C. Ziraat B. 1.3 Fortis Bank 1.9 11 Remain 6.3 5.2 7.4 Source: BDDK, 2007: 47 and BDDK, 2008c: 45
Figure 7: Development of the ratio of non-performing loans to total credit volume
Source: Authors„ design based on BDDK, 2006b: 38 and BDDK, 2009: 38
9 Fortis is not considered as a foreign bank; see TBB (as of 31 December 2004). 17,6 11,5 6,0 4,8 3,8 3,5 3,6 5,3 0 5 10 15 20 2002 2003 2004 2005 2006 2007 2008 2009 in %
6. SUMMARY AND CONCLUSIONS
It can be easily noticed that in the period of 2002-2009 there had been a constant growth of private loans. In particular, there had been a sharp increase recorded in the mortgage loans and borrowing via credit cards had gone similarly up even if not in the same intensity. Positive economic indicators like economic growth, decreasing inflation, increasing foreign exchange reserves, growing revenues from privatization, and expanding foreign trade volume had certainly supported the growth of personal loans in Turkey in that period. Obviously, the proportion of mortgage loans granted in Turkey compared to EU-25 countries had not developed much, although the mortgage segment in Turkey had strongly grown since 2002. However, above all, the shorter duration of mortgage loans is a significant obstacle that explains why demand for this product is much lower than in EU-25 countries. A comparison between Turkey and EU-25 countries in terms of the ratio of mortgage loans to total credit volume gives a clear overview and provides a better understanding of this market segment. In this business field foreign banks have been increasingly gaining importance since 2005, simultaneously becoming more involved in granting credits. This trend illustrates their growing role in the Turkish banking sector.
Moreover, from the above described data it may be derived that the Turkish banking sector has perceived its mediator role more effectively after 2005. On the basis of previous developments in the market segments which have been preferred by foreign banks, it is obvious that these business fields still have a high potential especially when compared with the EU-25/27 countries. One particularly pleasing result of the study was the perceived falling trend in non-performing loans within the total credit volume, which points out improved risk management. But, the change in 2008 concerning non-performing loans made it clear that Turkey was also affected by the global crisis in a much less threatening way than other countries. As proven by U.S. mortgage crisis risk management plays a crucial role in approving loans. Therefore, analysis of the financial standing is of great significance. For this reason, personal and economic circumstances of the debtor have to be investigated accurately. Furthermore, supervisory authorities may play a major role in controlling these financial institutes so that the problems now faced by the U.S. do not occur in Turkey.
Literature cited
1. BDDK (2001), Finansal Piyasalar Raporu (Eylül 2001). 2. BDDK (2004a), Finansal Piyasalar Raporu (Şubat 2004).
3. BDDK (2004b), Finansal Piyasalar Raporu (Ekim 2004).
4. BDDK (2006a), Finansal Piyasalar Raporu (Mart - Haziran 2006). 5. BDDK (2006b), Finansal Piyasalar Raporu (Eylül 2006).
6. BDDK (2006c), Finansal Piyasalar Raporu (Aralık 2006). 7. BDDK (2006d), Bankacılıkta Yapısal Gelişmeler 2006. 8. BDDK (2007a), Finansal Piyasalar Raporu (Aralık 2007). 9. BDDK (2007b), Bankacılıkta Yapısal Gelişmeler 2007. 10. BDDK (2008a), Finansal Piyasalar Raporu (Mart 2008). 11. BDDK (2008b), Finansal Piyasalar Raporu (Eylül 2008). 12. BDDK (2008c), Bankacılıkta Yapısal Gelişmeler 2008. 13. BDDK (2008d), Financial Markets Report (March 2008). 14. BDDK (2009), Finansal Piyasalar Raporu (Aralık 2009). 15. BDDK (2010), Finansal Piyasalar Raporu (Mart 2010). 16. Fortis (2011), Biz kimiz?, 07.06.2011.
17. Gräf, Bernhard (2008), „Die internationale Finanzkrise: Bedrohung für die globale Wirtschaft – Wie alles begann‚, http://www.dbresearch.de, 07.06.2011.
18. HM (2008), FDI in Turkey Tables (2008 March).xls. 19. HM (2011), FDI in Turkey Tables (2011 January).xls. 20. HSBC Türkiye (2011), HSBC Türkiye, 06.06.2011. 21. Millenium Bank (2011), Kurumsal Tanıtım, 08.06.2011. 22. ÖİB (2009), Faaliyet Raporları.
23. Rudolph, Bernd (2009), „Die internationale Finanzkrise: Ursachen, Treiber, Veränderungsbedarf und Reformansätze', http://epub.ub.uni-muenchen.de/10964, 10.06.2011.
24. Schuss, Heiko (2008): „Vergleich institutionenökonomischer und
kulturwissenschaftlicher Ansätze zur Erklärung der wirtschaftlichen Entwicklung in der Türkei und dem Osmanischen Reich‚, Berlin.
25. TBB (2011a), Bankalar, 10.06.2011.
26. TBB (2011b), 52.year-1.statistics, 11.06.2011.
27. TCMB (2006), Financial Stability Report - June 2006, Volume 2. 28. TCMB (2007), Financial Stability Report - November 2007, Volume 5. 29. TCMB (2008), Financial Stability Report - November 2008, Volume 7. 30. TCMB (2011), Indicative Exchange Rates.
31. TUIK (2008), Gayri Safi Yurtiçi Hasıla, 10.06.2011.
33. TUIK (2010), Gayri Safi Yurtiçi Hasıla, 10.06.2011.
34. Türkiye Garanti Bankası (2010), Doğuş Grubu ve General Electric, Garanti Bankası'nda ortaklık için kesin anlaşmaya vardı, 09.06.2011.