23
Efficiency of Double Inversion Recovery (DIR)
Sequence in the Evaluation of Supratentorial
Cortical Lesions in Multiple Sclerosis
Gulhan Ertan1*, Ozge Arici2, Sila Ulus3, Baris Metin4
ABSTRACT
The aim of this study is to investigate if the three–dimensional (3D) double inversion recovery (DIR) sequence is superior compared to the 3D fluid–attenuated inversion–recovery (FLAIR) sequence in detecting intracortical, mixed, juxtacortical (JX), and deep grey matter (GM) lesions in multiple sclerosis (MS) patients. The correlation between intracortical lesion load and disability status was also investigated. Magnetic resonance imaging examinations of 24 patients (9 males, 15 females; mean age 34.4±12.0 (16-69) were retrospectively evaluated from our database. Lesions were counted and classified according to anatomic regions as intracortical, mixed, JX, and deep GM on the 3D DIR and FLAIR sequences. The incidence of lesions on the two sequences were identified and compared. The relationship between the number of lesions and type of MS, patient age, gender, duration of the disease, disability, the mean number of attacks per year and Expanded Disability Status Scale (EDSS) score was also investigated. More lesions were detected by the DIR sequence compared to the FLAIR sequence in all regions except for thalamus (11/12). The lesion detection superiority of DIR was statistically significant for intracortical lesions (p<0.001) and GM lesions (intracortical +mixed) (p<0.001). Lesion load of the JX area in the DIR sequence decreased as the disease duration (r=-0.444; p=0.030) and age (r=-0.473; p=0.020) increased. JX lesion load in the DIR sequence decreased as the number of attacks increased (r=-0.602; p=0.002). More mixed lesion load on the DIR sequence were found in cerebral atrophy group than in no cerebral atrophy group (p=0.026). EDSS score increased as the disease duration and number of attacks increased (p=0.003, p<0.001). There was no correlation between lesion location and EDSS score. The DIR sequence is superior to the FLAIR sequence in the detection of intracortical and GM lesions. Also, the mixed lesion load on the DIR sequence is correlated with cerebral atrophy.
Key Words: Multiple Sclerosis, Magnetic Resonance Imaging (MRI), Double Inversion Recovery (DIR) Sequence,
Fluid–attenuated Inversion–recovery (FLAIR) Sequence, Cortical Lesion
DOI Number: 10.14704/nq.2018.16.3.1179 NeuroQuantology 2018; 16(3):23-29
Introduction
Multiple sclerosis (MS) is a chronic inflammatory demyelinating disease of the central nervous system (CNS). Primarily involvement of the white matter (WM) is well known, however some recent histopathological and radiological studies have shown that cortical involvement occurs in MS patients as well (Calabrese et al., 2007, Honce
et al., 2013, Geurts et al., 2005, Seewann et al., 2012, Sethi et al., 2013). Actually cortical lesions may even appear before the classical WM lesions and therefore detection of these lesions are very important for diagnosis (Popescu et al., 2011). Cortical lesions are also correlated to general disability and cognitive impairment. Harrison et al., reported that cortical lesion load is related to
Corresponding author: Gulhan Ertan
Address: 1Medipol University Mega Hospitals Complex, Department of Radiology, Istanbul Turkey;2 Medipol University Mega Hospitals Complex, Department of Neurology, Istanbul Turkey; 3 Acibadem Mehmet Ali Aydinlar University School of Medicine, Department of Radiology, Istanbul Turkey; 4 Uskudar University School of Medicine, Department of Neurology, Istanbul Turkey
e-mail ertan.akan @medipol.com.tr
Relevant conflicts of interest/financial disclosures: The authors declare that the research was conducted in the absence of any
commercial or financial relationships that could be construed as a potential conflict of interest.
24 cognitive impairment and EDSS scores (Harrison
et al., 2015). Interestingly a recent revision to McDonald criteria recognized cortical lesions as an evidence for dissemination in time. However this modification also prompted the importance of detecting cortical lesions effectively. The success of conventional magnetic resonance imaging (MRI) sequences is limited in detecting cortical lesions. Fluid–attenuated inversion– recovery (FLAIR) sequence is the most common sequence used for imaging of MS patients. Although the FLAIR sequence detects cortical and subcortical WM lesions better than the other sequences, this sequence cannot differentiate the exact anatomical border between the cortex and the subcortical WM clearly (Geurts et al., 2005). Double inversion recovery (DIR) is a relatively new sequence. This sequence requires, as the name implies, double inversion sequences for suppressing cerebrospinal fluid (CSF) and WM simultaneously using a combination of two inversion pulses (T1 and T2). Thus, the sequence significantly increases lesion conspicuity in both grey and WM (Bedell et al., 1998).
Despite DIR sequence has been used in several studies to detect CLs (Calabrese et al., 2009, Geurts et al., 2011, Kolber et al., 2015) the superiority of DIR to FLAIR is not clearly
established and Kolber et al., did not report any difference between the two sequences in detecting CLs. DIR is a time-consuming sequence and has a high tissue absorption rate. Based on such disadvantages over FLAIR, one might think that its routine use in MS neuroimaging may not be justified (Geurts et al., 2011). The aim of this study is to investigate whether or not the three– dimensional (3D) DIR sequence is superior compared to the 3D FLAIR sequence in detecting intracortical, mixed, juxtacortical, and deep GM lesions in MS patients. We also investigated the correlation between intracortical lesion load and disability status in these patients.
Methods
Patients
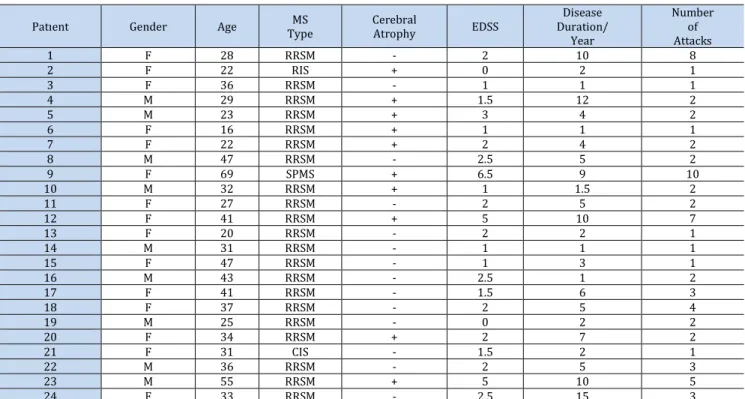
In this IRB-approved study, MRI examinations including 3D DIR and 3D FLAIR sequences of 24 patients (9 males, 15 females; mean age 34.4±12.0 (16-69) were retrospectively evaluated from our database between January 2014 and June 2017. 21 patients had relapsing remitting MS (RRMS) with MS according to the McDonald criteria, 1 patient had radiologically isolated syndrome (RIS), 1 patient had clinically isolated syndrome (CIS), and 1 patient had Table 1. Patient demographics and clinical status
Patıent Gender Age Type MS Cerebral Atrophy EDSS
Disease Duration/ Year Number of Attacks 1 F 28 RRSM - 2 10 8 2 F 22 RIS + 0 2 1 3 F 36 RRSM - 1 1 1 4 M 29 RRSM + 1.5 12 2 5 M 23 RRSM + 3 4 2 6 F 16 RRSM + 1 1 1 7 F 22 RRSM + 2 4 2 8 M 47 RRSM - 2.5 5 2 9 F 69 SPMS + 6.5 9 10 10 M 32 RRSM + 1 1.5 2 11 F 27 RRSM - 2 5 2 12 F 41 RRSM + 5 10 7 13 F 20 RRSM - 2 2 1 14 M 31 RRSM - 1 1 1 15 F 47 RRSM - 1 3 1 16 M 43 RRSM - 2.5 1 2 17 F 41 RRSM - 1.5 6 3 18 F 37 RRSM - 2 5 4 19 M 25 RRSM - 0 2 2 20 F 34 RRSM + 2 7 2 21 F 31 CIS - 1.5 2 1 22 M 36 RRSM - 2 5 3 23 M 55 RRSM + 5 10 5 24 F 33 RRSM - 2.5 15 3
Abbreviations: MS, multiple sclerosis; EDSS, Expanded Disability Status Scale; F, female; M, male; RRSM, relapsing remitting MS; RIS, radiologically isolated syndrome; SPMS, secondary progressive MS; CIS, clinically isolated syndrome
25 secondary progressive MS (SPMS). Disease
disability was evaluated by using EDSS (Expanded Disability Status Scale). Median Expanded Disability Status Scale (EDSS) at the time of scanning was 2.1 (0-6.5) and median duration of disease from the onset of symptoms was 5 years (range 1-15 years). In all patients; annual relapse rate was 1.9 (range 0.5-6). Patient demographics and clinical status are summarized in Table 1. The patients were not evaluated for cognitive status, but clinically all of the patients had cognitive complaints as forgetfulness.
MRI Acquisition
DIR and FLAIR scans were acquired on a 3T Achieva TX system (Philips healthcare, The Netherlands) with an 8 channel coil. Axial DIR was performed by using two different inversion pulses. The details of the DIR protocol were as follows: field of view, 250 mm: matrix, 208x207; slice thickness, 1 mm; no intersection gap; no parallel imaging; repetition time (TR) 5500 msec/ echo time (TE) 250 msec, long inversion time, 2600 msec; short inversion time, 625 msec; number of signals acquired, 2; and acquisition time, 5 minutes 46 seconds. FLAIR sequences were matrix, 224x224; field of view, 280 mm: slice thickness, 1 mm; no intersection gap; TR 4800 msec/TE 274 msec, inversion time, 1650 msec; number of signals acquired, 2 and acquisition time, 4 minutes 52 seconds (3).
Image Analysis
Lesions were counted and classified according to anatomic regions as intracortical (only involving GM), mixed (involving GM and extending into the adjacent WM), and juxtacortical (WM lesions abutting but not entering the cortex) on the 3D DIR and FLAIR sequences. Lesions involving the deep GM were also counted separately. The incidence of cortical GM lesions on the FLAIR and DIR sequences were independently identified and compared. The relationship between the number of intracortical, mixed, juxtacortical, deep GM lesions and type of MS, patient age, gender, duration of the disease, disability, the mean number of attacks per year and EDSS score was also investigated.
Statistical Analysis
• Distribution of data was investigated with the Shapiro-Wilk test.
• The incidence of the cortical, juxtacortical, mixed, and deep GM lesions on the FLAIR and DIR
sequences were compared with Wilcoxon signed-rank test.
• Mann-Whitney U test was used to assess the comparison of lesion count between groups. Spearman's rho was used to evaluate the correlation between measurements.
• McNemar test was used to assess the correlation between DIR and FLAIR sequences regarding lesion detection.
• SPSS (Statistical Package for the Social Sciences) v.22 (Kaysville, Utah, USA) program was used for statistical analysis. Significance was evaluated as p<0.05 levels.
Results
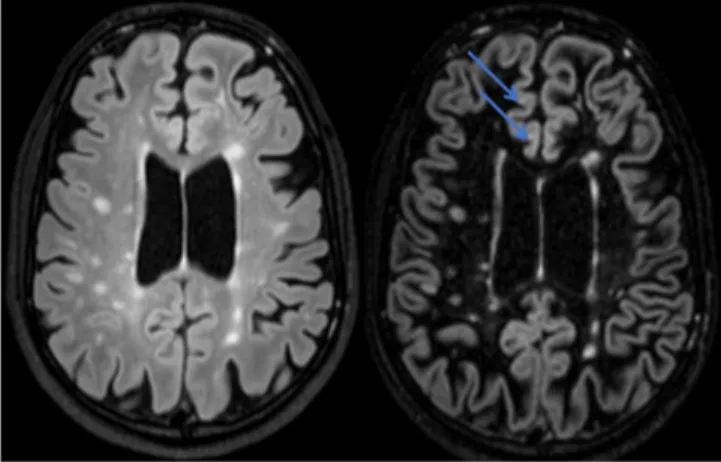
More lesions were detected by the DIR sequence compared to the FLAIR sequence in all regions except for thalamus (11/12). The lesion detection superiority of DIR was statistically significant for intracortical lesions (p<0.001) and GM lesions (intracortical +mixed) (p<0.001). Also, it was close to statistically significant for the mixed lesions (p=0.07). There was no statistically significant difference between lesion detection capability of the two sequences in juxtacortical areas and deep GM lesions (Fig.1, 2).
Figure 1. Axial FLAIR (left) and DIR (right) sequences; the
intracortical lesions (arrows) seen on the DIR sequence are not visualized on the FLAIR sequence
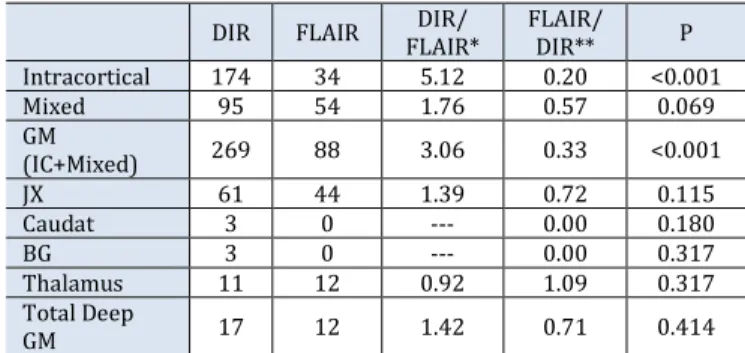
The number of lesions detected by the DIR and FLAIR sequences in all regions, the ratio of the number of lesions detected by the DIR sequence compared to the FLAIR sequence, and the percentage of lesions detected by the FLAIR sequence compared to the DIR sequence are summarized in Table 2.
26 Figure 2. Axial FLAIR (left) and DIR (right) sequences; the plaques
(top arrow) seen on the FLAIR sequence is seen as adjacent to the cortex, however it is located subcortical in the DIR sequence. The lesion (bottom arrow) seen on the FLAIR sequence is seen as juxtacortical, however it is located completely intracortical in the DIR sequence
Table 2. The number of lesions detected by the DIR and FLAIR
sequences in all regions
DIR FLAIR FLAIR* DIR/ FLAIR/ DIR** P Intracortical 174 34 5.12 0.20 <0.001 Mixed 95 54 1.76 0.57 0.069 GM (IC+Mixed) 269 88 3.06 0.33 <0.001 JX 61 44 1.39 0.72 0.115 Caudat 3 0 --- 0.00 0.180 BG 3 0 --- 0.00 0.317 Thalamus 11 12 0.92 1.09 0.317 Total Deep GM 17 12 1.42 0.71 0.414
Abbreviations: Double inversion recovery, DIR; Fluid–attenuated inversion–recovery, FLAIR; GM, grey matter; IC, intracortical; JX, juxtacortical; BG, basal ganglia; *, ratio of the number of lesions detected by the DIR sequence compared to the FLAIR sequence; **, percentage of lesions detected by the FLAIR sequence compared to the DIR sequence
Table 3. Concordance between DIR and FLAIR for lesion detection
DIR (%) FLAIR (%) DIR/ FLAIR* (%) FLAIR/ DIR** (%) p Intracortical (83.3) 20 (50.0) 12 10/12 (83.3) 10/20 (50.0) 0.039 Mixed (70.8) 17 (50.0) 12 (83.3) 10/12 (58.8) 10/17 0.180 GM (IC+mixed) 24 (100) 16 (66.7) 16/16 (100) 16/24 (66.7) --- JX (75.0) 18 (66.7) 16 (87.5) 14/16 (77.8 ) 14/18 0.687 Caudat (8.3) 2 (0.0) 0 --- (0.0) 0/2 --- BG (4.2 ) 1 (0.0) 0 --- (0.0) 0/1 --- Thalamus (25.0 ) 6 (29.2) 7 (85.7) 6/7 (100 ) 6/6 1.000 Total Deep GM 6 (25.0 ) 7 (29.2) 6/7 (85.7) 6/6 (100) 1.000 Abbreviations: Double inversion recovery, DIR; Fluid–attenuated inversion–recovery, FLAIR; GM, grey matter; IC, intracortical; JX, juxtacortical; BG, basal ganglia; *, ratio of the number of lesions detected by the DIR sequence compared to the FLAIR sequence; **, percentage of lesions detected by the FLAIR sequence compared to the DIR sequence
Table 3 summarizes the number of patients in which at least one lesion was detected by the two sequences, the percentage of number of lesions DIR detected when FLAIR detected at least one lesion, and the percentage of number of lesions FLAIR detected when DIR detected at least one lesion. Discordance was found only for the intracortical lesions. DIR was able to reveal at least one lesion in 83.3 % of the patients in which FLAIR detected at least one lesion, while FLAIR was able to reveal at least one lesion in 50.0 % of patients in which DIR detected at least one lesion. There was inverse and weak correlation (r=-0.444; p=0.030) between disease duration and lesion load in the DIR sequence for JX area. Lesion load of the JX area in the DIR sequence decreased as the disease duration increased.
There was inverse and weak correlation between age and JX_DIR (r=-0.460; p=0.024) and JX_FLAIR (r=-0.473; p=0.020). The number of JX lesions decreased as the age increased.
There was inverse and moderate correlation between the number of attacks and JX_DIR (r=-0.602; p=0.002). JX lesion load in the DIR sequence decreased as the number of attacks increased significantly. No correlation was found for patients with higher cortical lesion load.
Cerebral atrophy was detected in 10/24 patients. More mixed lesion load on the DIR sequence were found in cerebral atrophy group than in no cerebral atrophy group (p=0.026).
There was a positive moderate correlation between EDSS score and disease duration (r=0.585; p=0.003), and number of attacks (r=0.711; p<0.001). EDSS score increased as the disease duration increased, and number of attacks in the same way. However, there was no correlation between lesion location and EDSS score.
The cerebral function score for EDSS in each patient was at least 1, and showed that the mental function was not normal for each patient.
Discussion
Conventional MRI sequences are unsuccessful in the detection of cortical lesions. However, previous MRI studies have shown increased cortical and subcortical lesion detection by using two–dimensional (2D) and 3D FLAIR imaging. Yet these sequences could not differentiate the exact anatomical border between the cortex and subcortical WM clearly (Bakshi et al., 2001; Geurts et al., 2005; Lazeron et al., 2000; Moriarty
27 et al., 1999; Tan et al., 2002; Tubridy et al., 1998;
Vural et al., 2013). More recently, DIR sequences have been used to improve the sensitivity of MRI further in detecting cortical lesions. This technique simultaneously suppresses WM and CSF signals, using a combination of two inversion pulses. Thus, the contrast is due to the differences of T1 relaxation times between GM and CSF, as well as between grey and WM. The increased contrast between lesions and their surroundings provides visibility of cortical lesions (Bedell et al., 1998). Some of the studies are based on 2D pulse sequences that have poor signal–to-noise ratio (SNR) and flow and pulsation artifacts. 3D DIR sequences allowing the acquisition of high resolution imaging with isotropic voxels and reducing flow artifacts might further increase the lesion count of cortical lesions (Geurts et al., 2005).
In this study our main goal was to compare the cortical lesion detection power of a newer MR sequence (DIR) with the 3D FLAIR sequence in MS patients. Our secondary goal was to analyze the correlation between cortical lesion load and disability.
Previous studies examined intracortical lesions of MS and reported contradictory findings. Geurts et al. found a higher number of intracortical lesions with the DIR sequence than the FLAIR sequence (Geurts et al., 2005). Vural et al. also reported similar results (Vural et al., 2013). We also found that the DIR sequence was superior to the FLAIR sequence in detecting intracortical lesions. Results of our study revealed that the 3D DIR sequence depicted intracortical lesions five times more than the 3D FLAIR sequence. These findings are consistent with previous studies (Geurts et al., 2005). In addition, Kolber et al. and Moraal et al. reported that the number of intracortical lesions detected using both DIR and FLAIR sequences was significantly higher, but they did not find a significant difference between the DIR and FLAIR sequences (Kolber et al., 2015; Moraal et al., 2008).
Our results regarding the relationship between CLs and other patient characteristics are also worthy of discussion. Calabrese et al. found a significant association between intracortical lesions and male gender (Calabrese et al., 2007). However we did not find a gender effect on the number of CLs. This study also examined intracortical lesions in MS patients with DIR sequences and the frequency of intracortical lesion presence among the MS types. They found
that the number of intracortical lesions was higher in patients with secondary progressive MS (SPMS), but in our study comparison between the MS types was not done due to the majority of the patients being relapsing-remitting MS (RRMS).
Some of the previous studies found a positive correlation between the number of intracortical lesions and EDDS scores which is an indicator for disability (Calabrese et al., 2007; Calabrase et al., 2010; Mainero et al., 2015). In our study, EDSS scores were higher in patients with long disease duration and more number of intracortical lesions. However, no correlation was found between lesion load and the EDSS scores in all regions. The reason for this could be that all patients included in the study had CL. Comparison with a CL negative group could identify the disability status better.
Besides intracortical lesions we also counted juxtacortical lesions. Some of the previous studies detected more JX lesions on the FLAIR sequence compared to the DIR sequence. Vural et al. reported a higher number of juxtacortical lesions with the FLAIR sequence than the DIR sequence, but no significant difference was found (Vural et al., 2013). Morall et al. also detected more juxtacortical lesions with the FLAIR sequence than the DIR sequence, and similarly no significant difference was found (Moraal et al., 2008). The reason of this may be the initial classification of these lesions as JX lesions on the FLAIR and the DIR sequence due to sharp delineation between the cortex and subcortical WM. Also, these lesions appear as touching the cortical areas on the DIR sequence and they could be categorized as mixed WM-GM lesions. Geurts et al. reported more juxtacortical lesion on the DIR sequence than the FLAIR sequence (Geurts et al., 2005). In our study, we detected 1.76 times more JX lesions on the DIR sequence than the FLAIR sequence, but it was not statistically significant.
Regarding mixed lesions (i.e., GM-WM lesions) Geurts et al., Vural et al., Moraal et al. and Wattjes et al. found the highest number of mixed WM-GM lesions with the DIR sequence compared to the FLAIR sequence (Geurts et al., 2005; Moraal et al., 2008; Vural et al., 2013; Wattjes et al., 2007). In our study, 1.39 times more mixed lesions were detected on the DIR sequence than the FLAIR sequence, and this result was close to being statistically significant (p=0.07).
In contrast to cortical lesions in MS, studies on the detection of deep GM lesions have
28 been limited. A recent pathological study by
Haider et al. have highlighted the significance of the caudate nucleus and hypothalamus as deep GM demyelinating lesions, an intermediate inflammation phenotype between low inflammatory cortical GM lesions and active WM lesions, and pathogenic processes of which include demyelination, neurodegeneration and accumulation of oxidative injury in deep GM pathology. Still cause of deep GM damage and their clinical significance remains unknown (Haider et al., 2014). Geurts et al. found a higher number of deep GM lesions with the DIR sequence than the FLAIR sequence (Geurts et al., 2005). Our study showed that more lesions were detected by the DIR sequence compared to the FLAIR sequence in deep GM regions except for thalamus. We found 1.42 times more deep GM lesions with the DIR sequence compared to the FLAIR sequence, but it was not statistically significant.
In MS patients, brain atrophy begins at disease onset in CIS and progresses throughout the course of the disease. While both GM and WM atrophy can occur, GM atrophy appears predominate. Some of the studies showed that GM atrophy increased progressively, but no change in the rate of WM atrophy was seen over time. These two entities are partially independent (Fisher et al., 2008; Honce et al., 2013). Some of the studies found that GM atrophy was significantly correlated with both physical and cognitive disability in MS (Fisher et al., 2008; Honce et al., 2013; Richard et al., 2009; Seewann et al., 2011). We could not assess the degree of GM and WM atrophy with computer assisted techniques due to the retrospective nature of the study. In our study cerebral global atrophy was present in patients with increased number of cortical lesions as well as in patients with no cortical lesions. However, when the groups with cerebral atrophy and no cerebral atrophy were compared, cerebral global atrophy was more common in patients with more mixed lesion load on the DIR sequence. There was no significant correlation between cortical lesion count and cerebral atrophy.
Disease duration also appears to be an important factor affecting the number of especially the JX lesions. In patients with long disease duration, JX lesion load on the DIR sequence was significantly lower. Also, there was an inverse correlation between age and JX lesion load on the DIR sequence; as age increases JX lesion count decreases. In patients with more attacks, we speculated that JX lesions are
decreasing in the course of the disease since JX lesion load is significantly lower on the DIR sequence.
Our study has some limitations. Most importantly, the patient number is low. Our image analysis of cortical lesions was limited to the classification of pure cortical, mixed and JX lesions. We did not try to classify cortical lesions further according to histopathological cortical lesion-classification. Moreover, advanced cognitive tests were not performed on the patients due to the retrospective nature of this study.
Conclusion
In conclusion, the DIR sequence is superior to the FLAIR sequence in the detection of intracortical and GM (intracortical+mixed) lesions and the mixed lesion load on the DIR sequence is correlated with cerebral atrophy. We also speculate that the JX lesions are decreasing in the course of the disease. We believe that further prospective studies will have a significant contribution to the clinic in explaining cognitive deficits due to GM involvement that may develop during the course of the disease.
References
Bakshi R, Ariyaratana S, Benedict RH, Jacobs L. Fluid-attenuated inversion recovery magnetic resonance imaging detects cortical and juxtacortical multiple sclerosis lesions. Archives of Neurology 2001; 58(5):742-48.
Bedell BJ, Narayana PA. Implementation and evaluation of a new pulse sequence for rapid acquisition of double inversion recovery images for simultaneous suppression of white matter and CSF. Journal of Magnetic Resonance Imaging 1998; 8(3):544-47.
Calabrese M, De Stefano N, Atzori M, Bernardi V, Mattisi I, Barachino L, Morra A, Rinaldi L, Romualdi C, Perini P, Battistin L, Gallo P. Detection of cortical inflammatory lesions by double inversion recovery magnetic resonance imaging in patients with multiple sclerosis. Archives of Neurology 2007; 64(10): 1416–22.
Calabrese M, Gallo P. Magnetic resonance evidence of cortical onset of multiple sclerosis. Multiple Sclerosis 2009; 15(8): 933–41.
Calabrese M, Rocca MA, Atzori M, Mattisi I, Favaretto A, Perini P, Gallo P, Filippi M. A 3-year magnetic resonance imaging study of cortical lesions in relapse-onset multiple sclerosis. Annals of Neurology 2010; 67(3):376-83.
Fisher E, Lee JC, Nakamura K, Rudick RA. Gray matter atrophy in multiple sclerosis: a longitudinal study. Annals of Neurology 2008; 64(3): 255–65.
Haider L, Simeonidou C, Steinberger G, Hametner S, Grigoriadis N, Deretzi G, Kovacs GG, Kutzelnigg A, Lassmann H, Frischer JM. Multiple sclerosis deep grey matter: the relation between. demyelination,
29
neurodegeneration, inflammation and iron. Journal of Neurology, Neurosurgery & Psychiatry 2014; 85(12): 1386-95.
Harrison DM, Roy S, Oh J, Izbudak I, Pham D, Courtney S, Caffo B, Jones CK, Van Zijl P, Calabresi PA. Association of cortical lesion burden on 7-T magnetic resonance imaging with cognition and disability in multiple sclerosis. JAMA Neurology 2015; 72(9):1004-12. Honce JM. Gray matter pathology in MS: neuroimaging and
clinical correlations. Multiple Sclerosis İnternational 2013;2013.: 627870.
Geurts JJG, Pouwels PJW, Uitdehaag BMJ, Polman CH, Barkhof F, Castelijns JA. Intracortical lesions in multiple sclerosis: improved detection with 3D double inversion-recovery MR imaging. Radiology 2005; 236(1): 254–60. Geurts JJ, Roosendaal SD, Calabrese M, Ciccarelli O, Agosta F,
Chard DT, Gass A, Huerga E, Moraal B, Pareto D, Rocca MA. Consensus recommendations for MS cortical lesion scoring using double inversion recovery MRI. Neurology 2011; 76(5):418-24.
Kolber P, Montag S, Fleischer V, Luessi F, Wilting J, Gawehn J, Gröger A, Zipp F. Identification of cortical lesions using DIR and FLAIR in early stages of multiple sclerosis. Journal of Neurology 2015; 262(6):1473-82.
Lazeron RH, Langdon DW, Filippi M, van Waesberghe JH, Stevenson VL, Boringa JB, Origgi D, Thompson AJ, Falautano M, Polman C, Barkhof F. Neuropsychological impairment in multiple sclerosis patients: the role of (juxta) cortical lesion on FLAIR. Multiple Sclerosis Journal 2000; 6(4):280-85.
Mainero C, Louapre C, Govindarajan ST, Giannì C, Nielsen AS, Cohen-Adad J, Sloane J, Kinkel RP. A gradient in cortical pathology in multiple sclerosis by in vivo quantitative 7 T imaging. Brain 2015; 138(4):932-45.
Moraal B, Roosendaal SD, Pouwels PJ, Vrenken H, Van Schijndel RA, Meier DS, Guttmann CR, Geurts JJ, Barkhof F. Multi-contrast, isotropic, single-slab 3D MR imaging in multiple sclerosis. European Radiology 2008; 18(10):2311-20.
Moriarty DM, Blackshaw AJ, Talbot PR, Griffiths HL, Snowden JS, Hillier VF, Capener S, Laitt RD, Jackson A. Memory dysfunction in multiple sclerosis corresponds to juxtacortical lesion load on fast fluid-attenuated
inversion-recovery MR images. American Journal of Neuroradiology 1999; 20(10):1956-62.
Popescu BFG, Bunyan RF, Parisi JE, Ransohoff RM, Lucchinetti CF. A case of multiple sclerosis presenting with inflammatory cortical demyelination. Neurology 2011; 76 (20): 1705–10.
Rudick RA, Lee JC, Nakamura K, Fisher E. Gray matter atrophy correlates with MS disability progression measured with MSFC but not EDSS. Journal of the Neurological Sciences 2009; 282(1):106-11.
Seewann A, Vrenken H, Kooi EJ, van der Valk P, Knol DL, Polman CH, Pouwels PJ, Barkhof F, Geurts JJ. Imaging the tip of the iceberg: visualization of cortical lesions in multiple sclerosis. Multiple Sclerosis Journal 2011; 17(10):1202-10.
Seewann A, Kooi E-J, Roosendaal SD, Roosendaal SD, Pouwels PJ, Wattjes MP, van der Valk P, Barkhof F, Polman CH, Geurts JJ. Postmortem verification of MS cortical lesion detection with 3D DIR. Neurology 2012; 78(5): 302–08. Sethi V, Muhlert N, Ron M, Golay X, Wheeler-Kingshott CA,
Miller DH, Chard DT, Yousry TA. MS cortical lesions on DIR: not quite what they seem? PLoS One 2013; 8(11): e78879.
Tan I, Pouwels P, van Schijndel R, Adèr H, Manoliu R, Barkhof F. Isotropic 3D fast FLAIR imaging of the brain in multiple sclerosis patients: initial experience. European Radiology 2002; 12(3):559-67.
Tubridy N, Barker GJ, Macmanus DG, Moseley IF, Miller DH. Three-dimensional fast fluid attenuated inversion recovery (3D fast FLAIR): a new MRI sequence which increases the detectable cerebral lesion load in multiple sclerosis. The British Journal of Radiology 1998; 71(848):840-45.
Vural G, Keklikoğlu HD, Temel Ş, Deniz O, Ercan K. Comparison of double inversion recovery and conventional magnetic resonance brain imaging in patients with multiple sclerosis and relations with disease disability. The Neuroradiology Journal 2013; 26(2):133-42.
Wattjes MP, Lutterbey GG, Gieseke J, Träber F, Klotz L, Schmidt S, Schild HH. Double inversion recovery brain imaging at 3T: diagnostic value in the detection of multiple sclerosis lesions. American Journal of Neuroradiology 2007;28(1):54-59.