Electronic copy available at: http://ssrn.com/abstract=2369152
ISSN 1450-2275 Issue 26 (2010) © EuroJournals, Inc. 2010 http://www.eurojournals.com
The Long-Run Performance of Initial Public Offerings: The
Case of Turkey
Aysa Ipek Erdogan
Department of Business Administration, Istanbul Arel University, Tepekent, Istanbul, Turkey Tel: +90-212-8600480; Fax: +90-212-8600481
E-mail: [email protected] Abstract
The purpose of this paper is to investigate the long run stock price behavior of initial public offerings (IPOs) in Turkey. Our sample consists of 126 IPOs for the period from 1995 to 2000. We use four different methodologies to analyze the relative performance of IPOs for up to five years after listing. The sample displays evidence of underperformance when we use wealth relatives as a measure of long-run performance. Using equally weighted BHARs as an abnormal performance measure, we find that IPOs significantly underperform the Istanbul Stock Exchange 100 Index after two years, after three years and after five years. Significant underperformance is found for value weighted BHARs after two years and after five years. The sample displays evidence of no underperformance or overperformance when we use cumulative abnormal returns. A calendar-time analysis also provides no evidence of underperformance or overperformance. Eventually, the results show that the performance of IPOs in Turkey depends on the method of return measurement used. Our findings provide support for Fama (1998) who argues that long-term return anomalies can be due to methodology and most anomalies tend to disappear with the use of different methods.
Keywords: Initial Public Offerings, Underperformance, Long-Run Abnormal Returns, Market Efficiency, Istanbul Stock Exchange
JEL Classification Codes: G12, G14, G30
1. Introduction
Academic research on initial public offerings (IPOs) focus on two anomalies which call into question the informational efficiency of the IPO market: initial underpricing and long-run underperformance. Several studies reveal the existence of negative long-run abnormal returns following the IPO. This phenomenon has been reported in both the US and other markets (e.g. Ritter, 1991, Rajan and Servaes, 1997, Carter, Frederick and Singh, 1998, for US; Lee, Taylor and Walter, 1994, for Australia; Aggarwal, Leal and Hernandez, 1993, for Brazil; Levis, 1993, for UK; Goergen and Renneborg, 2003, for Germany and UK; Jaskiewicz, Gonzalez, Menendez and Schiereck, for Spain, 2005). However, there are also studies that find no evidence of long-run underperformance of IPO firms (e.g. Loughran, Ritter and Rydqvist, 1994, for Sweden; Kim, Krinsky and Lee, 1995, for Korea). Studies on Turkish IPOs also find that long-run market adjusted returns are positive (e.g. Kıymaz, 1997; Merey, 1997; Ewing and Öztufan, 2003).
In this study, we investigate the long run stock price behavior of IPOs in Turkey. The aftermarket period includes the 60 months following the IPO. Our sample consists of 126 IPOs for the
Electronic copy available at: http://ssrn.com/abstract=2369152
period from 1995 to 2000. We use four different methodologies to analyze the relative performance of IPOs: Wealth relatives, buy-and-hold abnormal returns, cumulative abnormal returns, and calendar time abnormal returns. The sample displays evidence of underperformance when we use wealth relatives as a measure of long-run performance. When we use equally weighted BHARs, we find that IPOs significantly underperform the Istanbul Stock Exchange (ISE) 100 Index after two years, after three years and after five years. Significant underperformance is found for value weighted BHARs after two years and after five years. Using cumulative abnormal returns as an abnormal performance measure, we find that Turkish IPOs do not significantly underperform or overperform the ISE 100 index. Using the calendar-time returns method, we find that IPOs neither overperform nor underperform. Eventually, the choice of the performance measurement methodology changes our results. Our findings provide support for Fama (1998) who argues that long-term return anomalies can be due to methodology and most anomalies tend to disappear with the use of different methods.
The paper is structured as follows: Evidence on long-run performance of IPOs is presented in section 2. Section 3 describes the data, while section 4 depicts the research methodology. Section 5 discusses the empirical results of the study and section 6 concludes.
2. Literature Review
Several studies examine the long-run performance of IPOs in different markets. Ritter (1991) analyzes the performance of 1526 IPOs issued between 1975 and 1984 in US and reports that IPO firms underperform the market benchmark by about 29% in the three year period after their launch. Rajan and Servaes (1997) show that over a five-year period following their IPO, firms underperform the market benchmark by 17%. Carter et al. (1998) show that over a three-year period after the IPO, US firms underperform the market by 19.92 %.
A number of studies in other countries also demonstrate that long-run market adjusted returns are negative. The degree of underperformance has been 51% in Australia (Lee et al., 1994), 47% in Brazil (Aggarwal et al., 1993) and 23% in UK (Levis, 1993). Goergen and Renneborg (2003) find that over the five years after flotation, the German and UK IPOs underperform the stock market by 14% and 33% respectively. Jaskiewicz et al. (2005) show that three years after going public, Spanish IPO firms realize a negative abnormal return of 36.7%.
Certainly, there are notable exceptions to these findings. Loughran et al. (1994) do not find evidence of long run underperformance for Swedish IPOs launched during 1980-1990. Schuster (2003) analyze 973 firms which went public on the six largest Continental European markets between 1988 and 1998. For the sample as a whole, he does not find long-run underperformance. Kim et al. (1995) and Chun and Smith (2003) find that IPOs overperform the stock market in the long run. Nurwati, Champbell and Goodacre (2007) also document positive abnormal returns for Malaysian IPOs.
Kıymaz (1997) analyzes the long-run returns of Turkish industrial IPOs in the 36 months following the initial trading day. The sample consists of 88 IPOs launched during the period of 1990-1995. Performance results show that IPO firms experience a cumulative positive abnormal return of 41.33%.
Merey (1997) analyzes 137 Turkish IPOs launched during the period of 1990-1996. He also cannot find the internationally pervasive long-run underperformance in the Turkish IPO market. The Turkish IPOs overperform the market in the long-run.
Ewing and Öztufan (2003) analyze the long-run returns of 189 Turkish IPOs launched during the 1990-1999 period. They find that IPO firms generate positive market-adjusted returns over a long-run horizon. The authors note that short-long-run cumulative excess returns, up to month ten, are negative. After ten months, however, there is a period in which cumulative excess returns fluctuate from positive to negative, until about month thirty. After month thirty, cumulative excess returns trend upward in a positive direction until after the sixth year. Varying international evidence on long-run performance is considered to be partially caused by the choice of the performance measurement methodology. Barber
Electronic copy available at: http://ssrn.com/abstract=2369152
and Lyon (1997) show that methodological differences significantly influence the abnormal-return calculation.
3. Data
Our sample consists of 126 firms listed and subsequently traded on the ISE during the period of January 1, 1995 and December 31, 2000. Of the 126 IPOs, 63 are classified as industrial, 44 as financial, 15 as services and 4 as technology sector IPOs. The aftermarket period includes the 60 months following the IPO. The data is provided by the data sales office of ISE. The price series reported by the office are adjusted for past stock splits and dividends.
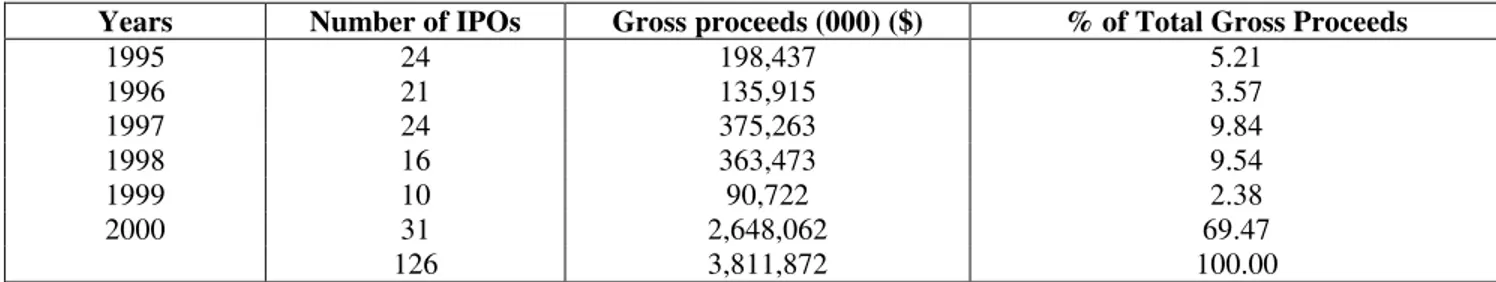
Table 1 provides the yearly frequency of IPOs and gross proceeds by years. In order eliminate the inflation induced bias, total proceeds are expressed in terms of US dollars.
Table 1: Yearly Frequency of IPOs
Years Number of IPOs Gross proceeds (000) ($) % of Total Gross Proceeds
1995 24 198,437 5.21 1996 21 135,915 3.57 1997 24 375,263 9.84 1998 16 363,473 9.54 1999 10 90,722 2.38 2000 31 2,648,062 69.47 126 3,811,872 100.00
The highest number of IPOs is observed in year 2000 with 31 IPOs, followed by 24 IPOs in years 1995 and 1997. Furthermore, 69% of the gross proceeds is realized in year 2000, followed by 9.84% of the proceeds that is realized in 1997. In terms of the number of IPOs and the percentage of gross proceeds, year 2000 seems to a dominant issue year in our sample.
4. Methodology
We use four measures to evaluate the long-run performance of IPOs: a) Cumulative abnormal returns (CARs)
b) Wealth Relatives
c) Buy-and-hold abnormal returns (BHARs) d) Calendar-time abnormal returns (CTARs)
By comparing alternative approaches, we will examine the robustness of our results.
One thing we have to note is that the quantitative measurement of the long-run performance of IPOs is very sensitive to the benchmark employed. A relatively small number of stocks listed on the ISE does not allow us to develop a benchmark that appropriately controls for factors such as industry, capital structure, size, etc. Eventually, we cannot use the matching firm method to find out the abnormal returns.
Monthly abnormal return is calculated as the monthly return on a stock minus the monthly return for the ISE 100 index. Eventually, monthly abnormal return for stock i in event month t is defined as:
mt it
it r r
ar = −
where rit is the return on firm i in event month t and rmt is the return on the ISE 100 index during the corresponding time period. The abnormal return on a portfolio of n stocks for event month t is:
, 1
∑
= = n i it it t x ar ARwhere the weight xit is 1/nt when abnormal returns are equally weighted and
∑
= t n i it it MV MV 1 / whenabnormal returns are value weighted. MV is the market capitalization (computed by the use of the first market price in US dollar) and nt is the number of IPO firms whose shares are traded during event month t.
The cumulative abnormal return from event month 1 to event month s is the summation of the abnormal returns:
∑
= = s t t s AR CAR 1 , 1We compute both the equally weighted CARs and value-weighted CARs in our analysis. The test statistic for CAR1,s is calculated as CAR1,s× ns /csds, where ns is the number of IPO firms traded
in month s. csds is computed as (s.var+2.(t-1).cov)1/2, where s is the event month, var is the average cross-sectional variance, and cov is the first-order autocovariance of the ARt series.
We also compute buy-and-hold returns from event month 1 to event month s, defined as: % 100 * 1 ) 1 ( 1 , 1 − + =
∏
= s t it s r BHRBuy-and-hold return is the total return from a buy and hold strategy where a stock is purchased at the first market price after going public and held until month s. The mean buy-and-hold return for period s is defined as:
, 1 is n i is s x BHR BHR t
∑
= =where the weight xis is 1/ns when abnormal returns are equally weighted and
∑
= t n i is is MV MV 1 / when
abnormal returns are value weighted. To interpret the mean buy-and-hold return, wealth relatives are computed as performance measures, defined as:
WR=(1+mean buy-and-hold return on IPOs)/(1+ mean buy-and-hold return on ISE 100 index) A wealth relative of greater than 1 can be interpreted as IPOs outperforming the ISE 100 index and a wealth relative of less than 1 shows that IPOs underperformed.
The buy-and-hold abnormal return from event month 1 to event month s is defined as follows: − + − − + =
∏
∏
= = s t mt s t it s i r r BHAR 1 1 , (1 ) 1 (1 ) 1The mean buy-and-hold abnormal return for period s is defined as:
is n i is s x BHAR BHAR t
∑
= = 1To test the null hypothesis of zero mean buy-and-hold abnormal return, we use the skewness adjusted t statistic advocated by Neyman and Pearson (1928) and recently used by Lyon, Barber and Tsai (1999). The t-statistic is defined as:
γ γ ˆ 6 1 ˆ 3 / 1 ( * 2 n S S n t= + + where , ) ( ) ( t t BHAR BHAR Mean S σ
= t=12, 24, 36, 48 and 60 months and
γ
ˆ is an estimate of the coefficient of skewness.The fourth measure we use is based on the calendar-time portfolio method, which eliminates the problem of cross-sectional dependence among sample firms. For each stock, we calculate the abnormal return arit for each month. In each calendar month t, we calculate a mean abnormal return (MARt) across firms in the portfolio:
∑
= = t n i it it t x ar MAR 1The weight xit is 1/nt when abnormal returns are equally weighted and
∑
= t n i it it MV MV 1 / when
abnormal returns are value weighted. We then calculate the calendar-time abnormal return (CTAR) which is the grand mean of monthly abnormal returns (MMAR):
∑
= = t s t t MAR s MMAR 1 1where s is the total number of calendar months.
To test the null hypothesis of zero mean monthly abnormal returns, a t statistic is calculated using the time-series standard deviation of the mean monthly standardized abnormal returns:
s dardized s MAR MMAR MMAR t( )= /σ( ( tan )t×
5. Empirical Findings
5.1. Cumulative Abnormal Returns
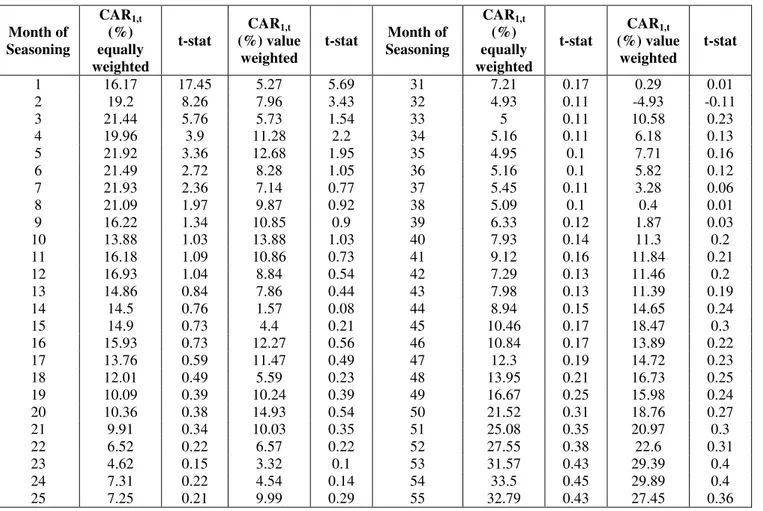
Table 2 gives the cumulative abnormal returns (CARs) of our sample of IPO firms for the 60 months after the offering date. Over the first 8 months of listing, IPOs overperform the ISE 100 Index by approximately 21% as measured by equally weighted CARs and this overperformance is statistically significant at 0.05 level. From this point on, overperformance is statistically insignificant. At month 60, the CAR is 50.78% (t-statistic = 0.61).
Table 2: Cumulative Abnormal Returns for IPOs in 1995-2000
Month of Seasoning CAR1,t (%) equally weighted t-stat CAR1,t (%) value weighted t-stat Month of Seasoning CAR1,t (%) equally weighted t-stat CAR1,t (%) value weighted t-stat 1 16.17 17.45 5.27 5.69 31 7.21 0.17 0.29 0.01 2 19.2 8.26 7.96 3.43 32 4.93 0.11 -4.93 -0.11 3 21.44 5.76 5.73 1.54 33 5 0.11 10.58 0.23 4 19.96 3.9 11.28 2.2 34 5.16 0.11 6.18 0.13 5 21.92 3.36 12.68 1.95 35 4.95 0.1 7.71 0.16 6 21.49 2.72 8.28 1.05 36 5.16 0.1 5.82 0.12 7 21.93 2.36 7.14 0.77 37 5.45 0.11 3.28 0.06 8 21.09 1.97 9.87 0.92 38 5.09 0.1 0.4 0.01 9 16.22 1.34 10.85 0.9 39 6.33 0.12 1.87 0.03 10 13.88 1.03 13.88 1.03 40 7.93 0.14 11.3 0.2 11 16.18 1.09 10.86 0.73 41 9.12 0.16 11.84 0.21 12 16.93 1.04 8.84 0.54 42 7.29 0.13 11.46 0.2 13 14.86 0.84 7.86 0.44 43 7.98 0.13 11.39 0.19 14 14.5 0.76 1.57 0.08 44 8.94 0.15 14.65 0.24 15 14.9 0.73 4.4 0.21 45 10.46 0.17 18.47 0.3 16 15.93 0.73 12.27 0.56 46 10.84 0.17 13.89 0.22 17 13.76 0.59 11.47 0.49 47 12.3 0.19 14.72 0.23 18 12.01 0.49 5.59 0.23 48 13.95 0.21 16.73 0.25 19 10.09 0.39 10.24 0.39 49 16.67 0.25 15.98 0.24 20 10.36 0.38 14.93 0.54 50 21.52 0.31 18.76 0.27 21 9.91 0.34 10.03 0.35 51 25.08 0.35 20.97 0.3 22 6.52 0.22 6.57 0.22 52 27.55 0.38 22.6 0.31 23 4.62 0.15 3.32 0.1 53 31.57 0.43 29.39 0.4 24 7.31 0.22 4.54 0.14 54 33.5 0.45 29.89 0.4 25 7.25 0.21 9.99 0.29 55 32.79 0.43 27.45 0.36
26 7.63 0.21 5.81 0.16 56 37.21 0.48 30.93 0.4 27 8.3 0.22 6.97 0.19 57 40.71 0.51 34.28 0.43 28 8.56 0.22 8.46 0.22 58 47.6 0.59 38.97 0.48 29 6.6 0.16 4.1 0.1 59 46.63 0.57 38.61 0.47 30 6.75 0.16 7.75 0.19 60 50.78 0.61 44.15 0.53
The value weighted CARs are smaller in magnitude than equally weighted CARs. When we evaluate the value weighted CARs, we see that IPOs overperform the ISE 100 Index by 12.68% over the first 5 months of listing and the overperformance is statistically significant at 0.10 level. From this point on, overperformance is statistically insignificant. At month 60, the value weighted CAR is 44.15%. (t-statistic = 0.53).
5.2. Buy-and-Hold Returns and Wealth Relatives
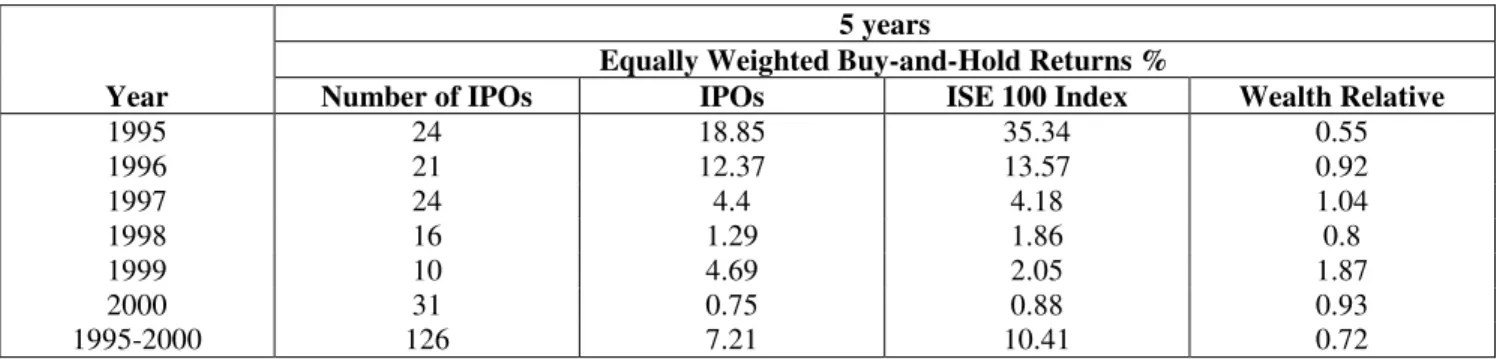
In Table 3, we report the equally weighted buy-and-hold returns and the wealth relatives for the 126 IPO firms by cohort year of the IPOs. The overall 5 year wealth relative is 0.72. This means that IPOs underperform the ISE 100 index. We see that only the wealth relatives of the IPOs launched in years 1997 and 1999 are above 1. This shows that only IPOs launched in 1997 and 1999 exhibit better performance than the market index.
In Table 4, we report the value weighted buy-and-hold returns and the wealth relatives. The overall 5 year wealth relative is again 0.72. We see that only the wealth relative of the IPOs launched in year 1997 is above 1.
Table 3: The Long-Run Performance of IPOs by Cohort Year (Equally Weighted Buy-and-Hold Returns)
5 years
Equally Weighted Buy-and-Hold Returns %
Year Number of IPOs IPOs ISE 100 Index Wealth Relative
1995 24 18.85 35.34 0.55 1996 21 12.37 13.57 0.92 1997 24 4.4 4.18 1.04 1998 16 1.29 1.86 0.8 1999 10 4.69 2.05 1.87 2000 31 0.75 0.88 0.93 1995-2000 126 7.21 10.41 0.72
Table 4: The Long-Run Performance of IPOs by Cohort Year (Value Weighted Buy-and-Hold Returns)
5 years
Value Weighted Buy-and-Hold Returns %
Number of IPOs IPOs ISE 100 Index Wealth Relative
1995 24 14.09 33.76 0.43 1996 21 9.24 12.84 0.74 1997 24 6.91 3.91 1.61 1998 16 0.73 1.92 0.59 1999 10 1.11 1.26 0.94 2000 31 0.02 0.83 0.56 1995-2000 126 6.69 9.62 0.72
5.3. Buy-and-Hold Abnormal Returns
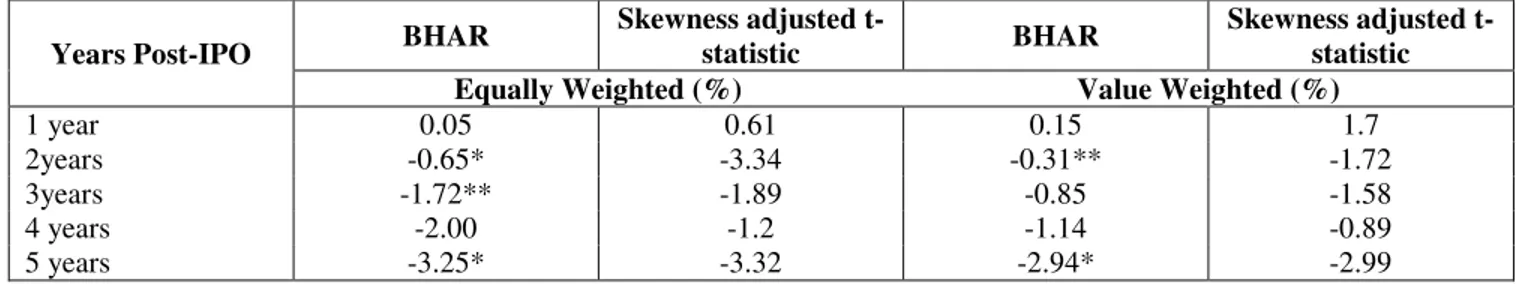
In Table 5, we report the BHARs and their skewness-adjusted t-statistics for our sample of IPO firms. If we look at the equally weighted BHARs, we see that the underperformance of IPO firms relative to the ISE 100 index is -3.25% five years after the IPO. Underperformance after 2 years and underperformance after 5 years is statistically significant at 1% level. Additionally, underperformance after 3 years is statistically significant at 10% level. In terms of the value weighted BHARs,
underperformance relative to the ISE 100 index is -2.94% after five years. Underperformance after 2 years is statistically significant at 10% level and underperformance after 5 years is statistically significant at 1% level if we consider the value weighted BHARs.
5.4. Calendar-Time Abnormal Returns
In Table 6, we report the CTARs and their t-statistics for our sample of IPO firms. The results show that on an equally weighted basis, CTAR is 0.79% when we take the 36 month period returns. On a value weighted basis, CTAR is 0.65% for the 36 month returns. The returns are statistically insignificant for both the equally weighted CTAR statistic=0.002) and the value weighted CTAR (t-statistic = 0.003). When we take the 60 month period returns, equally weighted CTAR is 0.85%. On a value weighted basis, CTAR is 0.73% for the 60 month returns. The returns are not statistically significant for both the equally weighted CTAR statistic=0.003) and value weighted CTAR (t-statistic=0.001).
Table 5: Buy-and-Hold Abnormal Returns
Years Post-IPO BHAR
Skewness adjusted
t-statistic BHAR
Skewness adjusted t-statistic
Equally Weighted (%) Value Weighted (%)
1 year 0.05 0.61 0.15 1.7
2years -0.65* -3.34 -0.31** -1.72 3years -1.72** -1.89 -0.85 -1.58
4 years -2.00 -1.2 -1.14 -0.89
5 years -3.25* -3.32 -2.94* -2.99 *Statistically significant at 1% level.
**Statistically significant at 10% level.
Table 6: Calendar-Time Abnormal Returns
Holding Period CTAR t-statistic CTAR t-statistic
Equally Weighted (%) Value Weighted (%)
36 months 0.79 0.002 0.65 0.003
60 months 0.85 0.003 0.73 0.001
6. Conclusion
This paper examines the long-run stock market performance of Turkish IPOs. Our sample consists of 126 IPOs for the period from 1995 to 2000. We use three methodologies to analyse the relative performance of IPO firms. Using CARs as an abnormal performance measure, we find that the Turkish IPOs do not significantly underperform or overperform the ISE 100 Index in the long run. Using the wealth relatives, we find that IPOs underperformed the ISE 100 index. When we use equally weighted BHARs as an alternative measure of performance, we find that IPOs significantly underperform the ISE 100 Index after two years, after three years and after five years. There is no underperformance or overperformance after one year and after four years. Significant underperformance is found for value weighted BHARs after two years and after five years. There is no abnormal return after one year, after three years and after four years. Using CTAR as an abnormal performance measure, we find that the Turkish IPOs do not significantly underperform or overperform the ISE 100 in the long run.
Eventually, we see that the choice of the performance measurement methodology changes our results. Because we find underperformance only for wealth relatives and BHARs, we provide support for Fama (1998) and Mitchell and Stafford (2000) who argue that the buy-and-hold returns method can magnify underperformance -even if it occurs in only a single period- as a consequence of compounding single-period returns at a monthly frequency.
References
[1] Aggarwal, R., Leal, R. and L. Hernandez. 1993. “The Aftermarket Performance of Initial Public Offerings in Latin America”, Financial Management, 22(1), pp. 42-53.
[2] Brav, Alon, Christopher Geczy, and Paul A. Gompers. 2000. “Is the Abnormal Return Following Equity Issuances Anomalous?”, Journal of Financial Economics, 56(2), pp. 209-249.
[3] Carter, R., Frederick, H. and A. Singh. 1998. “Underwriter Reputation, Initial Returns, and the Long-Run Performance of IPO Stocks”, Journal of Finance, 53(1) , pp. 285-311.
[4] Chun, H., Smith, S.C. 2003. “New Issues in Emerging Markets: Determinants, Effects, and Stock Market Performance of IPOs in Korea”, Journal of Emerging Market Finance, 2 (3), pp. 253–285.
[5] Ewing, B. And Ö. Öztufan. 2003. “The Performance of Initial Public Offerings in an Emerging Market: The Case of the Istanbul Stock Exchange”, International Journal of Business, 8(2), pp. 150-167
[6] Fama, E. 1998. “Market Efficiency, Long-Term Returns and Behavioral Finance”, Journal of Financial Economics, 49(3), pp. 283-306.
[7] Goergen, M. And L. Renneborg. 2003. “Insider Retention and Long-Run Performance in German and UK IPOs”. Tilec Discussion Paper. Tilburg University.
[8] Jaskiewicz, P., Gonzalez, V., Menendez, S. and D. Schiereck. 2005. “Long-Run IPO Performance Analysis of German and Spanish Family-Owned Businesses”, Family Business Review, 18(3), pp. 179-202
[9] Kim, J., Krinsky, I. and J. Lee. 1995. “The After-Market Performance of Initial Public Offerings in Korea”, Pacific-Basin Financial Journal. 3(4), pp. 429-448.
[10] Kiymaz, H. 1998. “Turkish IPO Pricing in the Short and Long-Run”. Bilkent University. Mimeo.
[11] Lee, P., Taylor, S. and T. Walter. 1994. “Australian IPO Pricing in the Short and Long-Run”, University of Sydney. Mimeo.
[12] Levis, M. 1993. “The Long-Run Performance of Initial Public Offerings: The UK Experience 1980-1988”, Financial Management, 22(1), pp. 28-41.
[13] Loughran, T., Ritter, J. and K. Rydqvist. 1994. “Initial Public Offerings: International Insights”. Pacific-Basin Finance Journal. 2(2-3), pp. 165–199.
[14] Loughran, T.and J. Ritter. 2000. “Uniformly Least Powerful Tests of Market Efficiency”, Journal of Financial Economics, 55(3), pp. 361-389.
[15] Lyon, J., Barber, B. and C. Tsai. 1999. “Improved Methods for Tests of Long-Run Abnormal Stock Returns”, Journal of Finance, 54(1), pp. 165-201.
[16] Merey, M. 1997. “The Aftermarket Performance of Initial Public Offerings: The Case of Istanbul Stock Exchange”. METU PhD Thesis.
[17] Mitchell, L., and E. Stafford. 2000. “Managerial Decision Making and Long-Term Stock Price Performance”, Journal of Business, 73(3), pp. 287-329.
[18] Neyman, J., and E. Pearson. 1928. “On the Use and Interpretation of Certain Test Criteria for Purposes of Statistical Inference”, Biometrica, 20A, pp. 175-240.
[19] Nurwati, A.-Z., Campbell, K., Goodacre, A. 2007. “The Long-Run Share Price Performance of Malaysian IPOs”, Journal of Business Finance Account, 34 (1-2), pp. 78-110.
[20] Rajan, R. and H. Servaes. 1997. “Analyst Following of Initial Public Offerings”. Journal of Finance. 52(2), pp. 507-529.
[21] Ritter, J. 1991. “The Long-Run Performance of Initial Public Offerings”. Journal of Finance. 46(1), pp. 3-27.