EUROPEAN ORGANIZATION FOR NUCLEAR RESEARCH (CERN)
CERN-EP-2018-290 2019/05/03
CMS-B2G-17-012
Search for vector-like quarks in events with two oppositely
charged leptons and jets in proton-proton collisions at
√
s
=
13 TeV
The CMS Collaboration
∗Abstract
A search for the pair production of heavy vector-like partners T and B of the top and bottom quarks has been performed by the CMS experiment at the CERN LHC using
proton-proton collisions at√s = 13 TeV. The data sample was collected in 2016 and
corresponds to an integrated luminosity of 35.9 fb−1. Final states studied for TT
pro-duction include those where one of the T quarks decays via T→tZ and the other via
T → bW, tZ, or tH, where H is a Higgs boson. For the BB case, final states include
those where one of the B quarks decays via B→bZ and the other B→tW, bZ, or bH.
Events with two oppositely charged electrons or muons, consistent with coming from the decay of a Z boson, and jets are investigated. The number of observed events is consistent with standard model background estimations. Lower limits at 95% confi-dence level are placed on the masses of the T and B quarks for a range of branching
fractions. Assuming 100% branching fractions for T → tZ, and B → bZ, T and B
quark mass values below 1280 and 1130 GeV, respectively, are excluded.
Published in the European Physical Journal C as doi:10.1140/epjc/s10052-019-6855-8.
c
2019 CERN for the benefit of the CMS Collaboration. CC-BY-4.0 license
∗See Appendix A for the list of collaboration members
1
1
Introduction
The standard model (SM) has been outstandingly successful in describing a wide range of fun-damental phenomena. However, one of its notable shortcomings is that it does not provide a natural explanation for the Higgs boson (H) [1–3] observed at 125 GeV [4, 5] having a mass that is comparable to the electroweak scale. The suppression of divergent loop corrections to the Higgs boson mass requires either fine-tuning of the SM parameters or new particles at the TeV scale. Many theories of beyond-the-SM physics phenomena that attempt to solve this hierar-chy problem predict new particles, which could be partners of the top and bottom quarks and thus cancel the leading loop corrections. Vector-like quarks (VLQs) represent one class of such particles among those that have fermionic properties. Their left- and right-handed components
transform in the same way under the SM symmetry group SU(3)C×SU(2)L×U(1)Y [6]. This
property allows them to have a gauge-invariant mass term in the Lagrangian of the form ψψ, where ψ represents the fermion field; hence, their masses are not determined by their Yukawa couplings to the Higgs boson. These quarks are not ruled out by the measured properties of the Higgs boson. They are predicted in many beyond-the-SM scenarios such as grand uni-fied theories [7], beautiful mirrors [8], models with extra dimensions [9], little Higgs [10–12], and composite Higgs models [13], as well as theories proposed to explain the SM flavor struc-ture [14] and solve the strong CP problem [15].
The VLQs can be produced singly or in pairs [6]. The cross section for single-quark production is model dependent and depends on the couplings of the VLQs to the SM quarks. On the other hand, pair production of VLQs occurs via the strong interaction, and its cross section is uniquely determined by the mass of the VLQ. Another characteristic of the VLQs is their flavor-changing neutral current decay, which distinguishes them from chiral fermions. The top and bottom quark VLQ partners T and B are expected to couple to the SM third-generation
quarks [16], and decay via T→bW, tZ, tH and B→tW, bZ, bH, respectively.
In this paper, a search for the production of TT and BB is presented, where at least one of the
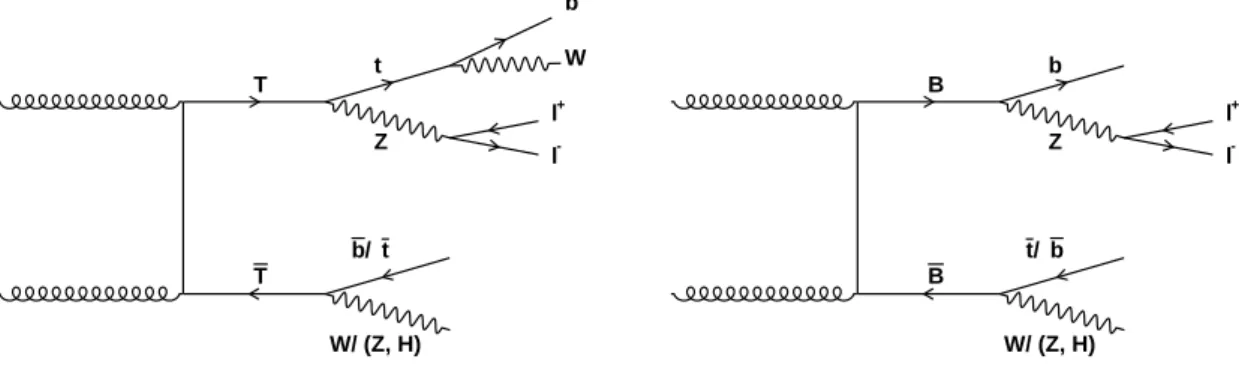
T (B) quarks decays as T → tZ (B → bZ), as shown in Fig. 1. The search is performed using
events with two oppositely charged electrons or muons, consistent with coming from a decay of a Z boson, and jets. The data were collected with the CMS detector at the CERN LHC in 2016,
from proton-proton (pp) collisions at√s = 13 TeV, corresponding to an integrated luminosity
of 35.9 fb−1. T T t b W Z + l -l t / b W/ (Z, H) B B b Z + l -l b / t W/ (Z, H)
Figure 1: Leading-order Feynman diagrams for the pair production and decay of T (left) and B (right) VLQs relevant to final states considered in this analysis.
Searches for the pair production of T and B quarks have previously been reported by the AT-LAS [17–20] and CMS [21–23] Collaborations. The strictest lower limits on the T and B quark
masses range between 790 and 1350 GeV, depending on the decay mode studied. The mass range for the T and B quarks studied in this analysis is 800–1500 GeV.
2
The CMS detector and event simulation
The central feature of the CMS apparatus is a superconducting solenoid of 6 m internal diame-ter, providing a magnetic field of 3.8 T. Within the solenoid volume are a silicon pixel and strip tracker, a lead tungstate crystal electromagnetic calorimeter (ECAL), and a brass and scintilla-tor hadron calorimeter (HCAL), each composed of a barrel and two endcap sections. Forward calorimeters extend the pseudorapidity (η) coverage provided by the barrel and endcap detec-tors. Muons are detected in gas-ionization chambers embedded in the steel flux-return yoke outside the solenoid. A more detailed description of the CMS detector, together with a def-inition of the coordinate system used and the relevant kinematic variables, can be found in Ref. [24].
Events of interest are selected using a two-tiered trigger system [25]. The first level, composed of custom hardware processors, uses information from the calorimeters and muon detectors to select events at a rate of around 100 kHz within a time interval of less than 4 µs. The second level, known as the high-level trigger, consists of a farm of processors running a version of the full event reconstruction software optimized for fast processing, and reduces the event rate to around 1 kHz before data storage.
Monte Carlo (MC) simulated signal events of the processes pp → TT and pp→ BB for T and
B quark masses in the range 0.8–1.5 TeV are produced in steps of 0.1 TeV. The events are
gen-erated with MADGRAPH5 [email protected] [26], where the processes are produced at leading
order (LO) with up to two partons in the matrix element calculations, using the NNPDF3.0 parton distribution function (PDF) set [27]. Showering and hadronization is simulated with PYTHIA8.212 [28] using the underlying event tune CUETP8M1 [29]. To normalize the simulated signal samples to the data, order (NNLO) and
next-to-next-to-leading-logarithmic (NNLL) soft-gluon resummation cross sections are obtained using the TOP++
pro-gram (v.2.0) [30], with the MSTW2008NNLO68CL PDF set as implemented in the LHAPDF (v.5.9.0) framework [31].
The main background process is Drell–Yan (Z/γ∗)+jets production, with smaller contributions
from tt+jets and ttZ. Throughout the paper this background will be referred to as DY+jets. Other backgrounds, such as diboson, tZq, tWZ, and ttW production, are considerably smaller. The DY+jets simulated background samples are generated in different bins of the Z boson
transverse momentum pT, using the MC@NLO[32] event generator at NLO precision with the
FXFXjet-matching scheme [33]. The tt+jets events are generated using thePOWHEG2.0 [34–36]
generator. The generated events are interfaced with PYTHIA 8.212 [28] for shower modeling
and hadronization, using the underlying event tune CUETP8M2T4 [37] for tt+jets simulation and CUETP8M1 [29] for the DY+jets process. The SM diboson events are also produced using
the same standalonePYTHIA8.212 generator. The production of rare single top processes tZq
and tWZ, as well as a tt pair in association with a Wor Z boson, are simulated with up to
one additional parton in the matrix element calculations using the MADGRAPH5 aMC@NLO
2.3.3 [26] generator at LO precision and matched with the parton showering predictions using the MLM matching scheme [38].
Backgrounds are normalized according to the theoretical predictions for the corresponding
cross sections. The DY+jets production cross sections from the MC@NLO [32] generator are
3
NNLO [30] is determined. Diboson production is calculated at NLO for WZ [39] and NNLO for ZZ [40] and WW [41]. The production cross sections for the rare processes tZq, tWZ, and ttW are calculated at NLO [42].
A GEANT4-based [43, 44] simulation of the CMS apparatus is used to model the detector
re-sponse, followed by event reconstruction using the same software configuration as for the col-lision data. The effect of additional pp interactions in the same or nearby bunch crossings
(pileup) in concurrence with the hard scattering interaction is simulated using thePYTHIA8.1
generator and a total inelastic pp cross section of 69.2 mb [42]. The frequency distribution of the additional events is adjusted to match that observed in data and has a mean of 23.
3
Event reconstruction
The event reconstruction in CMS uses a particle-flow (PF) algorithm [45] to reconstruct a set of physics objects (charged and neutral hadrons, electrons, muons, and photons) using an opti-mized combination of information from the subdetectors. The energy calibration is performed separately for each particle type.
The pp interaction vertices are reconstructed from tracks in the silicon tracker using the
deter-ministic annealing filter algorithm [46]. The pp interaction vertex with the highest∑ p2
T of the
associated clusters of physics objects is considered to be the primary vertex associated with the hard scattering interaction. Here, the physics objects are the jets, which are clustered with the
tracks assigned to the vertex using the anti-kTjet clustering algorithm [47, 48], and the missing
transverse momentum~pTmiss, defined as the negative vector sum of the~pTof those jets, with its
magnitude referred to as pmissT . The interaction vertices not associated with the hard scattering
are designated as pileup vertices.
Electron candidates are reconstructed from clusters of energy deposited in the ECAL and from hits in the silicon tracker [49]. The clusters are first matched to track seeds in the pixel de-tector, then the trajectory of an electron candidate is reconstructed considering energy lost by the electron due to bremsstrahlung as it traverses the material of the tracker, using a Gaus-sian sum filter algorithm. The PF algorithm further distinguishes electrons from charged pions using a multivariate approach [50]. Observables related to the energy and geometrical match-ing between track and ECAL cluster(s) are used as main inputs. Additional requirements are applied on the ECAL shower shape, the variables related to the track-cluster matching, the im-pact parameter, and the ratio of the energies measured in the HCAL and ECAL in the region around the electron candidate. With these requirements, the reconstruction and identification
efficiency of an electron from a Z→e+e−decay is on average 70%, whereas the
misidentifica-tion rate is 1–2% [49]. Electrons with pT > 25 GeV and|η| < 2.4 are selected for this analysis.
Further, electrons passing through the transition regions between the ECAL barrel and endcap
sections, (1.444< |η| <1.566), which are less well measured, are removed.
Muon candidates are identified by multiple reconstruction algorithms using hits in the silicon tracker and signals in the muon system. The standalone muon algorithm uses only information from the muon detectors. The tracker muon algorithm starts from tracks found in the silicon tracker and then associates them with matching tracks in the muon detectors. The global muon algorithm starts from standalone muons and then performs a global fit to consistent hits in the tracker and the muon system [51]. Global muons are used by the PF algorithm. Muons are required to pass additional identification criteria based on the track impact parameter, the quality of the track reconstruction, and the number of hits recorded in the tracker and the muon
Charged leptons (electrons or muons) from Z→e+e−or Z→µ+µ−decays, with the Z boson originating from the decay of a heavy VLQ, are expected to be isolated, i.e., to have low levels of energy deposited in the calorimeter regions around their trajectories. An isolation variable is
defined as the scalar pTsum of the charged and neutral hadrons and photons in a cone centered
on the direction of the lepton, of radius∆R ≡ √(∆η)2+ (∆φ)2, with∆R = 0.3(0.4)for
elec-trons (muons). The pTcontributions from pileup and from the lepton itself are subtracted from
the isolation variable [49, 51]. The relative isolation parameter, defined as the isolation
vari-able divided by the lepton pT, is required to be less than 0.06 (0.15) for the electrons (muons),
with corresponding efficiencies of 85 and 95%, respectively, based on simulation. The isolation requirement helps reject jets misidentified as leptons and reduce multijet backgrounds.
The anti-kTjet clustering algorithm [47, 48] reconstructs jets with PF candidates as inputs. The
energy of charged hadrons is determined from a combination of their momentum measured in the tracker and the matching ECAL and HCAL energy deposits, corrected for zero-suppression effects and for the response function of the calorimeters to hadronic showers. Finally, the ergy of neutral hadrons is obtained from the corresponding corrected ECAL and HCAL en-ergies. To suppress the contribution from pileup, charged particles not originating from the primary vertex are removed from the jet clustering. An event-by-event jet-area-based correc-tion [52, 53] is applied to subtract the contribucorrec-tion of the neutral-particle component of the pileup. Residual corrections are applied to the data to account for the differences with the simulations [54].
Two types of jet are considered, distinguished by the choice of distance parameter used for clustering. Those clustered with a distance parameter of 0.4 (“AK4 jets”), are required to have
pT > 30 GeV, and those clustered with a value of 0.8 for this parameter (“AK8 jets”) must
satisfy the condition pT >200 GeV, where the jet momentum is the vector sum of the momenta
of all particles clustered in the jet. Both classes of jets must satisfy|η| < 2.4. A new value for
pmiss
T is determined using the PF objects and including the jet energy corrections.
The combined secondary vertex b tagging algorithm (CSVv2) [55] is used to identify jets origi-nating from the hadronization of b quarks. The algorithm combines information on tracks from the silicon tracker and vertices associated with the jets using a multivariate discriminant. An AK4 jet is defined as a b-tagged jet if the corresponding CSVv2 discriminant is above a thresh-old that gives an average efficiency of about 70% for b quark jets and a misidentification rate of 1% for light-flavored jets.
The signal events searched for in this analysis have two massive VLQs decaying to at least one Z boson and either a Z, W, or Higgs boson and two heavy quarks. One Z boson must decay leptonically, whereas the remaining Z, W, or Higgs boson is reconstructed using its hadronic decays into jets. Depending on the mass of the VLQ, the decay products can have a large
Lorentz boost. In this case, the decay products of W → qq0 and Z → qq (collectively labeled
as V → qq), H → bb, and t → qq0b may be contained within a single AK8 jet. These decays
are reconstructed using a jet substructure tagger. The decay products of heavy bosons and top quarks that do not acquire a large Lorentz boost are identified by a resolved tagger using AK4 jets. Both types of taggers are described in the next section.
4
Event selection and categorization
For the dielectron (Z →e+e−) channel, event candidates are selected using triggers requiring
the presence of at least one electron with pT > 115 GeV or a photon with pT > 175 GeV. After
5
on the electromagnetic shower shape and the quality of the electron track. A loose isolation criterion on the electrons is further required, as described in Section 3. One of the electrons is
required to have pT > 120 GeV in order to remain above the triggering electron pT threshold.
Since the signal electrons originate from the decay of highly boosted Z bosons, these selection criteria preserve the high signal efficiency, while reducing the number of misidentified
elec-trons. The photon trigger helps to retain electrons with pT >300 GeV that would otherwise be
lost because of the requirements on electromagnetic shower shape in the ECAL.
For the dimuon (Z → µ+µ−) channel, event candidates are selected using a trigger that
re-quires presence of at least one muon with pT > 24 GeV. The trigger implements a loose
isola-tion requirement by allowing only a small energy deposit in the calorimeters around the muon
trajectory. After passing the trigger, one of the muons from the Z → µ+µ−decay must have
pT > 45 GeV, which provides the largest background rejection that can be obtained without
decreasing the signal efficiency for the VLQ mass range of interest. The trigger and lepton re-construction and identification efficiencies are determined using a tag-and-probe method [56]. Scale factors are applied to the simulated events to account for any efficiency differences be-tween the data and simulation.
The invariant mass of the lepton pair from the Z boson leptonic decay must satisfy 75 <
m(``) < 105 GeV, to be consistent with the Z boson mass, and have a total pT(``) >100 GeV,
appropriate for the decay of a massive VLQ. Events must have exactly one e+e−or µ+µ−pair
candidate consistent with a Z boson decay.
Events are required to have at least three AK4 jets with HT >200 GeV, and HT ≡ ∑ pT, where
the summation is over all jets in the event. The highest pT(leading) AK4 jet is required to have
pT > 100 GeV, the second-highest-pT(subleading) AK4 jet to have pT > 50 GeV, and all other
jets must satisfy the condition pT > 30 GeV. The AK4 (AK8) jets j within∆R(`, j) < 0.4 (0.8)
of either lepton from the Z boson decay are not considered further in the analysis. At least one
b-tagged jet with pT > 50 GeV is required. The ST variable, defined as the sum of HT, pT(Z),
and pmissT , must be greater than 1000 GeV. The selection criteria are summarized in Table 1.
The selections are optimized to obtain the largest suppression of SM backgrounds that can be achieved without reducing the simulated signal efficiency by more than 1%.
Table 1: Event selection criteria.
Variable Selection
Z→ ``candidate multiplicity =1
pT(Z) >100 GeV
AK4 jet multiplicity ≥3
HT >200 GeV
pTof leading AK4 jet >100 GeV
pTof subleading AK4 jet >50 GeV
b-tagged AK4 jet multiplicity ≥1
pTof b jet >50 GeV
ST >1000 GeV
The event topologies are different for TT and BB decays, and the product of the signal efficiency and the acceptance varies from 1.2 to 2.6% over the various signal channels. The TT events are characterized by three heavy bosons and two heavy quarks in the decay sequence. The BB events have two heavy bosons and two heavy quarks, hence more energetic final decay objects. Therefore, the analysis is optimized separately for the TT and BB channels.
using the jet substructure tagger, and are referred to as V and H jets, respectively. As the Higgs boson mass is larger than W and Z boson masses, it requires a higher momentum for its decay
products to merge into a single AK8 jet. Therefore, H jets are required to have pT > 300 GeV
and V jets have pT > 200 GeV. A jet pruning algorithm [57, 58] is used to measure the jet
mass. The V and H jet candidates are required to have a pruned jet mass in the range 65–105 and 105–135 GeV, respectively. The jet pruning algorithm reclusters the groomed jets [59] by eliminating low energy subjets subjets. In the subsequent recombination of two subjets, the
ratio of the subleading subjet pT to the pruned jet pTmust be greater than 0.1 and the distance
between the two subjets must satisfy∆R < mjet/2pTjet, where mjet and pTjet are the mass and
pT of the pruned jet, respectively.
The N-subjettiness algorithm [60] is used to calculate the jet shape variable τN, which quantifies
the consistency of a jet with the hypothesis of the jet having N subjets, each arising from a hard parton coming from the decay of an original heavy boson. The V and H jets in the TT
(BB) search are required to have an N-subjettiness ratio τ21 ≡ τ2/τ1 < 1.0(0.6). Both pruned
subjets coming from the H jet are required to be b-tagged. This is done by using the above-mentioned CSVv2 b-tagging algorithm with a cut that gives a 70–90% efficiency for b quark
subjets, depending on the subjet pT, and a misidentification rate of 10% for subjets from
light-flavored quarks and gluons.
Boosted top quarks decaying to bqq0are identified (“t tagged”) using AK8 jets and the soft-drop
algorithm [61, 62] to groom the jet. This algorithm recursively declusters a jet into two subjets. It discards soft and wide-angle radiative jet components until a hard-splitting criterion is met, to obtain jets consistent with the decay of a massive particle. We use the algorithm with an
angular exponent β=0, a soft cutoff threshold zcut <0.1, and a characteristic radius R0 =0.8.
For top quark jets, the soft-drop mass must be in the range 105–220 GeV and the N-subjettiness
ratio τ32 ≡τ3/τ2 < 0.81(0.67)for the TT (BB) search, consistent with the expectation for three
subjets from top quark decay. There are a total of five heavy bosons and quarks produced in TT signal events, whereas there are only four in BB events. Thus it is possible to apply a tighter N-subjetiness ratio criterion in the BB analysis without a loss of signal efficiency.
Corrections to the jet mass scale, resolution and τ21selection efficiency for V jets due to the
dif-ference in data and MC simulation are measured using a sample of semileptonic tt events [63]. For the correction to the jet mass scale and resolution, boosted W bosons produced in the top quark decays are separated from the combinatorial tt background by performing a simultane-ous fit to the observed pruned jet mass spectrum. In order to account for the difference in the
jet shower profile of V → qq and H → bb decays, a correction factor to the H jets mass scale
and resolution [64] is measured by comparing the ratio of H and V jet efficiencies using the PYTHIA 8.212 [28] andHERWIG++ [65] shower generators. In addition, the corrections to τ21 selection efficiency are obtained based on the difference between data and simulation [64] for H-tagged jets. All these corrections are propagated to V, top quark and H jets, respectively.
For top quark jets, the corrections to the τ32selection efficiency are measured between data and
simulation [63] using soft-drop groomed jets. To account for the misidentification of boosted V-, H-, and t-tagged jets in the background samples, mistagging scale factors are derived from a region in the data enriched in Z+jets events, which is constructed using the selection criteria listed in Table 1, with the exception that events must have zero b jets. These mistagging scale factors are applied to the mistagged jets in simulated signal and background events.
In the TT search, in addition to the jet substructure techniques, the W, Z, H, and top quark decays are reconstructed with a resolved tagger using AK4 jets, as described below. Only those
7
resolved tagging algorithm. The resolved V → qq and H → bb candidates are composed of
two AK4 jets j1 and j2 whose invariant mass must satisfy 70 < m(j1j2) < 120 GeV and 80 <
m(j1j2) <160 GeV, respectively, and have pT(j1j2) >100 GeV. For H candidates, at least one of the jets must be b tagged. The resolved top quark candidate is composed of either three AK4
jets j1, j2, and j3 with an invariant mass 120 < m(j1j2j3) < 240 GeV and pT(j1j2j3) > 100 GeV,
or an AK4 jet j1and an AK8 V jet satisfying 120 <m(Vj1) < 240 GeV and pT(Vj1) > 150 GeV.
These selection criteria are derived from simulated TT events, using MC truth information.
The TT events are next classified based on the number of AK4 b-tagged jets (Nb), and number
of V → qq (NV), H → bb (NH), and t → qq0b (Nt) candidates identified using either the jet
substructure or resolved tagging algorithms. In an event, Nbcan be 1 or≥2, and NV, NH, and
Nt each can be 0 or≥1. Thus, in total, 2×2×2×2 = 16 categories of events are constructed.
For simplicity, overlaps between candidates of different types are allowed, e.g., the same AK8 jet could be tagged as both a top quark and an H candidate because of the overlapping mass windows. Such overlaps occur in a few percent of the signal events. However, by construction each event can belong to only one category. In the example above, the event would fall into a
category with both NH≥1 and Nt≥1 requirements satisfied. Further, the mistag rates and the
relevant corrections to the jet mass scale and resolution are applied to the H and t candidates, based on MC truth information.
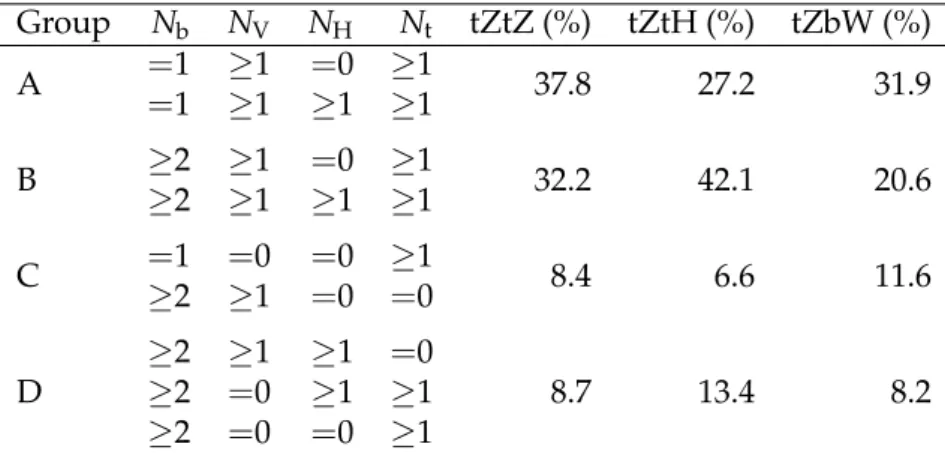
Table 2: The first four columns show different event groups used for the TT search, classified
according to the number of b-tagged jets Nband the number of V→qq, H→bb, and t→qq0b
candidates in the event, NV, NHand Nt, respectively, identified using both the jet substructure
and resolved tagger algorithms. The last three columns show the relative signal acceptance for a T quark of mass 1200 GeV for decay channels tZtZ, tZtH and tZbW as described in text.
Group Nb NV NH Nt tZtZ (%) tZtH (%) tZbW (%) A =1 ≥1 =0 ≥1 37.8 27.2 31.9 =1 ≥1 ≥1 ≥1 B ≥≥2 ≥1 =0 ≥1 32.2 42.1 20.6 2 ≥1 ≥1 ≥1 C =1 =0 =0 ≥1 8.4 6.6 11.6 ≥2 ≥1 =0 =0 D ≥2 ≥1 ≥1 =0 8.7 13.4 8.2 ≥2 =0 ≥1 ≥1 ≥2 =0 =0 ≥1
Next, the event categories are sorted using the figure of merit S/√B, where S and B are the
expected TT → tZtZ signal and background event yields, respectively, as determined from
the simulation. The categories with similar figures of merit based on expected upper lim-its at 95% confidence level (CL) are grouped together, while the categories that are found not to add sensitivity to the TT signal are discarded. A total of four event groups labeled A through D are selected, each with a different signal acceptance relative to the selection cri-teria described in Table 1 and depending on the T decay channel. Table 2 shows the selec-tions on these event groups, and the relative signal acceptances of the T quark decay chan-nels, namely, tZtZ, tZtH, or tZbW for a T quark of mass 1200 GeV. The decay channels are
defined with a benchmark combination of branching fractions B(T → tZ) = 100% (tZtZ),
B(T → tZ) = B(T → tH) = 50% (tZtH), and B(T → tZ) = B(T → bW) = 50% (tZbW). Events from all the decay channels mainly contribute to groups A and B, whereas groups C and D have slightly lower acceptance depending on the decay channel. The fraction of the
sig-nal identified by the jet substructure and resolved taggers depends on the T quark mass. For masses below 1200 GeV, the two taggers are equally efficient in identifying signal events for all the channels. For T quark masses above 1200 GeV, the jet substructure tagger becomes more efficient. For example, for T quark mass at 1800 GeV, the jet substructure tagger selects twice as many T quark candidates as the resolved tagger.
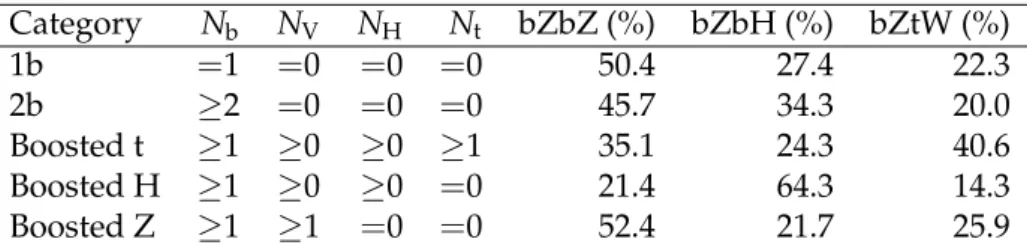
Table 3: The first four columns show different event categories used for the BB search, classified
according to the number of AK4 b-tagged jets Nband the number of V→qq, H→bb, and t→
qq0b candidates in the event, NV, NH, and Nt, respectively, identified using the jet substructure
algorithm. The last three columns show the relative signal acceptance for a B quark of mass 1200 GeV for decay channels bZbZ, bZbH and bZtW as described in text.
Category Nb NV NH Nt bZbZ (%) bZbH (%) bZtW (%) 1b =1 =0 =0 =0 50.4 27.4 22.3 2b ≥2 =0 =0 =0 45.7 34.3 20.0 Boosted t ≥1 ≥0 ≥0 ≥1 35.1 24.3 40.6 Boosted H ≥1 ≥0 ≥0 =0 21.4 64.3 14.3 Boosted Z ≥1 ≥1 =0 =0 52.4 21.7 25.9
Because the event topology of BB signal events is different from that of TT signal events, as discussed previously, the V, H, and t candidates in the BB analysis are identified using only the jet substructure tagger. Events are then separated into five categories, labeled 1b, 2b, boosted
t, boosted H, and boosted Z, based on the values of Nb, NV, NH, and Nt. Table 3 shows these
categories, and the relative signal acceptances of B quark decay channels, namely, bZbZ, bZbH, or bZtW for a B quark of mass 1200 GeV. The decay channels are defined with a benchmark
combination of branching fractionsB(B→bZ) =100% (bZbZ),B(B→ bZ) = B(B →bH) =
50% (bZbH), andB(B→bZ) = B(B→tW) =50% (bZtW).
5
Background modeling
The backgrounds from all sources are estimated using simulation, except for Z+jets where cor-rections to the simulated events are applied using data, as described below. The modeling of simulated background events is validated using several control regions in the data, which are constructed by inverting one or more of the requirements listed in Table 1. The control region
labeled CR0b+high-STis constructed by requiring zero b jets. The control region CR1b+low-ST
is constructed by inverting the ST requirement: ST ≤ 1000 GeV. The control region CR0b is
constructed by requiring zero b jets and removing the ST requirement. Signal contamination
from all channels in each of these control regions is less than 1%.
The AK4 jet multiplicity distribution is not modeled reliably in the Z+jets simulation, and there-fore it is corrected using scale factors obtained from data. Scale factors listed in Table 4 are determined using the CR0b control region, which is enriched with Z+jets events. After apply-ing these corrections, the distributions of kinematic variables in the control regions from the background simulations are in agreement with the data, as shown for example in Fig. 2 for the
ST distributions.
6
Systematic uncertainties
The systematic uncertainties in the SM background rates are due to the uncertainties in the
9
Table 4: The scale factors determined from data for correcting the AK4 jet multiplicity distribu-tion in the simuladistribu-tion. The quoted uncertainties in the scale factors are statistical only.
Number of AK4 jets Scale factor
3 0.92±0.01 4 1.03±0.01 5 1.12±0.02 6 1.30±0.05 ≥7 1.61±0.12 [GeV] T S Events / 50 GeV 0 200 400 600 800 1000 (13 TeV) -1 35.9 fb CMS DataDY+jets t t Z t t Other backgrounds Background uncertainty [GeV] T S 400 600 800 1000 Uncertainty Data - Bkg 1 − 0 1 ST [GeV] Events / 160 GeV 0 200 400 600 800 1000 1200 1400 1600 (13 TeV) -1 35.9 fb CMS DataDY+jets t t Z t t Other backgrounds Background uncertainty [GeV] T S 1000 1500 2000 2500 Uncertainty Data - Bkg 1 − 0 1
Figure 2: The ST distributions for the CR1b+low-ST (left) and CR0b+high-ST (right) control
regions for the data (points) and the background simulations (shaded histograms) after apply-ing the scale factors given in Table 4. The vertical bars on the points represent the statistical uncertainties in the data. The hatched bands indicate the total uncertainties in the simulated background contributions added in quadrature. The lower plots show the difference between the data and the simulated background, divided by the total uncertainty.
Table 5: Summary of systematic uncertainties considered in the statistical analysis of TT and BB search on the background and signal events. All uncertainties affect the normalizations of
the ST distributions. The tick mark indicates the uncertainties that also affect the shape, and
the uncertainty range accounts for their effects on the expected yields across all the TT groups or BB categories. The TT and BB signal events correspond to the benchmark decay channels
tZtZ and bZbZ, respectively, for T and B quark mass mT =mB =1200 GeV.
Source Shape Uncertainty (%)
TT BB
Background yield Signal yield Background yield Signal yield
tt+jets rate 15 — 15 — DY+jets rate 15 — 15 — Diboson rate 15 — 15 — Integrated luminosity 2.5 2.5 2.5 2.5 Lepton identification 3 3 3 3 Trigger efficiency 1 1 1 1 PDF X 4.8–6.6 4.5–7.8 3.2–7.1 4.6–9.5 µfand µr X 12.9–25.8 0.1–0.2 12.7–36.5 0.1–0.4 Pileup X 3.5–5.0 1.5–2.6 1.8–6.7 1.8–3.6
DY+Jets correction factor X 4.2–11.4 — 1.5–7.8 —
Jet energy scale X 5.4–8.2 1.6–4.0 4.9–9.1 3.3–4.4
Jet energy resolution X 2.0–3.8 0.6–1.8 3.2–6.7 1.7–3.8
V and H tagging X 1.5–2.5 0.3–1.3 0.2–6.3 0.2–8.4 t tagging X 0.5–3.0 4.8–7.6 0.2–6.3 0.2–8.4 misidentification of V X 0.6–2.3 0.1–0.2 0.3–4.9 0.0–5.3 misidentification of H X 0.0–0.7 0.0–0.7 0.0–14.4 0.0–14.4 misidentification of t X 1.0–2.3 0.2–0.4 6.8 6.8 b tagging X 4.1–6.2 1.0–7.2 8.3–23.6 1.8–10.2
diboson production [68]. They are estimated to be 15% in each case. The measured integrated luminosity uncertainty of 2.5% [69] affects both the signal and background rate predictions. The uncertainties associated with the measured data-to-simulation efficiency scale factors for the lepton identification and the trigger efficiencies are 3 and 1%, respectively.
The effect on the signal and background acceptance uncertainties due to the renormalization
and factorization scale (µf and µr) uncertainties and the PDF choices in the simulations are
taken into account in the statistical analysis. The influence of µf and µr scale uncertainties
are estimated by varying the default scales by the following six combinations of factors, (µf,
µr) × (1/2, 1/2), (1/2, 1), (1, 1/2), (2, 2), (2, 1), and (1, 2). The maximum and minimum of
the six variations are computed for each bin of the ST distribution, producing an uncertainty
“envelope”. The uncertainties due to the PDF choices in the simulations are estimated using the PDF4LHC procedure [27, 70–72], where the root-mean-square of 100 pseudo-experiments provided by the PDF sets represents the uncertainty envelope. The background and signal event counts are then varied relative to their nominal values up and down by a factor of two times the uncertainty envelopes. The impacts of these variations on the background and signal
shape are also taken into account. The effect of the µf and µr scale uncertainties on the TT
and BB signal yield is < 1%. However, this has the largest effect, amounting to as much as
36% on the background yield. The effect due to PDF choices amounts to a 3.2–9.5% change in the signal and background yields. The effect of the uncertainty in the pileup determination is estimated by varying the nominal pp inelastic cross section by 4.6% [42], which has an impact of 1.5–3.6% on the signal yields. Differences between simulation and data in the jet multiplicity distributions in DY+jets background events, derived in the CR0b region as shown in Table 4, are taken as an estimate of the associated systematic uncertainty, which ranges from 4.0–11.5%.
11
Several uncertainties are associated with the measurement of jet-related quantities. The jet en-ergy scale and resolution uncertainties are about 1% [54, 73]. The AK8 pruned jet mass scale and resolution uncertainties are evaluated to be 2.3 and 18% [63], respectively. The effect of these uncertainties on the TT and BB signal yields is 1.5–4.4% and 1.0–3.8%, respectively. These
uncertainties, in addition to the uncertainties in the τ21(8%) and τ32 (11%) selections [63], are
applied for the V-, H-, and t-tagged jets. The systematic uncertainties due to the jet shower
profile differences between the jets in the W→ qq0 and H→ bb processes are estimated from
the difference observed between results obtained with thePYTHIA8 andHERWIG++ generators
and are applied to the V- and H-tagged jets. The overall effect of V, H, and t tagging uncer-tainties on TT and BB signal yields is 0.2–8.4%. The unceruncer-tainties in the misidentification rates of boosted jets are 5, 14, and 7% for the W-, H-, and t-tagged jets, respectively. They are used to derive the uncertainties in the estimates of the numbers of mistagged jets in the signal and background simulated events, which result in uncertainties in the BB signal yields of up to 14%. The uncertainties in the b tagging efficiency scale factors are propagated to the final result, with the uncertainties in the b- and c-flavored quark jets treated as fully correlated. These
uncertain-ties are in the range 2–5% for b-flavored jets, a factor of two larger for c-flavored jets, and≈10%
for light-flavored jets. The uncertainties due to heavy- and light-flavored jets are considered uncorrelated. Table 5 summarizes the systematic uncertainties in the background and signal yields in the TT and BB searches. The ranges correspond to the impact on event yields due to systematic uncertainties that affect both the rates and shapes across all the TT groups or BB categories. Here the TT and BB signals correspond to the benchmark decay channels tZtZ and
bZbZ, respectively, for a T and B quark mass mT =mB =1200 GeV.
7
Results
7.1 T quark search
The number of observed events for the TT production search in the A, B, C, and D event groups are given for the electron and muon channels in Tables 6 and 7, respectively, along with the numbers of predicted background events. The expected numbers of signal events for T quark masses of 800 and 1200 GeV are also shown in the same tables, for three different decay
sce-narios, with branching fractionsB(T →tZ) =100% (tZtZ),B(T →tZ) = B(T → tH) =50%
(tZtH), andB(T→tZ) = B(T→bW) =50% (tZbW). The predicted background and observed
event yields agree within their uncertainties.
To determine the upper limits on the TT cross section, the electron and muon channels are
com-bined, and a simultaneous binned maximum-likelihood fit is performed on the STdistributions
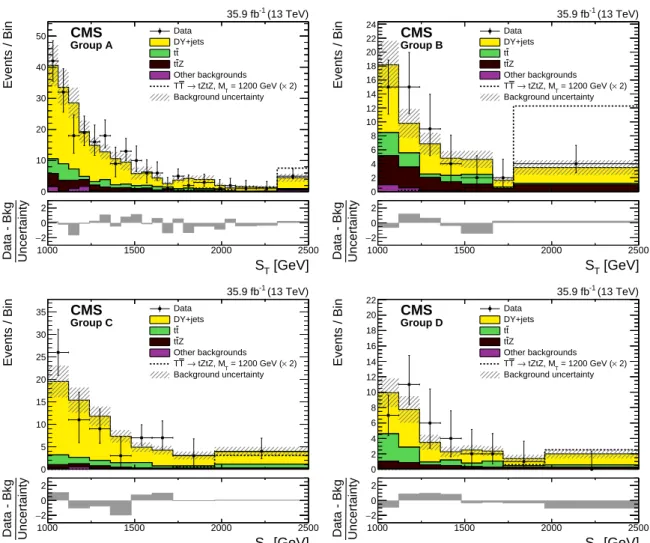
in data for the four event groups. The measured STdistributions in data are shown in Fig. 3 for
each of the event groups, along with the predicted background distributions and the expected
signal distributions for TT → tZtZ with mT = 1200 GeV. The impact of the statistical
uncer-tainty in the simulated samples is reduced by rebinning each STdistribution to ensure that the
statistical uncertainty associated with the expected background is less than 20% in each bin.
There is no indication of a signal in the STdistribution of any of the event groups.
The upper limits at 95% CL on the TT cross section are computed using a Bayesian
likelihood-based technique [74] with the THETA framework [75]. All the systematic uncertainties due
to normalization variations described in the previous section enter the likelihood as nuisance parameters with log-normal prior distributions, whereas the uncertainties from the shape vari-ations are assigned Gaussian-distributed priors. For the signal cross section parameter, we use a uniform prior distribution. The likelihood is marginalized with respect to the nuisance
pa-Table 6: The number of observed events and the predicted number of SM background events
in the TT search using Z → e+e−channel in the four event groups. The expected numbers of
signal events for T quark masses of 800 and 1200 GeV for three different decay scenarios with
assumed branching fractionsB(T → tZ) = 100% (tZtZ) , B(T → tZ) = B(T → tH) = 50%
(tZtH), and B(T → tZ) = B(T → bW) = 50% (tZbW) are also shown. The uncertainties in
the number of expected background events include the statistical and systematic uncertainties added in quadrature. Event group A B C D DY+jets 54.9±5.2 9.0±1.9 17.0±2.4 7.2±1.4 tt+jets 7.9±1.7 1.7±0.8 3.2±1.1 1.8±0.8 ttZ 8.2±0.8 4.9±0.6 1.3±0.2 1.3±0.2 Other backgrounds 3.0±1.7 0.9±0.7 0.6±0.4 0.1±0.1 Total 74.1±6.2 16.5±2.5 22.2±2.9 10.4±1.8 Data 84 15 25 11 tZtZ, mT=800 GeV 54.9±2.2 43.6±2.0 9.6±0.9 9.6±0.9 tZtH, mT=800 GeV 24.8±1.0 26.7±0.8 4.2±0.3 6.5±0.4 tZbW, mT=800 GeV 24.5±1.0 17.9±0.6 5.4±0.3 5.2±0.3 tZtZ, mT=1200 GeV 3.6±0.1 3.3±0.1 0.9±0.1 0.8±0.1 tZtH, mT=1200 GeV 1.6±0.1 1.8±0.1 0.4±0.1 0.6±0.1 tZbW, mT=1200 GeV 1.6±0.1 1.3±0.1 0.5±0.1 0.4±0.1
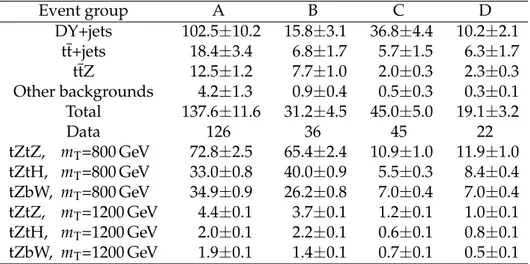
Table 7: The number of observed events and the predicted number of SM background events
in the TT search using Z→ µ+µ−channel in the four event groups. The expected numbers of
signal events for T quark masses of 800 and 1200 GeV for three different decay scenarios with
assumed branching fractionsB(T → tZ) = 100% (tZtZ) , B(T → tZ) = B(T → tH) = 50%
(tZtH), and B(T → tZ) = B(T → bW) = 50% (tZbW) are also shown. The uncertainties in
the number of expected background events include the statistical and systematic uncertainties added in quadrature. Event group A B C D DY+jets 102.5±10.2 15.8±3.1 36.8±4.4 10.2±2.1 tt+jets 18.4±3.4 6.8±1.7 5.7±1.5 6.3±1.7 ttZ 12.5±1.2 7.7±1.0 2.0±0.3 2.3±0.3 Other backgrounds 4.2±1.3 0.9±0.4 0.5±0.3 0.3±0.1 Total 137.6±11.6 31.2±4.5 45.0±5.0 19.1±3.2 Data 126 36 45 22 tZtZ, mT=800 GeV 72.8±2.5 65.4±2.4 10.9±1.0 11.9±1.0 tZtH, mT=800 GeV 33.0±0.8 40.0±0.9 5.5±0.3 8.4±0.4 tZbW, mT=800 GeV 34.9±0.9 26.2±0.8 7.0±0.4 7.0±0.4 tZtZ, mT=1200 GeV 4.4±0.1 3.7±0.1 1.2±0.1 1.0±0.1 tZtH, mT=1200 GeV 2.0±0.1 2.2±0.1 0.6±0.1 0.8±0.1 tZbW, mT=1200 GeV 1.9±0.1 1.4±0.1 0.7±0.1 0.5±0.1
7.1 T quark search 13 [GeV] T S Events / Bin 0 10 20 30 40 50 (13 TeV) -1 35.9 fb CMS Group A Data DY+jets t t Z t t Other backgrounds 2) × = 1200 GeV ( T tZtZ, M → T T Background uncertainty [GeV] T S 1000 1500 2000 2500 Uncertainty Data - Bkg 2 − 0 2 ST [GeV] Events / Bin 0 2 4 6 8 10 12 14 16 18 20 22 24 (13 TeV) -1 35.9 fb CMS Group B Data DY+jets t t Z t t Other backgrounds 2) × = 1200 GeV ( T tZtZ, M → T T Background uncertainty [GeV] T S 1000 1500 2000 2500 Uncertainty Data - Bkg 2 − 0 2 [GeV] T S Events / Bin 0 5 10 15 20 25 30 35 (13 TeV) -1 35.9 fb CMS Group C Data DY+jets t t Z t t Other backgrounds 2) × = 1200 GeV ( T tZtZ, M → T T Background uncertainty [GeV] T S 1000 1500 2000 2500 Uncertainty Data - Bkg 2 − 0 2 ST [GeV] Events / Bin 0 2 4 6 8 10 12 14 16 18 20 22 (13 TeV) -1 35.9 fb CMS Group D Data DY+jets t t Z t t Other backgrounds 2) × = 1200 GeV ( T tZtZ, M → T T Background uncertainty [GeV] T S 1000 1500 2000 2500 Uncertainty Data - Bkg 2 − 0 2
Figure 3: The ST distributions for groups A, B, C, D (left to right, upper to lower) from data
(points with vertical and horizontal bars), the expected SM backgrounds (shaded histograms),
and the expected signal, scaled up by a factor 2, for TT → tZtZ with mT = 1200 GeV (dotted
lines). The vertical bars on the points show the central 68% CL intervals for Poisson-distributed data. The horizontal bars give the bin widths. The hatched bands represent the statistical and systematic uncertainties in the total background contribution added in quadrature. The lower plots give the difference between the data and the total expected background, divided by the total background uncertainty.
rameters, and the limits are extracted from a simultaneous maximum-likelihood fit of the ST distributions in all four groups shown in Fig. 3.
The upper limits on the TT cross section are computed for different T quark mass values and for the three branching fraction scenarios listed above. The upper limits at 95% CL on the TT cross section are shown as a function of the T quark mass by the solid line in Fig. 4. The median expected upper limit is given by the dotted line, while the inner and outer bands corre-spond to one and two standard deviation uncertainties, respectively, in the expected limit. The dotted-dashed curve displays the predicted theoretical signal cross section [30]. Comparing the observed cross section limits to the theoretical signal cross section, we exclude T quarks with masses less than 1280, 1185, and 1120 GeV, respectively, for the three branching ratio hypothe-ses listed above. The expected upper limits are 1290, 1175, and 1115 GeV for the respective scenarios. [GeV] T m 800 1000 1200 1400 1600 1800 [pb] σ 3 − 10 2 − 10 1 − 10 1 CMS (13 TeV) -1 35.9 fb Observed limit (95% CL) Median expected 68% expected 95% expected (tZ) = 1.0 Β , T T [GeV] T m 800 1000 1200 1400 1600 1800 [pb] σ 3 − 10 2 − 10 1 − 10 1 CMS (13 TeV) -1 35.9 fb Observed limit (95% CL) Median expected 68% expected 95% expected (tH) = 0.5 Β (tZ) = Β , T T [GeV] T m 800 1000 1200 1400 1600 1800 [pb] σ 3 − 10 2 − 10 1 − 10 1 CMS (13 TeV) -1 35.9 fb Observed limit (95% CL) Median expected 68% expected 95% expected (bW) = 0.5 Β (tZ) = Β , T T
Figure 4: The observed (solid line) and expected (dashed line) 95% CL upper limits on the TT
cross section as a function of the T quark mass assuming (upper left) B(T → tZ) = 100%,
(upper right)B(T→tZ) = B(T→tH) =50%, and (lower)B(T→tZ) = B(T→bW) =50%.
The dotted-dashed curve displays the theoretical TT production cross section. The inner and outer bands show the one and two standard deviation uncertainties in the expected limits, respectively.
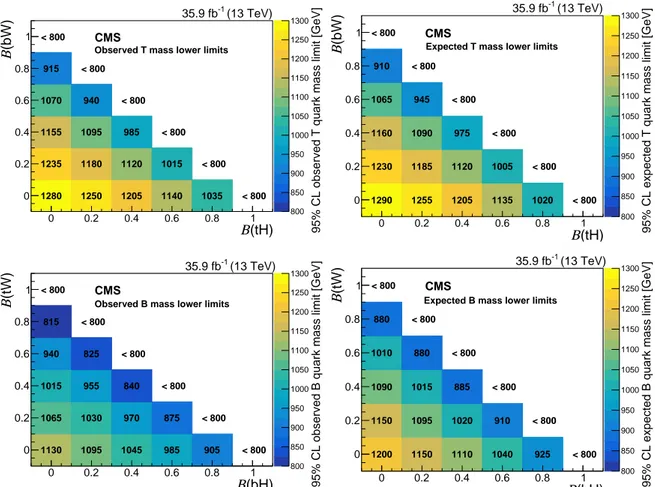
Figure 5 (upper) displays the observed (left) and expected (right) 95% CL lower limits on the
T quark mass as a function of the relevant branching fractions, assumingB(T→tZ) + B(T→
tH) + B(T→bW) =1.0. For a T quark decaying exclusively via T→tZ, the lower mass limit is 1280 GeV.
7.1 T quark search 15 800 850 900 950 1000 1050 1100 1150 1200 1250 1300 (tH) Β 0 0.2 0.4 0.6 0.8 1 (bW) Β 0 0.2 0.4 0.6 0.8 1 1280 1250 1205 1140 1035 < 800 1235 1180 1120 1015 < 800 1155 1095 985 < 800 1070 940 < 800 915 < 800 < 800 (13 TeV) -1 35.9 fb
95% CL observed T quark mass limit [GeV]
CMS
Observed T mass lower limits
800 850 900 950 1000 1050 1100 1150 1200 1250 1300 (tH) Β 0 0.2 0.4 0.6 0.8 1 (bW) Β 0 0.2 0.4 0.6 0.8 1 1290 1255 1205 1135 1020 < 800 1230 1185 1120 1005 < 800 1160 1090 975 < 800 1065 945 < 800 910 < 800 < 800 (13 TeV) -1 35.9 fb
95% CL expected T quark mass limit [GeV]
CMS
Expected T mass lower limits
0 0.2 0.4 0.6 0.8 1 (bH) Β 0 0.2 0.4 0.6 0.8 1 (tW) Β 800 850 900 950 1000 1050 1100 1150 1200 1250 1300 1130 1065 1015 940 815 < 800 1095 1030 955 825 < 800 1045 970 840 < 800 985 875 < 800 905 < 800 < 800 (13 TeV) -1 35.9 fb
95% CL observed B quark mass limit [GeV]
CMS
Observed B mass lower limits
0 0.2 0.4 0.6 0.8 1 (bH) Β 0 0.2 0.4 0.6 0.8 1 (tW) Β 800 850 900 950 1000 1050 1100 1150 1200 1250 1300 1200 1150 1090 1010 880 < 800 1150 1095 1015 880 < 800 1110 1020 885 < 800 1040 910 < 800 925 < 800 < 800 (13 TeV) -1 35.9 fb
95% CL expected B quark mass limit [GeV]
CMS
Expected B mass lower limits
Figure 5: The observed (left) and expected (right) 95% CL lower limits on the mass of the T (upper) and B (lower) quark, in GeV, for various branching fraction scenarios, assuming
B(T→tZ) + B(T→tH) + B(T→bW) =1 andB(B→bZ) + B(B→bH) + B(B→tW) =1, respectively.
7.2 B quark search
The numbers of observed and predicted background events in the five event categories for
the BB search using Z → e+e− and Z → µ+µ− are given in Tables 8 and 9, respectively.
The expected number of signal events in each category is also shown for B masses of 800 and 1200 GeV. The branching fraction hypotheses assumed for the three decay channels are
B(B → bZ) = 100% (bZbZ),B(B → bZ) = B(B → bH) = 50% (bZbH), andB(B → bZ) =
B(B→tW) =50% (bZtW). The numbers of observed and expected background events are
con-sistent with each other for every event category. As with the TT search, 95% CL upper limits on the BB production cross section are determined using a simultaneous binned
maximum-likelihood fit to the STdistributions for the different event categories, shown in Fig. 6.
Table 8: The numbers of observed events and the predicted number of SM background events
in the BB search for the five event categories using Z →e+e−channel. The expected numbers
of signal events for B masses of 800 and 1200 GeV with branching fraction hypotheses for the
three decay channels,B(B →bZ) = 100% (bZbZ),B(B→ bZ) = B(B→ bH) = 50% (bZbH),
andB(B→bZ) = B(B→tW) =50% (bZtW) are also shown. The uncertainties in the number of expected background events include the statistical and systematic uncertainties added in quadrature.
Event category 1b 2b Boosted t Boosted H Boosted V
DY+jets 155.2±10.4 23.5±3.2 9.5±1.8 1.9±1.0 37.8±4.4 tt+jets 16.7±3.1 6.9±2.1 0.5±0.6 0.3±0.6 5.1±1.8 ttZ 6.0±0.7 3.4±0.5 3.3±0.5 0.0±0.4 5.2±0.6 Other backgrounds 6.7±3.8 1.3±1.3 0.9±0.6 0.0±0.4 3.6±2.5 Total 184.6±12.7 35.1±4.2 14.2±2.1 2.5±1.1 51.7±5.3 Data 192 37 19 6 54 bZbZ, mB=800 GeV 39.3±1.8 24.6±1.4 7.3±0.8 2.1±0.4 58.2±2.3 bZbH, mB=800 GeV 20.5±0.7 18.2±0.6 4.7±0.3 4.6±0.3 23.3±0.7 bZtW, mB=800 GeV 18.8±0.6 11.5±0.5 7.1±0.4 1.0±0.2 29.9±0.8 bZbZ, mB=1200 GeV 2.6±0.1 1.3±0.1 0.6±0.1 0.2±0.1 3.9±0.2 bZbH, mB=1200 GeV 1.4±0.1 1.1±0.1 0.4±0.1 0.4±0.1 1.6±0.1 bZtW, mB=1200 GeV 1.2±0.1 0.6±0.1 0.7±0.1 0.1±0.1 1.9±0.1
The upper limits at 95% CL on the BB cross section are shown by the solid line in Fig. 7. As before, the inner and outer bands give the one and two standard deviation uncertainties, re-spectively, in the expected upper limits. The dotted curve displays the theoretical signal cross section. Comparing the observed cross section limits to the signal cross section, we exclude B quarks with masses less than 1130, 1015, and 975 GeV in the bZbZ, bZbH, and bZtW channels, respectively. The corresponding expected values are 1200, 1085, and 1055 GeV.
Figure 5 (lower) displays the observed (left) and expected (right) 95% CL lower limits on the B
quark mass as a function of the relevant branching fractions, assumingB(B → bZ) + B(B →
bH) + B(B→tW) =1.0. For a B quark decaying exclusively via B→bZ, the lower mass limit is 1130 GeV.
8
Summary
The results of a search have been presented for the pair production of vector-like top (T) and
bottom (B) quark partners in proton-proton collisions at√s = 13 TeV, using data collected by
17
work
0 20 40 60 80 100 120 140 160 180 Events / Bin Data DY+jets t t Z t t Other backgrounds = 1200 GeV (x 5) B bZbZ, M → B B Background uncertainty (13 TeV) -1 35.9 fb CMS 1b 1000 1500 2000 2500 [GeV] T S 2 − 0 2 Uncertainty Data - Bkgwork
0 5 10 15 20 25 30 35 40 45 Events / Bin Data DY+jets t t Z t t Other backgrounds = 1200 GeV (x 5) B bZbZ, M → B B Background uncertainty (13 TeV) -1 35.9 fb CMS 2b 1000 1500 2000 2500 [GeV] T S 2 − 0 2 Uncertainty Data - Bkgwork
0 2 4 6 8 10 12 14 16 18 20 Events / Bin Data DY+jets t t Z t t Other backgrounds = 1200 GeV (x 5) B bZbZ, M → B B Background uncertainty (13 TeV) -1 35.9 fb CMS Boosted t 1000 1500 2000 2500 [GeV] T S 2 − 0 2 Uncertainty Data - Bkgwork
0 2 4 6 8 10 12 14 Events / Bin Data DY+jets t t Z t t Other backgrounds = 1200 GeV (x 5) B bZbZ, M → B B Background uncertainty (13 TeV) -1 35.9 fb CMS Boosted H 1000 1500 2000 2500 [GeV] T S 2 − 0 2 Uncertainty Data - Bkgwork
0 10 20 30 40 50 60 Events / Bin Data DY+jets t t Z t t Other backgrounds = 1200 GeV (x 5) B bZbZ, M → B B Background uncertainty (13 TeV) -1 35.9 fb CMS Boosted Z 1000 1500 2000 2500 [GeV] T S 2 − 0 2 Uncertainty Data - BkgFigure 6: The STdistributions for the 1b, 2b, boosted t, boosted H and boosted Z (left to right,
upper to lower) event categories for the data (points with vertical and horizontal bars), and the expected background (shaded histograms). The vertical bars give the statistical uncertainty in
the data, and the horizontal bars show the bin widths. The expected signal for BB → bZbZ
with mB = 1200 GeV multiplied by a factor of 5 is shown by the dashed line. The statistical
and systematic uncertainties in the SM background prediction, added in quadrature, are rep-resented by the hatched bands. The lower panel in each plot show the difference between the data and the expected background, divided by the total uncertainty.
Table 9: The number of observed events and the predicted number of SM background events
in the BB search for the five event categories using Z→µ+µ−channel. The expected numbers
of signal events for B masses of 800 and 1200 GeV with branching fraction hypotheses for the
three decay channels,B(B →bZ) = 100% (bZbZ),B(B→ bZ) = B(B→ bH) = 50% (bZbH),
andB(B→bZ) = B(B→tW) =50% (bZtW) are also shown. The uncertainties in the number of expected background events include the statistical and systematic uncertainties added in quadrature.
Event category 1b 2b Boosted t Boosted H Boosted V
DY+jets 280.6±20.2 38.1±4.6 19.8±3.2 5.0±1.6 71.5±7.6 tt+jets 45.1±5.6 20.0±3.4 3.9±1.3 0.6±0.8 10.8±2.9 ttZ 9.0±0.9 5.3±0.6 5.4±0.6 0.4±0.4 8.0±0.8 Other backgrounds 6.1±4.2 1.2±0.6 0.9±0.5 0.1±0.4 4.5±3.1 Total 340.7±22.3 64.5±6.4 30.0±3.7 6.1±1.8 94.7±9.1 Data 374 70 27 8 92 bZbZ, mB=800 GeV 56.7±2.1 38.8±1.8 8.7±0.9 2.3±0.4 73.3±2.6 bZbH, mB=800 GeV 27.9±0.8 27.5±0.8 6.8±0.4 6.7±0.4 30.2±0.8 bZtW, mB=800 GeV 26.3±0.7 16.2±0.6 9.4±0.5 1.2±0.2 38.6±0.9 bZbZ, mB=1200 GeV 3.3±0.1 1.9±0.1 0.7±0.1 0.1±0.1 4.8±0.2 bZbH, mB=1200 GeV 1.7±0.1 1.3±0.1 0.5±0.1 0.5±0.1 2.0±0.1 bZtW, mB=1200 GeV 1.5±0.1 0.8±0.1 0.8±0.1 0.1±0.1 2.4±0.1 800 900 1000 1100 1200 1300 1400 [GeV] B m 3 − 10 2 − 10 1 − 10 1 [pb] σ CMS (13 TeV) -1 35.9 fb Observed limit (95% CL) Median expected 68% expected 95% expected (bZ) = 1.0 Β , B B 800 900 1000 1100 1200 1300 1400 [GeV] B m 3 − 10 2 − 10 1 − 10 1 [pb] σ CMS (13 TeV) -1 35.9 fb Observed limit (95% CL) Median expected 68% expected 95% expected (bH) = 0.5 Β (bZ) = Β , B B 800 900 1000 1100 1200 1300 1400 [GeV] B m 3 − 10 2 − 10 1 − 10 1 [pb] σ CMS (13 TeV) -1 35.9 fb Observed limit (95% CL) Median expected 68% expected 95% expected (tW) = 0.5 Β (bZ) = Β , B B
Figure 7: The observed (solid line) and expected (dashed line) 95% CL upper limits on the BB
production cross section versus the B quark mass for (upper left)B(B→ bZ) =100%, (upper
right)B(B →bZ) = B(B→ bH) =50%, and (lower)B(B → bZ) = B(B →tW) =50%. The
dotted-dashed line displays the theoretical cross section. The inner and outer bands show the one and two standard deviation uncertainties in the expected limits, respectively.
19
The TT search is performed by looking for events in which one T quark decays via T→tZ and
the other decays via T → bW, tZ, tH, where H refers to the Higgs boson. The BB search
looks for events in which one B quark decays via B → bZ and the other via B → tW, bZ, or
bH. Events with two oppositely charged electrons or muons, consistent with coming from the decay of a Z boson, and jets are investigated, and are categorized according to the numbers of top quark and W, Z, and Higgs boson candidates. These categories are individually optimized for TT and BB event topologies.
The data are in agreement with the standard model background predictions for all the event categories. Upper limits at 95% confidence level on the TT and BB production cross sections are obtained from a simultaneous binned maximum-likelihood fit to the observed distributions for the different event categories, under the assumption of various T and B quark branching fractions. Comparing these upper limits to the theoretical predictions for the TT and BB cross sections as a function of the T and B quark masses, lower limits on the masses at 95% confi-dence level are determined for different branching fraction scenarios. In the case of a T quark
decaying exclusively via T→tZ, the lower mass limit is 1280 GeV, while for a B quark decaying
only via B→bZ, it is 1130 GeV. These lower limits are comparable with those measured by the
ATLAS Collaboration [20], also using the Z boson dilepton decay channel. The results of the analysis presented in this paper are complementary to previous CMS measurements [21–23], and have extended sensitivity in reaching higher mass limits for T and B quarks.
Acknowledgments
We congratulate our colleagues in the CERN accelerator departments for the excellent perfor-mance of the LHC and thank the technical and administrative staffs at CERN and at other CMS institutes for their contributions to the success of the CMS effort. In addition, we gratefully acknowledge the computing centers and personnel of the Worldwide LHC Computing Grid for delivering so effectively the computing infrastructure essential to our analyses. Finally, we acknowledge the enduring support for the construction and operation of the LHC and the CMS detector provided by the following funding agencies: BMBWF and FWF (Austria); FNRS and FWO (Belgium); CNPq, CAPES, FAPERJ, FAPERGS, and FAPESP (Brazil); MES (Bulgaria); CERN; CAS, MoST, and NSFC (China); COLCIENCIAS (Colombia); MSES and CSF (Croa-tia); RPF (Cyprus); SENESCYT (Ecuador); MoER, ERC IUT, and ERDF (Estonia); Academy of Finland, MEC, and HIP (Finland); CEA and CNRS/IN2P3 (France); BMBF, DFG, and HGF (Germany); GSRT (Greece); NKFIA (Hungary); DAE and DST (India); IPM (Iran); SFI (Ireland); INFN (Italy); MSIP and NRF (Republic of Korea); MES (Latvia); LAS (Lithuania); MOE and UM (Malaysia); BUAP, CINVESTAV, CONACYT, LNS, SEP, and UASLP-FAI (Mexico); MOS (Mon-tenegro); MBIE (New Zealand); PAEC (Pakistan); MSHE and NSC (Poland); FCT (Portugal); JINR (Dubna); MON, RosAtom, RAS, RFBR, and NRC KI (Russia); MESTD (Serbia); SEIDI, CPAN, PCTI, and FEDER (Spain); MOSTR (Sri Lanka); Swiss Funding Agencies (Switzerland); MST (Taipei); ThEPCenter, IPST, STAR, and NSTDA (Thailand); TUBITAK and TAEK (Turkey); NASU and SFFR (Ukraine); STFC (United Kingdom); DOE and NSF (USA).
Individuals have received support from the Marie-Curie program and the European Research Council and Horizon 2020 Grant, contract No. 675440 (European Union); the Leventis Foun-dation; the A. P. Sloan FounFoun-dation; the Alexander von Humboldt FounFoun-dation; the Belgian Fed-eral Science Policy Office; the Fonds pour la Formation `a la Recherche dans l’Industrie et dans l’Agriculture (FRIA-Belgium); the Agentschap voor Innovatie door Wetenschap en Technologie (IWTBelgium); the F.R.S.FNRS and FWO (Belgium) under the “Excellence of Science EOS” -be.h project n. 30820817; the Ministry of Education, Youth and Sports (MEYS) of the Czech
Re-public; the Lend ¨ulet (“Momentum”) Program and the J´anos Bolyai Research Scholarship of the
Hungarian Academy of Sciences, the New National Excellence Program ´UNKP, the NKFIA
re-search grants 123842, 123959, 124845, 124850 and 125105 (Hungary); the Council of Science and Industrial Research, India; the HOMING PLUS program of the Foundation for Polish Science, cofinanced from European Union, Regional Development Fund, the Mobility Plus program of the Ministry of Science and Higher Education, the National Science Center (Poland), contracts Harmonia 2014/14/M/ST2/00428, Opus 2014/13/B/ST2/02543, 2014/15/B/ST2/03998, and 2015/19/B/ST2/02861, Sonata-bis 2012/07/E/ST2/01406; the National Priorities Research Program by Qatar National Research Fund; the Programa Estatal de Fomento de la Investi-gaci ´on Cient´ıfica y T´ecnica de Excelencia Mar´ıa de Maeztu, grant MDM-2015-0509 and the Pro-grama Severo Ochoa del Principado de Asturias; the Thalis and Aristeia programs cofinanced by EU-ESF and the Greek NSRF; the Rachadapisek Sompot Fund for Postdoctoral Fellowship, Chulalongkorn University and the Chulalongkorn Academic into Its 2nd Century Project Ad-vancement Project (Thailand); the Welch Foundation, contract C-1845; and the Weston Havens Foundation (USA).
References
[1] ATLAS Collaboration, “Observation of a new particle in the search for the Standard Model Higgs boson with the ATLAS detector at the LHC”, Phys. Lett. B 716 (2012) 1,
doi:10.1016/j.physletb.2012.08.020, arXiv:1207.7214.
[2] CMS Collaboration, “Observation of a new boson at a mass of 125 GeV with the CMS experiment at the LHC”, Phys. Lett. B 716 (2012) 30,
doi:10.1016/j.physletb.2012.08.021, arXiv:1207.7235.
[3] CMS Collaboration, “Observation of a new boson with mass near 125 GeV in pp
collisions at√s = 7 and 8 TeV”, JHEP 06 (2013) 081,
doi:10.1007/JHEP06(2013)081, arXiv:1303.4571.
[4] ATLAS and CMS Collaborations, “Combined measurement of the Higgs boson mass in
pp collisions at√s =7 and 8 TeV with the ATLAS and CMS Experiments”, Phys. Rev.
Lett. 114 (2015) 191803, doi:10.1103/PhysRevLett.114.191803, arXiv:1503.07589.
[5] CMS Collaboration, “Measurements of properties of the Higgs boson decaying into the
four-lepton final state in pp collisions at√s = 13 TeV”, JHEP 11 (2017) 047,
doi:10.1007/JHEP11(2017)047, arXiv:1706.09936.
[6] J. A. Aguilar-Saavedra, R. Benbrik, S. Heinemeyer, and M. P´erez-Victoria, “Handbook of vectorlike quarks: Mixing and single production”, Phys. Rev. D 88 (2013) 094010,
doi:10.1103/PhysRevD.88.094010, arXiv:1306.0572.
[7] J. Kang, P. Langacker, and B. D. Nelson, “Theory and phenomenology of exotic isosinglet quarks and squarks”, Phys. Rev. D 77 (2008) 035003,
doi:10.1103/PhysRevD.77.035003, arXiv:0708.2701v2.
[8] D. Choudhury, T. Tait, and C. Wagner, “Beautiful mirrors and precision electroweak data”, Phys. Rev. D 65 (2002) 053002, doi:10.1103/PhysRevD.65.053002, arXiv:hep-ph/0109097.
References 21
[9] L. Randall and R. Sundrum, “A large mass hierarchy from a small extra dimension”, Phys. Rev. Lett. 83 (1999) 3370, doi:10.1103/PhysRevLett.83.3370,
arXiv:hep-ph/9905221.
[10] N. Arkani-Hamed, A. G. Cohen, E. Katz, and A. E. Nelson, “The littlest Higgs”, JHEP 07 (2002) 034, doi:10.1088/1126-6708/2002/07/034, arXiv:hep-ph/0206021. [11] M. Schmaltz, “Physics beyond the standard model (theory): Introducing the Little
Higgs”, Nucl. Phys. Proc. Suppl. 117 (2003) 40,
doi:10.1016/S0920-5632(03)01409-9, arXiv:hep-ph/0210415.
[12] M. Schmaltz and D. Tucker-Smith, “Little Higgs review”, Ann. Rev. Nucl. Part. Sci. 55 (2005) 229, doi:10.1146/annurev.nucl.55.090704.151502,
arXiv:hep-ph/0502182.
[13] M. S. D. Marzocca and J. Shu, “General composite Higgs models”, JHEP 08 (2012) 013, doi:10.1007/JHEP08(2012)013, arXiv:1205.0770.
[14] D. Guadagnoli, R. N. Mohapatra, and I. Sung, “Gauged flavor group with left-right symmetry”, JHEP 04 (2011) 093, doi:10.1007/JHEP04(2011)093,
arXiv:1103.4170.
[15] R. T. D’Agnolo and A. Hook, “Finding the strong CP problem at the LHC”, Phys. Lett. B
762(2016) 421, doi:10.1016/j.physletb.2016.09.061, arXiv:1507.00336.
[16] Y. Okada and L. Panizzi, “LHC signatures of vector-like quarks”, Adv. High Energy Phys.
2013(2013) 364936, doi:10.1155/2013/364936, arXiv:1207.5607.
[17] ATLAS Collaboration, “Search for pair production of vector-like top quarks in events
with one lepton, jets, and missing transverse momentum in√s=13 TeV pp collisions
with the atlas detector”, JHEP 08 (2017) 052, doi:10.1007/JHEP08(2017)052, arXiv:1705.10751.
[18] ATLAS Collaboration, “Search for pair production of heavy vector-like quarks decaying
to high-p√ TW bosons and b quarks in the lepton-plus-jets final state in pp collisions at
s =13 TeV with the atlas detector”, JHEP 10 (2017) 141,
doi:10.1007/JHEP10(2017)141, arXiv:1707.03347.
[19] ATLAS Collaboration, “Search for pair production of vector-like quarks into high-pT W
bosons and top quarks in the lepton-plus-jets final state in pp collisions at√s=13 TeV
with the ATLAS detector”, JHEP 08 (2018) 48, doi:10.1007/JHEP08(2018)048, arXiv:1806.01762.
[20] ATLAS Collaboration, “Search for pair and single production of vector-like quarks in final states with at least one Z boson decaying into a pair of electrons or muons in pp
collision data collected with the ATLAS detector at√s=13 TeV”, Phys. Rev. D 98 (2018)
doi:10.1103/PhysRevD.98.112004, arXiv:1806.10555.
[21] CMS Collaboration, “Search for pair production of vector-like T and B quarks in
single-lepton final states using boosted jet substructure in proton-proton collisions at√
s =13 TeV”, JHEP 11 (2017) 085, doi:10.1007/JHEP11(2017)085,
[22] CMS Collaboration, “Search for pair production of vector-like quarks in the bWbW
channel from proton-proton collisions at√s =13 TeV”, Phys. Lett. B 779 (2018) 82,
doi:10.1016/j.physletb.2018.01.077, arXiv:1710.01539.
[23] CMS Collaboration, “Search for vector-like T and B quark pairs in final states with
leptons at√s=13 TeV”, JHEP 08 (2018) 177, doi:10.1007/JHEP08(2018)177,
arXiv:1805.04758.
[24] CMS Collaboration, “The CMS experiment at the CERN LHC”, JINST 3 (2008) S08004,
doi:10.1088/1748-0221/3/08/S08004.
[25] CMS Collaboration, “The CMS trigger system”, JINST 12 (2017) P01020, doi:10.1088/1748-0221/12/01/P01020, arXiv:1609.02366.
[26] J. Alwall et al., “The automated computation of tree-level and next-to-leading order differential cross sections, and their matching to parton shower simulations”, JHEP 07 (2014) 079, doi:10.1007/JHEP07(2014)079, arXiv:1405.0301.
[27] NNPDF Collaboration, “Parton distributions for the LHC Run II”, JHEP 04 (2015) 040,
doi:10.1007/JHEP04(2015)040, arXiv:1410.8849.
[28] T. Sj ¨ostrand et al., “An introduction to PYTHIA 8.2”, Comput. Phys. Commun. 191 (2015) 159, doi:10.1016/j.cpc.2015.01.024, arXiv:1410.3012.
[29] CMS Collaboration, “Event generator tunes obtained from underlying event and multiparton scattering measurements”, Eur. Phys. J. C 76 (2016) 155,
doi:10.1140/epjc/s10052-016-3988-x, arXiv:1512.00815.
[30] M. Czakon, P. Fiedler, and A. Mitov, “Total top quark pair production cross section at
hadron colliders through O(α4S)”, Phys. Rev. Lett. 110 (2013) 252004,
doi:10.1103/PhysRevLett.110.252004, arXiv:1303.6254.
[31] M. R. Whalley, D. Bourilkov, and R. C. Group, “The Les Houches accord PDFs (LHAPDF) and LHAGLUE”, (2005). arXiv:hep-ph/0508110.
[32] S. Frixione and B. R. Webber, “Matching NLO QCD computations and parton shower simulations”, JHEP 06 (2002) 029, doi:10.1088/1126-6708/2002/06/029,
arXiv:hep-ph/0204244.
[33] R. Frederix and S. Frixione, “Merging meets matching in MC@NLO”, JHEP 12 (2012) 061, doi:10.1007/JHEP12(2012)061, arXiv:1209.6215.
[34] S. Frixione, G. Ridolfi, and P. Nason, “A positive-weight next-to-leading-order Monte Carlo for heavy flavour hadroproduction”, JHEP 09 (2007) 126,
doi:10.1088/1126-6708/2007/09/126, arXiv:0707.3088.
[35] S. Frixione, P. Nason, and C. Oleari, “Matching NLO QCD computations with parton shower simulations: the POWHEG method”, JHEP 11 (2007) 070,
doi:10.1088/1126-6708/2007/11/070, arXiv:0709.2092.
[36] S. Alioli, P. Nason, C. Oleari, and E. Re, “A general framework for implementing NLO calculations in shower Monte Carlo programs: the POWHEG BOX”, JHEP 06 (2010) 043,
References 23
[37] CMS Collaboration, “Investigations of the impact of the parton shower tuning in
PYTHIA 8 in the modelling of t¯t at√s=8 and 13 TeV”, CMS Detector Performance
Summary CMS-PAS-TOP-16-021, CERN, 2016.
[38] J. Alwall et al., “Comparative study of various algorithms for the merging of parton showers and matrix elements in hadronic collisions”, Eur. Phys. J. C 53 (2008) 473, doi:10.1140/epjc/s10052-007-0490-5, arXiv:0706.2569.
[39] J. M. Campbell, R. K. Ellis, and C. Williams, “Vector boson pair production at the LHC”, JHEP 07 (2011) 018, doi:10.1007/JHEP07(2011)018, arXiv:1105.0020.
[40] F. Cascioli et al., “ZZ production at hadron colliders in NNLO QCD”, Phys. Lett. B 735 (2014) 311, doi:10.1016/j.physletb.2014.06.056, arXiv:1405.2219v2.
[41] T. Gehrmann et al., “W+W−production at hadron colliders in NNLO QCD”, Phys. Rev.
Lett. 113 (2014) 212001, doi:10.1103/PhysRevLett.113.212001, arXiv:1408.5243.
[42] D. de Florian et al., “Handbook of LHC Higgs cross sections: 4. Deciphering the nature of the Higgs sector”, CERN Report CERN-2017-002-M, CERN, 2016.
doi:10.23731/CYRM-2017-002, arXiv:1610.07922.
[43] GEANT4 Collaboration, “GEANT4 – a simulation toolkit”, Nucl. Instrum. Meth. A 506 (2003) 250, doi:10.1016/S0168-9002(03)01368-8.
[44] J. Allison et al., “GEANT4 developments and applications”, IEEE Trans. Nucl. Sci. 53 (2006) 270, doi:10.1109/TNS.2006.869826.
[45] CMS Collaboration, “Particle-flow reconstruction and global event description with the CMS detector”, JINST 12 (2017) P10003, doi:10.1088/1748-0221/12/10/P10003, arXiv:1706.04965.
[46] CMS Collaboration, “Description and performance of track and primary-vertex reconstruction with the CMS tracker”, JINST 9 (2014) P10009,
doi:10.1088/1748-0221/9/10/P10009, arXiv:1405.6569.
[47] M. Cacciari, G. P. Salam, and G. Soyez, “The anti-kTjet clustering algorithm”, JHEP 04
(2008) 063, doi:10.1088/1126-6708/2008/04/063, arXiv:0802.1189.
[48] M. Cacciari, G. P. Salam, and G. Soyez, “FastJet user manual”, Eur. Phys. J. C 72 (2012) 1896, doi:10.1140/epjc/s10052-012-1896-2, arXiv:1111.6097.
[49] CMS Collaboration, “Performance of electron reconstruction and selection with the CMS
detector in proton-proton collisions at√s=8 TeV”, JINST 10 (2015) P06005,
doi:10.1088/1748-0221/10/06/P06005, arXiv:1502.02701.
[50] CMS Collaboration, “Commissioning of the particle-flow event reconstruction with the first LHC collisions recorded in the CMS detector”, CMS Physics Analysis Summary CMS-PAS-PFT-10-001, CERN, 2010.
[51] CMS Collaboration, “Performance of the CMS muon detector and muon reconstruction
with proton-proton collisions at√s=13 TeV”, JINST 13 (2018) P06015,