osteoporosis
Semra Eroglu, MD, Gulsah Karatas, MD.
ABSTRACT
ةيوافمللا ايلالخا/تاحيفصلا نم لك رود صحف :فادهلأا
تايوتسمو ،
)N/L(تايوافمللا / تلادعلا ةبسنو
)P/L(ماظعلا يف نداعلما ةفاثك ضافخنا يف
D )Vit-D(ينماتيف
.ءاسنلا ىدل )
BMD(
نيذلا سأيلا نس دعب ينيجرالخا ىضرلما نم
252مييقت تم :ةقيرطلا
يعيبطلا جلاعلاو ءاسنلا ضارمأو ديلوتلا تادايع يف مهلوبق تم
.يعجر رثأب
م2017ربمسيد ىتح
م2016ويلوي نم ةرتفلا للاخ
، )
92=ددعلا( يعيبط
-Tةجرد قلعتي اميف ىضرلما عيمتج تم
صحف تم .)
48=ددعلا(
PMOو ،)
112=ددعلا( ماظعلا نهو
ةليصلحاو
P/L،
N/L،
Vit-D،
BMDنم لصلما تايوتسم
.يعجر رثأب ىضرلما نم مدلل ةلماكلا
Vit-Dتايوتسم تناكو ريثكب ىلعأ
P/Lطسوتم ناك :جئاتنلا
52.89-385
(
130.75[
PMOةعومجم يف ظوحلم لكشب لقأ
لباقم )
4-34(
15.4و
p=0.02و )
54-232.5(
123.05لباقم
لماع طبر تم ينح يف .يلاوتلا ىلع ، )
p=0.003،
)4-47(20.1ةيباجيإ ةقلاع ىلع روثعلا تم ، يبلس لكشب
P/Lو مظعلا ةفاثك
عم د ينماتيف تايوتسبم ايبلس تطبتراو .
Vit-Dو
BMDينب
ةدايز نأ اندجوو .يلاوتلا ىلع ،
N/L p=0.04و
P/L p<0.001 P/L >125.06ميقو
Dينماتيف صقنو ، )ةنس
>65( رمعلا
.رادحنلاا ليلتح يف
PMOل ةلقتسم ةينهكت لماوع
ؤبنتلا يف ةدعاسملل ةياغلل ةطيسب ةملاع
P/Lنأ ودبي :ةتمالخا
دوجو انتسارد ترهظأ امكو .ثمطلا عاطقنا دعب
PMO.
PMOل ةيمهلأا غلاب رمأ )د( ينماتيف نم ةضفخنم تايوتسم
Objectives: To investigate the intercourse between the platelet/lymphocyte )P/L( and neutrophil/ lymphocyte ratio )N/L(, and vitamin D )Vit-D( levels in low bone mineral density )BMD( of women. Methods: Two hundred fifty-two postmenopausal female outpatients who were admitted to the obstetrics and gynecology and physical therapy clinics between July 2016 and December 2017 wereretrospectively analyzed. The patients were grouped in relation to their T-score )normal [n=92], osteopenia [n=112], and PMO [n=48](. The serum levels of P/L, N/L, Vit-D, BMD and complete blood count of the patients were retrospectively examined.
Results: The median P/L was significantly higher and Vit-D levels were significantly lower in the PMO group )130.75 [52.89-385] versus 123.05 [54-232.5], p=0.02 and 15.4 [4-34] versus 20.1 [4-47], p=0.003(. While BMD and P/L were negatively correlated, a positive correlation between BMD and Vit-D was found. Vitamin D levels were negatively correlated with P/L )p<0.001( and N/L )p=0.04(. Older age )≥65 years(, Vit-D deficiency and P/L values >125.06 were found as independent prognostic factors for PMO in regression analysis.
Conclusion: Higher P/L seems to be a quite simple marker to help predict postmenopausal PMO. As seen in our study, having low levels of Vit-D is crucial for PMO.
Saudi Med J 2019; Vol. 40 (4): 360-366 doi:10.15537/smj.2019.4.24009 From the Department of Obstetrics and Gynecology (Eroglu), Konya Research Hospital, Baskent University, Konya, and from the Department of Physical Medicine and Rehabilitation (Karatas), Faculty of Medicine, Karabuk University, Karabuk, Turkey. Received 28th January 2019. Accepted 14th February 2019. Address correspondence and reprint request to: Dr. Semra Eroglu, Department of Obstetrics and Gynecology, Konya Research Hospital, Baskent University, Konya, Turkey. E-mail: [email protected] ORCID ID: orcid.org/0000-0002-9959-9433
P
ostmenaposal osteoporosis is a frequent disease among postmenopausal women. Bone loss and decreasing of bone mineralization is an important cornerstone in the pathology. In postmenopausal osteoporosis, there is a diminish in total bone mass, especially in the trabecular part of the bone, predisposingto pathologic fractures as a result of increased bone fragility. Fractures associated with PMO are one of the most leading causes of disability; limitation of activity; shortening of height, hunching, and difficulty in breathing; deterioration in quality of life; increased mortality; and leads to substantial medical care costs worldwide. Moreover, in many regions of the world, the incidence hip fractures has increased every year by 1-3%.1 Risk factors for PMO includes low bone mass,
advanced age, family history of fractures, smoking, physical inactivity, Vit-D and calcium deficiency, malnutrition, and long-term use of steroids.2,3 Among
these, Vit-D deficiency in particular as a predisposing factor to PMO, has become increasingly important in recent years. Vitamin D is essential for the body it is mandatory for bone health and metabolism, and its deficiency is quite common in society.4 Studies
describing the relationship between Vit-D levels and inflammatory cytokines have indicated that, the levels of C-reactive protein )CRP( and Interleukin 6 )IL6( might be correctable following supplementation therapy.5-7
Inflammatory markers play a modulating role through osteoclast activation by surrounding cytokines in bone formation and destruction.6,7 In epidemiologic
studies, PMO has been found more commonly in inflammatory diseases such as systemic lupus erythematosus )SLE(, ankylosing spondylitis, ulcerative colitis, Crohn’s disease, and rheumatoid arthritis, which has drawn attention to the association between PMO and chronic inflammation.8-10 There are some reports
showing that the levels of CRP, IL6, and tumor necrosis factor-alfa )TNF-α( increase in PMO.11,12 In contrast,
Berlunglundh et al,13 showed that CRP was not seen
as a marker of osteoporosis in older women, they found that the highest CRP level might be associated with PMO-related mortality. The interaction of some factors in platelets with Vit-D receptors is important for bone turnover. Therefore, it is estimated that platelets may contribute to PMO.14 Another theory is that
platelets can contribute to inflammation by releasing thromboxane.15,16 The ratios of P/L and N/L are
simple, easily accessible and inexpensive inflammation parameters. They have been shown to be associated with various inflammatory and cardiovascular diseases, and cancer. Furthermore, these parameters are now being evaluated as prognostic indicators for pre-treatment in some inflammatory diseases and cancer.17-19 However,
the relationship between N/L, P/L, and PMO has not yet been fully elucidated.
In the literature, the relationship between N/L, P/L, and PMO has been investigated in several studies.20-23
In this article we have examined the association between N/L, P/L, Vit-D level, and low BMD.
Methods. All postmenopausal females, 252 outpatients who were admitted to the obstetrics and gynecology and physical therapy clinics between July 2016 and December 2017 were retrospectively analyzed. While the patients who were known to have been menopausal for at least one year were including, on the other hand, the patients who have <1 year history of menopause, acute or chronic infection, anemia, thrombocytopenia and leucopenia, history of oncologic or hematologic diseases, liver or kidney disease, rheumatologic disease, any trauma history requiring hospitalization in the last 6 months, history of blood transfusion in the last one year and steroid use were excluded in the study. Demographic characteristics along with the laboratory findings including BMD, complete blood count measurements )the value of hemoglobin [Hb], mean platelet volume [MPV], neutrophil, monocytes, lymphocyte and platelet(, and Vit-D levels were carefully recorded. Neutrophil/ lymphocyte ratio, monocyte-lymphocyte ratio )M/L(, and P/L were calculated through the formulas as shown; N/L level, M/L level, and P/L level. Bone mineral density measurements were evaluated using dual energy x-ray absorptiometry )DEXA(. Bone mineral density )g/cm2( values and T scores of total lumbar )L1-L4(
spine, femur neck and femur total values obtained by DEXA were recorded. In accordance with the World Health Organization )WHO( endorsement, its PMO was accepted as bone density showing a T-score -2.5. Osteopenia was defined as T-scores between -1.0 and -2.5. Normal BMD was defined as T-scores -1.0. Based on these definitions, 3 groups of patients were defined according to BMD as normal, osteopenia, and PMO.24
The patients’ demographic characteristics, body mass index )BMI( and age were recorded. Body mass index was defined by calculating; weight/)height*height( )kg/ m2(.
Patients were included in the osteopenia group if the lumbar total, femur total or femur neck values were -1, and in the PMO group if it was <-2.5. Google Academic and PubMed were used to review similar previous studies. The Ethical approval of the study was obtained from the local institutional ethical committee )Date: 25.01.2017, Decision: 1/28(, and it was conducted in consideration of the Helsinki Declaration.
Disclosure. Authors have no conflict of interests, and the work was not supported or funded by any drug company.
Statistical analysis. All data were analyzed by using the Statistical Package for Social Science )SPSS( Version 22.0 )IBM Corp., Armonk, NY, USA(. In normally distributed data, Student’s t-test and Analysis of Variance were used for comparison )age and BMI(, and the Mann-Whitney U and Kruskal-Wallis tests were used to compare non-normally distributed data )Hb, P/L, N/L, M/L, Vit-D, and MPV(. The Pearson and Spearman tests were used for correlation analysis between age, BMI, P/L, N/L, and M/L. Receiver operating characteristics )ROC( curve analysis was used to establish the cut-off value of P/L levels. Multivariate logistic regression analysis was performed in order to find the strongest predictors of the outcome variable in PMO. A p-value<0.05 was considered significant.
Results. In all groups, the mean age was 54.12±7.34 years and BMI was 29.84±4.97 kg/m2. First, the
patients were divided according to their BMD values )without distinguishing them according to the lumbar total or femur total values( as normal and low BMD. Only the P/L value was significantly higher in the low BMD patients )p=0.02(. The P/L was significantly different between the groups )p=0.02(; however, there was no remarkable difference when the other values were examined )p>0.05(. Table 1 shows P/L, N/L, M/L, and MPV values, according to the patients’ BMD values. The patients’ BMD values were also divided; lumbar total, femur total, and femur neck. There was
a meaningful difference in P/L values when patients were grouped according to their lumbar total value )p=0.028(, femur neck )p=0.013(, and femur total values )p=0.015( )Tables 1-3(. Vitamin D levels were being fairly higher in the normal BMD group according to the other groups )p<0.001(, )Vit-D normal range 20-100 ng/mL(. The correlation analysis showed a reverse relationship between P/L, N/L and Vit-D levels )Table 4(. There was also an inverse association between BMI, P/L )p=0.005( and M/L levels )p=0.01( in the correlation analysis. Age was found to be positively correlated with BMI )p=0.005( and reversely correlated with the lumbar )p=0.001(, femur neck )p=0.01( and femur total BMD )p=0.01(. There was an inverse correlation between P/L and lumbar total )p=0.01(, femur neck )p=0.04(, and femur total )p=0.02( BMD )Table 4(. Receiver operating characteristics analysis was used to identify the significance of the P/L value. The ROC curve area was found to be 0.62, which was considered as significant for low BMD )osteopenia and PMO(. Considering the ROC analysis, the cut-off P/L value for low BMD was found as 125.6 )Figure 1(.
In the logistic regression analysis, P/L >125.06, age >65 years, and Vit-D deficiency were identified as independent predictors of low BMD )Table 5(.
Discussion. In this study, the P/L was importantly elevated in the osteopenia and PMO groups compared
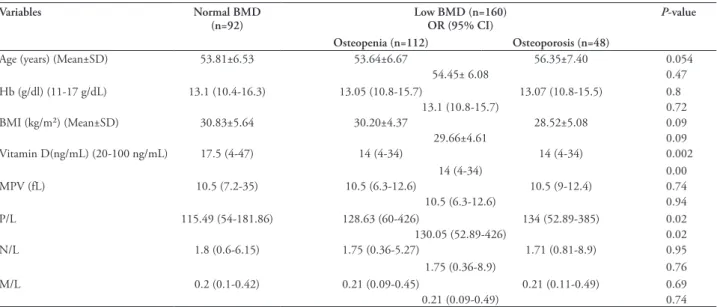
Table 1 - The levels of hemoglobin, Vitamin D, mean platelet volume, body mass index, ratios of platelet/lymphocyte, neutrophil/lymphocyte and
monocyte/lymphocyte according to bone mineral densitometry.
Variables Normal BMD
(n=92) Low BMD (n=160)OR (95% CI) P-value
Osteopenia (n=112) Osteoporosis (n=48)
Age )years( )Mean±SD( 53.81±6.53 53.64±6.67 56.35±7.40 0.054
54.45± 6.08 0.47 Hb )g/dl( )11-17 g/dL( 13.1 )10.4-16.3( 13.05 )10.8-15.7( 13.07 )10.8-15.5( 0.8 13.1 )10.8-15.7( 0.72 BMI )kg/m²( )Mean±SD( 30.83±5.64 30.20±4.37 28.52±5.08 0.09 29.66±4.61 0.09 Vitamin D)ng/mL( )20-100 ng/mL( 17.5 )4-47( 14 )4-34( 14 )4-34( 0.002 14 )4-34( 0.00 MPV )fL( 10.5 )7.2-35( 10.5 )6.3-12.6( 10.5 )9-12.4( 0.74 10.5 )6.3-12.6( 0.94 P/L 115.49 )54-181.86( 128.63 )60-426( 134 )52.89-385( 0.02 130.05 )52.89-426( 0.02 N/L 1.8 )0.6-6.15( 1.75 )0.36-5.27( 1.71 )0.81-8.9( 0.95 1.75 )0.36-8.9( 0.76 M/L 0.2 )0.1-0.42( 0.21 )0.09-0.45( 0.21 )0.11-0.49( 0.69 0.21 )0.09-0.49( 0.74
BMD - bone mineral density, OR - odds ratio, CI - confidence interval, SD - , standard deviation, Hb - hemoglobin, BMI - body mass index, MPV - mean platelet volume, P/L - platelet/lymphocyte ratio, N/L - neutrophil/lymphocyte ratio, M/L - monocytes/lymphocyte ratio.
with the normal BMD group. According to the correlation analysis, there was a negative correlation between P/L and bone densitometry. Based upon the findings of this study, it can be concluded that P/L may be used as an osteopenia and PMO marker in postmenopausal patients. In addition, low BMD group was associated with low Vit-D levels. It was observed that high P/L and low Vit-D were independent risk factors for low BMD. Bones are dynamic organs where construction and destruction always continues. Inflammation is necessary for this transformation. However, this cycle is disrupted in chronic inflammation in favor of osteoclastic activity, resulting in osteopenia, PMO and even fractures. Several studies have
Table 2 - The levels of hemoglobin, Vitamin D, mean platelet volume, body mass index, ratios of platelet/lymphocyte, neutrophil/lymphocyte
and monocyte/lymphocyte according to lumbar bone mineral density.
Variables Normal (n=116) Osteopenia (n=97) Osteoporosis (n=39) P-value
OR (95% CI)
Age )years( )Mean±SD( 54.01±6.73 53.78±6.86 55.92±6.88 0.23
BMI )kg/m²( )Mean±SD( 30.71±5.53 29.79±4.19 28.96±5.09 0.11 Hb )g/dl( )11-17g/dl( 13.3 )10.4-16.3( 13 )10.8-15.7( 13.4 )10.8-15.5( 0.13 Vitamin D )ng/ml( )20-100 ng/ml( 20.1 )4-47( 14.6 )4-33( 15.4 )4-34( 0.003 MPV )fL( 10.5 )7.2-35( 10.4 )6.3-12.6( 10.6 )9-12.1( 0.31 P/L 123.05 )54-232.5( 128.31 )60-426( 130.75 )52.89-385( 0.02 N/L 1.87 )0.6-6.15( 1.67 )0.36-5.27( 1.87 )0.81-8.9( 0.53 M/L 0.2 )0.1-0.42( 0.2 )0.09-0.45( 0.21 )0.11-0.49( 0.47
OR - odds ratio, CI - confidence interval, SD - , standard deviation, BMI - body mass index, Hb - hemoglobin, MPV - mean platelet volume, P/L - platelet/lymphocyte ratio, N/L - neutrophil/lymphocyte ratio, M/L - monocytes/lymphocyte ratio.
Table 3 - The levels of hemoglobin, Vitamin D, mean platelet volume, body mass index, ratios of platelet/lymphocyte, neutrophil/lymphocyte and
monocyte/lymphocyte according to femur neck and femur total BMD.
Variables Femur neck Femur total
Normal (n=135) Osteopenia
(n=95) Osteoporosis (n=22) P-value Normal (n=160) Osteopenia (n=76) Osteoporosis (n=16) P-value
OR (95% CI) OR (95% CI) Age )years( )Mean±SD( 53.66±6.33 54.26±7.18 57.45±7.52 0.05 53.52±6.21 55.18±7.69 56.62±7.51 0.07 BMI )kg/m²( )Mean±SD( 30.73±5.07 29.74±4.45 27.74±6.33 0.07 30.76±5.04 29.26±4.24 27.32±6.81 0.01 Hb )g/dl( )11-17 g/dl( 13.1)10.4-16.3( 13.2 )10.9-15.3( 13.1 )10.8-14.7( 0.71 13.1 )10.4-16.3( 13.2 )10.9-14.8( 13.05 )10.8-15.3( 0.69 Vitamin D )ng/ml( )20-100ng/ml( 17 )4-47( 14 )4-34( 13 )4-27( 0.00 16 )4-47( 14 )4-32( 13 )4-19( 0.00 MPV)fL( 10.5 )6.3-35( 10.5 )7.07-12.6( 10.7 )9.4-12.4( 0.31 10.45 )6.3-35( 10.65 )7.07-12.6( 10.6 )9.4-12.4( 0.36 P/L 124.72 )54-184( 130.26 )60-426( 139.67 )52.8-385( 0.01 124.86 )54-232.5( 130.75 )60-426( 133.7 )52.8-385( 0.01 N/L 1.72 )0.6-6.15( 1.84 )0.36-5.27( 1.96 )0.81-8.9( 0.81 1.69 )0.36-6.15( 1.92 )0.71-5.27( 1.95 )0.89-8.9( 0.52 M/L 0.2 )0.09-0.42( 0.21 )0.09-0.45( 0.20 )0.11-0.49( 0.72 0.2 )0.09-0.42( 0.21 )0.09-0.45( 0.2 )0.11-0.49( 0.97 OR - odds ratio, CI - confidence interval, SD - , standard deviation, BMI - body mass index, Hb - hemoglobin, MPV - mean platelet volume, P/L -
platelet/lymphocyte ratio, N/L - neutrophil/lymphocyte ratio, M/L - monocytes/lymphocyte ratio, BMD - bone mineral density.
investigated the association between inflammation and PMO. C-reactive protein is secreted from the liver and its level increases through the stimulation of TNF-α, IL6, and IL1. Many studies have showed a positive association between elevated serum CRP levels and PMO.13,25 In meta-analysis involving 34,840 patients,
most studies have shown that high-sensitivity CRP )hs-CRP( elevation and fracture risk are correlated, but the remaining few studies have not supported this result.26 In contrast, Oei et al,27 investigated the data of
6338 patients, and serum levels of CRP were slightly increased )as not statistically significant( in fracture formation; so there is no proof of this relationship. Besides this, the authors claimed that the strongest
effect in osteoporotic fracture was the lowest level in femur neck BMD. In this study, it was observed that the relationship between hs-CRP and femur neck BMD was weak.27 The high incidence of PMO accompanying
many inflammatory diseases in the literature reveals
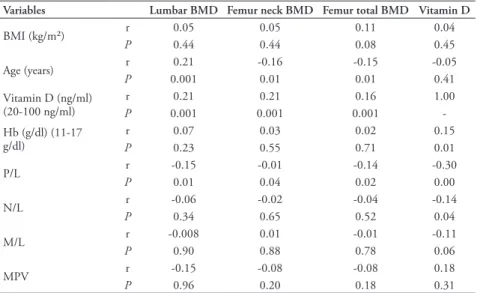
Table 4 - The correlation between lumbar-femur neck-femur total BMD values and Hb, Vitamin
D, MPV, BMI, ratios of platelet/lymphocyte, neutrophil/lymphocyte and monocyte/ lymphocyte.
Variables Lumbar BMD Femur neck BMD Femur total BMD Vitamin D
BMI )kg/m²( r 0.05 0.05 0.11 0.04 P 0.44 0.44 0.08 0.45 Age )years( Pr 0.0010.21 -0.160.01 -0.150.01 -0.050.41 Vitamin D )ng/ml( )20-100 ng/ml( r 0.21 0.21 0.16 1.00 P 0.001 0.001 0.001 -Hb )g/dl( )11-17 g/dl( Pr 0.070.23 0.030.55 0.020.71 0.150.01 P/L Pr -0.150.01 -0.010.04 -0.140.02 -0.300.00 N/L r -0.06 -0.02 -0.04 -0.14 P 0.34 0.65 0.52 0.04 M/L Pr -0.0080.90 0.010.88 -0.010.78 -0.110.06 MPV r -0.15 -0.08 -0.08 0.18 P 0.96 0.20 0.18 0.31
BMI - body mass index, Hb - hemoglobin, MPV - mean platelet volume, P/L - platelet/lymphocyte ratio, N/L - neutrophil/lymphocyte ratio, M/L - monocytes/lymphocyte ratio, BMD - bone mineral
density.
Figure 1 - Receiver operating characteristic )ROC( analysis for platelet/
lymphocyte )P/L( level. )x( sensivity, )y( spescificity.
the relationship between chronic inflammation and PMO. The association of PMO with Crohn’s disease, ulcerative colitis, rheumatoid arthritis, and SLE has been demonstrated in previous studies.10 Al-Daghriet
al,28 showed that IL6 was a predictor of bone loss in
the postmenopausal period, indicating that increased biologic age along with early postmenopausal status )within 10 years after menopause( were significantly and independently associated with high serum IL6 levels. By contrast, in a recent study of 2915 patients, Sponholtz et al,11 found no association of IL6 and TNF
with hip and spine BMD in postmenopausal patients receiving hormone replacement therapy )HRT(. In postmenopausal patients who did not receive HRT, there was no relationship between CRP level and BMD; however, there was an association between CRP level and femoral neck in postmenopausal patients
Table 5 - Risk factors for osteoporosis and P/L in logistic regression
analysis.
Variables OR (95% CI) P-value
Age ≥65 years 4.37 )1.15-16.52( 0.03 Vitamin D deficiency 7.21 )3.16-16.4( 0.00
P/L>125.06 1.86 )1.06-3.25( 0.02
receiving HRT.11 Although there are an increasing
number of studies investigating the relation between PMO and inflammatory markers, the number of studies examining the association of N/L and P/L with BMD has remained insufficient. In this study, we found high P/L levels in the osteopenia and PMO groups; however, there was no significant relationship with N/L. Contrary to our study, Huang et al,29 showed a
positive correlation between N/L and PMO. Yu et al,20
suggested that N/L was associated with arterial stiffness in patients with PMO. Fisher et al,21 stated that high
N/L displayed as a potential indicator of bone fracture. Although Yılmaz et al,22 showed that N/L and CRP
were significantly higher in the osteoporotic group than in the control group, N/L was found to be more effective for predicting PMO than CRP. There is only one study exploring the association of P/L and PMO along with N/L.23 Similar to our study, the relationship
of P/L-BMD, but not N/L-BMD and Vit-D-P/L-N/L, was found to be similar in Koseoglu’s study in which postmenopausal patients were divided into 2 groups as normal and low BMD, and an inverse relationship was found between P/L and BMD, without any statistically significant relation between N/L and BMD.23 In
addition, different from our study, low density lipid )LDL( was seen but it was no related with BMD.23
When the association of Vit-D with N/L, P/L, and PMO was examined, Vit-D levels were significantly less in the low BMD group and BMD values and Vit-D levels were found to be correlated. In a study in Chinese, BMD and serum 25-)OH( D levels were found to be correlated.30 As in our study, there are a
number of studies demonstrating the association of PMO with Vit-D deficiency.31 Similar to our study, the
relationship between Vit-D and P/L-N/L was found to be inversely correlated in Akbas et al’s study.32 In another
study, it was observed that Vit-D supplementation was associated with a decrease in N/L.33 Some studies have
shown that inflammatory markers are elevated in PMO. In this study, we found that P/L and N/L, which are simple serum markers, can be used easily in predicting PMO with low Vit-D.
Study limitations. Major limitations in our study are its small sample size and the fact that we could not assess the dietary intake of calcium and Vit-D.
In conclusion, the association of Vit-D with N/L and P/L supports the relationship between Vit-D and inflammation. Although there is no relationship between BMD and N/L, P/L is higher in PMO. Platelet/Lymphocyte is an easily accessible, cost-effective, and specific marker for inflammation that can help determine osteopenia and PMO, as well as the case
of low Vit-D levels. However, there is need for further studies including larger patient groups.
Acknowledgment. The authors gratefully acknowledge Souphi
Zitouni for radiologic support and David Chapman for English language editing.
References
1. Eastell R, O’Neill TW, Hofbauer LC, Langdahl B, Reid IR, Gold DT, et al. Postmenopausal osteoporosis. Nat Rev Dis Primers 2016; 2: 16069.
2. Curtis EM, Moon RJ, Dennison EM, Harvey NC, Cooper C. Recent advances in the pathogenesis and treatment of osteoporosis. Clin Med (Lond) 2015; 15: s92-s96.
3. Holm JP, Hyldstrup L, Jensen JB. Time trends in osteoporosis risk factor profiles: a comparative analysis of risk factors, comorbidities, and medications over twelve years. Endocrine 2016; 54: 241-255.
4. Zhen D, Liu L, Guan C, Zhao N, Tang X. High prevalence of vitamin D deficiency among middle-aged and elderly individuals in northwestern China: its relationship to osteoporosis and lifestyle factors. Bone 2015; 71: 1-6. 5. Jamka M, Woźniewicz M, Walkowiak J, Bogdański P, Jeszka J,
Stelmach-Mardas M. The effect of vitamin D supplementation on selected inflammatory biomarkers in obese and overweight subjects: a systematic review with meta-analysis. Eur J Nutr 2016; 55: 2163-2176.
6. Gravallese EM, Goldring SR, Schett G. The role of the immune system in the local and systemic bone loss of inflammatory arthritis. Osteoimmunology (Second edition) 2016; 241-256. 7. Jafari T, Faghihimani E, Feizi A, Iraj B, Javanmard SH,
Esmaillzadeh A, et al. Effects of vitamin D-fortified low fat yogurt on glycemic status, anthropometric indexes, inflammation, and bone turnover in diabetic postmenopausal women: A randomised controlled clinical trial. Clin Nutr 2016; 35: 67-76.
8. Harmandar FA, Can H, Cekin AH, Uyar S. Incidence of low bone mineral density and contributing factors in inflammatory bowel disease [Internet]. akademik gastroenteroloji dergisi. [Updated 2016; Accessed 2019 January 11]. Available from: https://pdfs.semanticscholar.org/0ec6/ aa740221ea617075f63944fd9bd79d1ad19d.pdf
9. El Maghraoui A, Sadni S, Rezqi A, Bezza A, Achemlal L, Mounach A. Does Rheumatoid Cachexia Predispose Patients with Rheumatoid Arthritis to Osteoporosis and Vertebral Fractures? J Rheumatol 2015; 42: 1556-1562.
10. Salman-Monte TC, Torrente-Segarra V, Muñoz-Ortego J, Mojal S, Carbonell-Abelló J. Prevalence and predictors of low bone density and fragility fractures in women with systemic lupus erythematosus in a Mediterranean region. Rheumatol Int 2015; 35: 509-515.
11. Sponholtz TR, Zhang X, Fontes JD, Meigs JB, Cupples LA, Kiel DP, et al. Association between inflammatory biomarkers and bone mineral density in a community-based cohort of men and women. Arthritis Care Res (Hoboken) 2014; 66: 1233-1240.
12. Lin CC, Li TC, Liu CS, Yang CW, Lin CH, Hsiao JH, et al. Associations of TNF-α and IL-6 polymorphisms with osteoporosis through joint effects and interactions with LEPR gene in Taiwan: Taichung Community Health Study for Elders )TCHS-E(. Mol Biol Rep 2016; 43: 1179-1191.
13. Berglundh S, Malmgren L, Luthman H, McGuigan F, Åkesson K. C-reactive protein, bone loss, fracture, and mortality in elderly women: a longitudinal study in the OPRA cohort. Osteoporos Int 2015; 26: 727-735.
14. Yan P, Xu Y, Wan Q, Feng J, Yang J, Li H, et al. Impact of MPV and PDW on bone mineral density and their relationship with osteoporosis in Chinese patients with type 2 diabetes. Int J Clin Exp Med 2018; 11: 2337-2349.
15. Koupenova M, Clancy L, Corkrey HA, Freedman JE. Circulating Platelets as Mediators of Immunity, Inflammation, and Thrombosis. Circ Res 2018; 122: 337-351.
16. Kapur R, Zufferey A, Boilard E, Semple JW. Nouvelle cuisine: platelets served with inflammation. J Immunol 2015; 194: 5579-5587.
17. Xu ZS, Zhang FP, Zhang Y, Ou-Yang YP, Yu XW, Wang WL, et al. Prognostic role of the pre-treatment platelet-lymphocyte ratio in pancreatic cancer: a meta-analysis. Oncotarget 2017; 8: 99003-99012.
18. Sato N, Kinoshita A, Imai N, Akasu T, Yokota T, Iwaku A, et al. Inflammation-based prognostic scores predict disease severity in patients with acute cholecystitis. Eur J Gastroenterol Hepatol 2018; 30: 484-489.
19. Guo J, Wu M, Guo L, Zuo Q. Pretreatment blood neutrophil/ lymphocyte ratio is associated with metastasis and predicts survival in patients with pancreatic cancer. Bull Cancer 2018; 105: 146-154.
20. Yu XY, Li XS, Li Y, Liu T, Wang RT. Neutrophil-lymphocyte ratio is associated with arterial stiffness in postmenopausal women with osteoporosis. Arch Gerontol Geriatr 2015; 61: 76-80.
21. Fisher A, Srikusalanukul W, Fisher L, Smith P. The Neutrophil to Lymphocyte Ratio on Admission and Short-Term Outcomes in Orthogeriatric Patients. Int J Med Sci 2016; 13: 588-602. 22. Yilmaz H, Uyfun M, Yilmaz TS, Namuslu M, Inan O,
Taskin A, et al. Neutrophil-lymphocyte ratio may be superior to C-reactive protein for predicting the occurrence of postmenopausal osteoporosis. Endocr Regul 2014; 48: 25-33. 23. Koseoglu SB. Bone loss & platelet-to-lymphocyte ratio.
Biomark Med 2017; 11: 5-10.
24. Miller AJ, Jones C, Liss F, Abboudi J, Kirkpatrick W, Beredjiklian P. Qualitative Evaluation of Digital Hand X-rays Is Not a Reliable Method to Assess Bone Mineral Density. Arch Bone Jt Surg 2017; 5: 10-13.
25. Lim HS, Park YH, Kim SK. Relationship between Serum Inflammatory Marker and Bone Mineral Density in Healthy Adults. J Bone Metab 2016; 23: 27-33.
26. Wu ZJ, He JL, Wei RQ, Liu B, Lin X, Guan J, et al. C-reactive protein and risk of fracture: a systematic review and dose-response meta-analysis of prospective cohort studies. Osteoporos Int 2015; 26: 49-57.
27. Oei L, Campos-Obando N, Dehghan A, Oei EH, Stolk L, van Meurs JB, et al. Dissecting the relationship between high-sensitivity serum C-reactive protein and increased fracture risk: the Rotterdam Study. Osteoporos Int 2014; 25: 1247-1254. 28. Al-Daghri NM, Aziz I, Yakout S, Aljohani NJ, Al-Saleh Y,
Amer OE, et al. Inflammation as a contributing factor among postmenopausal Saudi women with osteoporosis. Medicine (Baltimore) 2017; 96: e5780.
29. Huang C, Li S. Association of blood neutrophil lymphocyte ratio in the patients with postmenopausal osteoporosis. Pak J Med Sci 2016; 32: 762-765.
30. Guo L, Gao Z, Ge H. Effects of serum 25-hydroxyvitaminD level on decreased bone mineral density at femoral neck and total hip in Chinese type 2 diabetes. PLoS One 2017; 12: e0188894.
31. Brincat M, Gambin J, Brincat M, Calleja-Agius J. The role of vitamin D in osteoporosis. Maturitas 2015; 80: 329-332. 32. Akbas EM, Gungor A, Ozcicek A, Akbas N, Askin S, Polat M.
Vitamin D and inflammation: evaluation with neutrophil-to-lymphocyte ratio and platelet-to-neutrophil-to-lymphocyte ratio. Arch Med Sci 2016; 12: 721-727.
33. Tabatabaeizadeh SA, Avan A, Bahrami A, Khodashenas E4, Esmaeili H, Ferns GA, et al. High Dose Supplementation of Vitamin D Affects Measures of Systemic Inflammation: Reductions in High Sensitivity C-Reactive Protein Level and Neutrophil to Lymphocyte Ratio )NLR( Distribution. J Cell Biochem 2017; 118: 4317-4322.