PDF ISSN: 1528-2635
ACADEMY OF ACCOUNTING AND
FINANCIAL STUDIES JOURNAL
Mahmut Yardimcioglu, Karamanoglu Mehmetbey University
Academy Information
is published on the Allied Academies web page www.alliedacademies.org
The Academy of Accounting and Financial Studies Journal is owned and published by the DreamCatchers Group, LLC, and printed by Whitney Press, Inc. Editorial content is under the control of the Allied Academies, Inc., a non-profit association of scholars, whose purpose is to support and encourage research and the sharing and exchange of ideas and insights throughout the world.
W
hitney Press, Inc. Printed by Whitney Press, Inc. PO Box 1876, Skyland, NC 28776Neither the DreamCatchers Group or Allied Academies is responsible for the content of the individual manuscripts. Any omissions or errors are the sole responsibility of the authors. The Editorial Board is responsible for the selection of manuscripts for publication from among those submitted for consideration. The Publishers accept final manuscripts in digital form and make adjustments solely for the purposes of pagination and organization.
The Academy of Accounting and Financial Studies Journal is owned and published by the DreamCatchers Group, LLC, 51 Blake Drive, Arden, NC 28704. Those interested in subscribing to the Journal, advertising in the Journal, submitting manuscripts to the Journal, or otherwise communicating with the Journal, should contact the Executive Director at [email protected].
Academy of Accounting and Financial Studies Journal Accounting Editorial Review Board Members
Agu Ananaba
Atlanta Metropolitan College Atlanta, Georgia
Richard Fern
Eastern Kentucky University Richmond, Kentucky Manoj Anand
Indian Institute of Management Pigdamber, Rau, India
Peter Frischmann Idaho State University Pocatello, Idaho Ali Azad
United Arab Emirates University United Arab Emirates
Farrell Gean
Pepperdine University Malibu, California D'Arcy Becker
University of Wisconsin - Eau Claire Eau Claire, Wisconsin
Luis Gillman Aerospeed
Johannesburg, South Africa Jan Bell
California State University, Northridge Northridge, California
Richard B. Griffin
The University of Tennessee at Martin Martin, Tennessee
Linda Bressler
University of Houston-Downtown Houston, Texas
Marek Gruszczynski Warsaw School of Economics Warsaw, Poland
Jim Bush
Middle Tennessee State University Murfreesboro, Tennessee
Morsheda Hassan
Grambling State University Grambling, Louisiana Douglass Cagwin
Lander University
Greenwood, South Carolina
Richard T. Henage Utah Valley State College Orem, Utah
Richard A.L. Caldarola Troy State University Atlanta, Georgia
Rodger Holland
Georgia College & State University Milledgeville, Georgia
Eugene Calvasina
Southern University and A & M College Baton Rouge, Louisiana
Kathy Hsu
University of Louisiana at Lafayette Lafayette, Louisiana
Darla F. Chisholm
Sam Houston State University Huntsville, Texas
Shaio Yan Huang Feng Chia University China
Askar Choudhury Illinois State University Normal, Illinois
Robyn Hulsart
Ohio Dominican University Columbus, Ohio
Natalie Tatiana Churyk Northern Illinois University DeKalb, Illinois
Evelyn C. Hume Longwood University Farmville, Virginia Prakash Dheeriya
California State University-Dominguez Hills Dominguez Hills, California
Terrance Jalbert
University of Hawaii at Hilo Hilo, Hawaii
Rafik Z. Elias
California State University, Los Angeles Los Angeles, California
Marianne James
California State University, Los Angeles Los Angeles, California
Academy of Accounting and Financial Studies Journal Accounting Editorial Review Board Members
Jongdae Jin
University of Maryland-Eastern Shore Princess Anne, Maryland
Ida Robinson-Backmon University of Baltimore Baltimore, Maryland Ravi Kamath
Cleveland State University Cleveland, Ohio
P.N. Saksena
Indiana University South Bend South Bend, Indiana
Marla Kraut University of Idaho Moscow, Idaho
Martha Sale
Sam Houston State University Huntsville, Texas
Jayesh Kumar
Xavier Institute of Management Bhubaneswar, India
Milind Sathye University of Canberra Canberra, Australia Brian Lee
Indiana University Kokomo Kokomo, Indiana
Junaid M.Shaikh
Curtin University of Technology Malaysia
Harold Little
Western Kentucky University Bowling Green, Kentucky
Ron Stunda
Birmingham-Southern College Birmingham, Alabama C. Angela Letourneau
Winthrop University Rock Hill, South Carolina
Darshan Wadhwa
University of Houston-Downtown Houston, Texas
Treba Marsh
Stephen F. Austin State University Nacogdoches, Texas
Dan Ward
University of Louisiana at Lafayette Lafayette, Louisiana
Richard Mason
University of Nevada, Reno Reno, Nevada
Suzanne Pinac Ward
University of Louisiana at Lafayette Lafayette, Louisiana
Richard Mautz
North Carolina A&T State University Greensboro, North Carolina
Michael Watters
Henderson State University Arkadelphia, Arkansas Rasheed Mblakpo
Lagos State University Lagos, Nigeria
Clark M. Wheatley
Florida International University Miami, Florida
Nancy Meade
Seattle Pacific University Seattle, Washington
Barry H. Williams King’s College
Wilkes-Barre, Pennsylvania Thomas Pressly
Indiana University of Pennsylvania Indiana, Pennsylvania
Carl N. Wright Virginia State University Petersburg, Virginia Hema Rao
SUNY-Oswego Oswego, New York
Academy of Accounting and Financial Studies Journal Finance Editorial Review Board Members
Confidence W. Amadi Florida A&M University Tallahassee, Florida
Ravi Kamath
Cleveland State University Cleveland, Ohio Roger J. Best
Central Missouri State University Warrensburg, Missouri
Jayesh Kumar
Indira Gandhi Institute of Development Research India
Donald J. Brown
Sam Houston State University Huntsville, Texas
William Laing Anderson College Anderson, South Carolina Richard A.L. Caldarola
Troy State University Atlanta, Georgia
Helen Lange Macquarie University North Ryde, Australia Darla F. Chisholm
Sam Houston State University Huntsville, Texas
Malek Lashgari University of Hartford West Hartford, Connetticut Askar Choudhury
Illinois State University Normal, Illinois
Patricia Lobingier George Mason University Fairfax, Virginia Prakash Dheeriya
California State University-Dominguez Hills Dominguez Hills, California
Ming-Ming Lai Multimedia University Malaysia Martine Duchatelet Barry University Miami, Florida Steve Moss
Georgia Southern University Statesboro, Georgia Stephen T. Evans
Southern Utah University Cedar City, Utah
Christopher Ngassam Virginia State University Petersburg, Virginia William Forbes
University of Glasgow Glasgow, Scotland
Bin Peng
Nanjing University of Science and Technology Nanjing, P.R.China
Robert Graber
University of Arkansas - Monticello Monticello, Arkansas
Hema Rao SUNY-Oswego Oswego, New York John D. Groesbeck
Southern Utah University Cedar City, Utah
Milind Sathye University of Canberra Canberra, Australia Marek Gruszczynski
Warsaw School of Economics Warsaw, Poland
Daniel L. Tompkins Niagara University Niagara, New York Mahmoud Haj
Grambling State University Grambling, Louisiana
Randall Valentine University of Montevallo Pelham, Alabama Mohammed Ashraful Haque
Texas A&M University-Texarkana Texarkana, Texas
Marsha Weber
Minnesota State University Moorhead Moorhead, Minnesota
Terrance Jalbert
University of Hawaii at Hilo Hilo, Hawaii
ACADEMY OF ACCOUNTING AND
FINANCIAL STUDIES JOURNAL
CONTENTS
Accounting Editorial Review Board Members . . . iii
Finance Editorial Review Board Members . . . v
LETTER FROM THE EDITORS . . . viii
LETTER FROM ALLIED ACADEMIES . . . ix
CPA LICENSING REQUIREMENTS . . . 1
Peter Aghimien, Indiana University South Bend Dave Fred, Indiana University South Bend PAY VERSUS PERFORMANCE IN TARP RECIPIENT FIRMS . . . 17
Mary E. Phillips, Middle Tennessee State University EVIDENCE OF R&D EFFECTS ON CROSS SECTIONAL STOCK RETURNS . . . 31
Yuhong Fan, Weber State University F. Mark Case, Eastern Kentucky University A LONGITUDINAL PERSPECTIVE OF NONARTICULATION IN THE STATEMENT OF CASH FLOWS . . . 43 Peter J. Frischmann, Idaho State University
Frank Plewa, Idaho State University
SHORT TERM MARKET REACTION TO EARNINGS RESTATEMENTS:
VALUE STOCKS VIS-À-VIS GLAMOUR STOCKS . . . 55 Tan Xu, Old Dominion University
Diane Li, University of Maryland-Eastern Shore
John Jongdae Jin, California State University-San Bernardino SWITCHING OPTIONS AND THE IMPACT ON
BUSINESS STRATEGY AND RISK MANAGEMENT . . . 75 Larry A. Johnson, Dalton State College
WHAT DOES BOOK-TO-MARKET PROXY:
RISK OR INVESTOR SENTIMENT? . . . 85 TeWhan Hahn, Auburn University Montgomery
Michele O’Neill, University of Idaho
Judith Swisher, Western Michigan University A MARKOV CHAIN MODELING APPROACH FOR
PREDICTING A RETAIL MORTGAGE HEALTH INDEX . . . 101 Chang Liu, South West University of Finance and Economics
Morsheda Hassan, Wiley College Raja Nassar, Louisiana Tech University THE IMPACT OF SPLIT BOND RATINGS ON
ACCOUNTING RESEARCH RESULTS:
SOME ADDITIONAL EVIDENCE AND SOME
PRELIMINARY INSIGHTS . . . 113 Pavani Tallapally, Slippery Rock University
Michael S. Luehlfing, Louisiana Tech University James J. Cochran, Louisiana Tech University Gene H. Johnson, University of Hawaii-Hilo SHORT SELLING SUBSEQUENT TO LARGE STOCK
PRICE CHANGES . . . 125 Roger J. Best, University of Central Missouri
LETTER FROM THE EDITORS
Welcome to the Academy of Accounting and Financial Studies Journal. The editorial content of this journal is under the control of the Allied Academies, Inc., a non profit association of scholars whose purpose is to encourage and support the advancement and exchange of knowledge, understanding and teaching throughout the world. The mission of the AAFSJ is to publish theoretical and empirical research which can advance the literatures of accountancy and finance.
Dr. Mahmut Yardimcioglu, Karamanoglu Mehmetbey University, is the Editor. The mission is to make the AAFSJ better known and more widely read.
As has been the case with the previous issues of the AAFSJ, the articles contained in this volume have been double blind refereed. The acceptance rate for manuscripts in this issue, 25%, conforms to our editorial policies.
The Editor works to foster a supportive, mentoring effort on the part of the referees which will result in encouraging and supporting writers. He will continue to welcome different viewpoints because in differences we find learning; in differences we develop understanding; in differences we gain knowledge and in differences we develop the discipline into a more comprehensive, less esoteric, and dynamic metier.
Information about the Allied Academies, the AAFSJ, and our other journals is published on our web site. In addition, we keep the web site updated with the latest activities of the organization. Please visit our site and know that we welcome hearing from you at any time.
Mahmut Yardimcioglu, Karamanoglu Mehmetbey University
LETTER FROM ALLIED ACADEMIES
It is with the greatest sadness that we inform you of the death of Dr. Denise Woodbury in May, 2010. She has been a tremendous force in the Allied Academies organization and she has been a true friend of the Carlands for many years. She has been a member since 1997 and has served us in many ways. She will be truly missed; yet she leaves a wonderful legacy of caring and hope for all who knew her.
The Carlands have set up a scholarship for Denise through the Carland Foundation for Learning at their website at www.CarlandFoundation.org You are welcome to make a contribution in her memory at that site or to send a check to Carland Foundation for Learning to PO Box 914, Skyland, NC 28776.
Denise will be missed and long remembered by all.
Jim and JoAnn Carland Trey and Shelby Carland Jason Carland
CPA LICENSING REQUIREMENTS
Peter Aghimien, Indiana University South Bend
Dave Fred, Indiana University South Bend
ABSTRACT
This paper examines the necessary requirements to becoming a Certified Public Accountant (CPA) in the fifty states of the United States of America and also the jurisdictions which include Guam, District of Columbia, Puerto Rico, Commonwealth of Northern Mariana Islands, and the Virgin Islands. Generally, there are four major requirements to become a CPA in the United States with each of the State Board of Accountancy and jurisdictions setting their own preferential requirements. The paper discusses the Education requirements and the minimum 150 semester hours rule to qualify for the CPA examination. This part also evaluate foreign educational requirements (individuals with education obtained outside the United States) to sit for the CPA exam. Additionally, the paper discusses the uniform CPA Exam, set by the American Institute of Certified Public Accountants (AICPA) including the major components and sections of the exam. Also, the paper evaluates the different Experience requirement which varies from state to state. What is more, the paper accesses the Ethics examination requirement as a test of an understanding of proper conducts in the accounting arena. Put them together – the four E’s. Finally, the paper revisits the application process itself.
INTRODUCTION
Becoming a CPA is a long arduous process and while CPA’s may not be as glamorous as attorneys, doctors or movie actors, their career can be equally rewarding (Johnston, 2007). Here is the arduous journey:
EDUCATION REQUIREMENT
A majority of the states/jurisdictions require a minimum of one hundred and fifty semester hours of education (approved by the AICPA in 1988 requiring full execution from its members after the year 2000) from an accredited college or university as a prerequisite to CPA certification or their equivalent (state specific) (Raghunandan, Read, & Brown, 2005). This rule has inherently set additional college coursework comprising of general degree requirements of a bachelor’s degree (presumably four years) plus additional specific credit hours. The 150-hour requirement has become necessary in order to prepare students for careers as CPA’s, to expose students to a vast array of
business issues, and also to maintain a new curriculum that addresses the new developments in the field of accounting and technology (Albrecht & Sack, 2006). The new developments include increases in official accounting and auditing pronouncements and the proliferation of new tax laws, and so on (Johnston, 2007).
There are a variety of ways to meet the education requirement. Here are some ways: A baccalaureate degree in accounting from a four-year college or university majoring in accounting accredited by the Association to Advance Collegiate Schools of Business International (AACSB). With the accounting education major, subjects must include an introductory to accounting courses, auditing, cost accounting, financial accounting, managerial accounting, and U.S. federal income tax (AICPA, 2006). The minimum semester hours in an accounting major (state specific) should be earned together with other business courses such as finance, economics, business administration, marketing, statistics and business law. Most states will accept the one hundred and fifty hour semester requirement by providing a Master of Business coursework. The rest may be earned through general education courses.
In some states the education requirement can also be satisfied with a business or non-accounting undergraduate degree combined with an MS in non-accounting or an MBA in non-accounting provided all the requisite (vital, mandatory) accounting and business coursework needed to take the CPA exam is met (AICPA, 2007).
Candidates with accounting degrees from other Countries
The academic credentials of applicants who have earned their degrees outside the United States (from foreign colleges and universities), must have their educational credentials evaluated for equivalency to U.S. standards. Some foreign credential service organization reviews credentials to determine whether they meet state specific educational requirements described above (Maryland Board of Accountancy, 2006).
Implications of the 150-hour rule
The one hundred and fifty semester hour rule qualifies a candidate to sit for the CPA Exam. Since the requirement is relatively new, some academia has examined the consequential possible costs and benefits. Some of the concerns about costs include:
‚ Possible costs to students: - Imposition of another year of college study may make it financially difficult (especially economic hardship for minority students) to obtain their CPA licenses (Carroll, 2005).
‚ Possible costs to academic departments: - Additional resources in the form of classroom space, faculty, administrators and also acquiring a higher education standard can have a negative financial burden on institutions (Deppe, Hansen, & Jenne, 2005).
After satisfying the educational requirements, passing the CPA exams becomes the next hurdle.
EXAMINATION REQUIREMENT
In order to qualify for a licensure as a U.S. CPA, the candidate must sit for and pass the Uniform Certified Public Accountant examination in any of the fifty five jurisdictions. The uniform exam is set by the AICPA and is administered by the National Association of State Boards of Accountancy (NASBA). Here are the main reasons for the examination:
‚ Taking and passing the exam is necessary (though not sufficient) condition for success as public accounting professional.
‚ The fact that public accounting profession relies on the CPA exam as a filter provides “a market validation” for using their performance on the CPA exam as an outcome measure (DeMog, et al. 2006).
‚ The CPA exam has traditionally been used as a measure of the quality of education received by student (Schick, 2005) hence passing the exam ensure a pool of quality accounting professionals ready to provide financial audit services, financial planning and analysis services, business consultation and advanced learning in colleges, and so on.
The content specification and approximate percentages are illustrated in Table 1.
Table 1: Content Specification of the Computerized Exam
Topic Weight
Auditing and Attestation (4.5 hrs)
Planning the engagement 22-28%
Internal control 12-18%
Documentation 32-38%
Review the engagement 8-12%
Table 1: Content Specification of the Computerized Exam
Topic Weight
Financial Accounting and Reporting (4.0 hrs)
Concepts and standards 17-23%
Conformity with GAAP 27-33%
Specific types of transactions 27-33%
Accounting for governmental entities 8-12%
Accounting for not-for-profit organizations 8-12%
Regulation (3.0 hrs)
Ethics and legal responsibilities 15-20%
Business law 20-25%
Federal taxation 8-12%
Federal taxation - property transactions 8-12%
Federal taxation - individuals 12-18%
Federal taxation - entities 22-28%
Business Environment and Concepts (2.5 hrs)
Business structure 17-23%
Economic concepts 8-12%
Financial management 17-23%
Information technology 22-28%
Planning and measurement 22-28%
The exam is a fourteen hour computer-based and offered at specially authorized testing centers in each of the fifty five jurisdictions. The exam is available in English only and testing is offered up to five or six days a week, during two out of every three months period throughout the year (Philipp, 2007). The exam consists of three types of questions: multiple choice (four answer choices); objective questions or "other objective format" (questions that may involve matching, true-false, fill-in-the-blank, or numerical-answer questions); and essays. The only aids you are allowed to take to the examination tables are pens, pencils, and erasers (Smartpros, 2007). The exam is given in four parts which are:
‚ Auditing and Attestation (AUD): This section tests an understanding of auditing standards and procedures, attest engagements, and the candidates ability to apply that understanding.
‚ Financial Accounting and Reporting (FAR): This part examines the, candidate’s knowledge, awareness and understanding of Generally Accepted Accounting Principles as applicable to business enterprise, not-for-profit organizations, and government entities.
‚ Business Law and Professional Responsibility (REG): A candidate is tested on their understanding and knowledge of ethics, a CPA’s professional and legal responsibilities, federal tax and the ability to apply this knowledge (AICPA, 2007).
‚ Business Environment and Concepts (BEC): This section examines a candidate’s knowledge of the general business environment and business concepts needed to understand accounting implications of business transactions. This correlation is also tested in the candidate’s ability to demonstrate and apply the knowledge (Roberts, 2006).
Candidates can take one or more exam sections at a time. They cannot, however, take the same section more than once during any testing window (the quarterly period during which the exams are available). Generally, candidates have 18 months to pass all four sections and retain credit (AICPA, 2007). The passing grade in each of the sections is seventy five percent. Here is the passing percentage of candidates in each of the exam sections in 2008.
Table 2: Uniform CPA Examination Passing Rates 2008
Section First Quarter Second Quarter Third Quarter Fourth Quarter
AUD 44.66% 53.09% 51.04% 47.00%
BEC 46.94% 47.60% 49.60% 45.76%
FAR 45.95% 49.59% 53.93% 46.40%
REG 45.66% 48.57% 51.15% 48.59%
Quarter Cumulative Average 45.80% 49.71% 51.43% 46.94%
The 2008 average cumulative passing percentage is 48.47%. The highest passing percentage seems to be in the third quarter in each of the sections and the lowest seems to be in the first quarter in each of the sections. This might be attributed to the fact that new candidates taking the exam for the first time prefer to take the exam in the first quarter hence lower passing percentage rate and then after gaining some insight and composure, they retake the exam in the third quarter.
EXPERIENCE REQUIREMENT
This is one area of the licensure journey that is state specific. Each of the fifty five jurisdictions imposes a variety of different experience requirements. In 1992, the Uniform Accountancy Act (UAA) was developed by the AICPA and NASBA as a comprehensive model designed to promote uniformity, protect the public, and promote high professional standards which included encouraging the fifty five individual jurisdictions to adopt the Act mandating that “one year
of experience in the practice of public accountancy or its equivalent, under the direction of a licensee meeting requirements prescribed by the Board by rule”. From this notion, each of the separate jurisdictions would define the qualification of equivalent experience.
An overview
One jurisdiction does not require experience for certification (Puerto Rico) OF students with a baccalaureate majored in accounting, while others require full-time experience, continuous experience obtained immediately preceding the application or some require that a portion of the experience be gained in-state (Becker Review, 2007). In most jurisdictions, experience requirement is decreased for candidates with advanced education. For example jurisdictions such as Colorado and Massachusetts will waive the work experience requirement for those with a higher academic qualification compared to the state’s requirement to appear for the uniform CPA (Titard, 2006). Experience can be categorized in the following forms:
‚ Public Accounting Experience: This is vested in professional work experience obtained by providing people and businesses with a variety of specialized financial services including auditing, tax consulting and financial planning, environmental accounting, and other specialized assurance services. Also acceptable is teaching experience which, requires previous courses taught primarily in the accounting discipline for academic credit at an accredited four year college or university in at least two different areas of accounting above the introductory or elementary level and that part-time experience is permitted if it is continuous. In Connecticut for example, the experience requirement is three years full-time diversified experience involving the application of generally accepted accounting principles or the equivalent in government or industry.
‚ Non-public Accounting Experience: Certain jurisdictions accept non-public accounting experience (for a business, government or not-for-profit organization). For example in Georgia an applicant must file a Report of Practical Experience that documents that the applicant has a minimum of five years of experience in accounting-related activities verified and endorsed by a licensed CPA or an RPA who may be licensed in any state. In most jurisdictions, non-public experience is accepted when an individual has been under the supervision of a person licensed to practice public accounting and endorses the applicant provided the minimum state specific requirements in certain specific accounting fields are met. Other jurisdictions that will accept experience of a more general nature in accounting include Oregon, Virginia, Georgia and Kentucky
One-tier and Two-tier Requirements:
With regards to the CPA exam and experience as a prerequisite to certification and licensing, there are two major applications:
One-tier system
Some jurisdictions have a one-tier structure for certification in which the candidate is required to pass the CPA examination and complete all necessary experience requirements before obtaining both the CPA certificate and license (AICPA, 2005). Concern has been raised that this might present an obstacle since the requirement is likely to exclude some otherwise qualified candidates from the profession (Schick, 2006).
Two-tier system
In a two-tier system, a candidate would first become certified as a CPA – usually by passing the CPA examinations, then after that a candidate must fulfill the experience requirements to obtain the license to practice public accounting (Schick, 2006). Some of the two-tiered jurisdictions include Illinois, Alabama and Montana.
Most states will accept a minimum number of hours (often forty hours annually) for appropriate continuing professional education (CPE) to maintain a CPA license. The CPA Certificate and Permit to Practice Requirement denote the State specific public or non-public accounting experience requirement as deemed acceptable by the state specific boards.
ETHICS REQUIREMENT
In order to fulfill the requirements to obtaining a CPA license or certificate, some jurisdictions – currently over half of the states require the completion and passing of an ethics exam after passing the CPA exam. Part of the CPA examination, Regulation, consist of a section ‘law and professional conduct’ as an equivalent to the ethics exam. The AICPA also offers a Home Study Course in Professional Ethics which has been embraced by some states like Colorado, Connecticut, and South Dakota. The exam consists of fifty multiple-choice questions about different aspects concerning the practice and applicability of the AICPA code of professional conduct. Some of the topics covered include:
‚ Analyzing the importance of independence and why you must be independent both in fact and in appearance,
‚ Identifying the financial relationships between you and your clients that impair independence,
‚ Applying the provisions of the Code related to integrity, objectivity, due care, compliance with standards, and competence,
‚ Explaining why client information should be kept confidential,
‚ Assessing contingency fee issues related to certain tax matters, commissions, and referral fees,
‚ Identifying acts discreditable to the profession, particularly those related to the retention of client records,
‚ Applying the ethics rule relating to tax practice, advertising, form of organization, and firm name (Allen, CPA, 2007).
A ninety percent in the ethics exam is considered a passing grade to be licensed and certified. These different topics are designed to achieve a high caliber in candidates who shall be well attuned to the concepts of moral and immoral conduct and also right and wrong applications in the professional accounting setting. Numerous corporate scandals e.g. Enron malpractices are a contributing factor to the public’s cry for higher expectations to stiffening the laws governing the accounting profession.
Another school of thought has been to prioritize the testing of the ethics course during the uniform CPA examination as opposed to the separate AICPA ethics exam. The benefit as adduced, is that since every candidate is required to take the same CPA exams, this will achieve uniformity of ethical requirements in all jurisdictions.
OTHER CONSIDERATIONS IN CPA LICENSING REQUIREMENTS
The above discussed four E’s – Education, Exam, Experience and Ethics are a must for most of the jurisdictions to become a certified and licensed CPA. Some state specific requirements include:
Reciprocity
This is a method by which a jurisdiction grants a CPA certificate to an individual who holds a CPA certificate in good standing in another jurisdiction as long as the candidate meets the certification and licensing requirements of the incumbent jurisdiction (Kay, 2006). There have been
concerns raised about reciprocity in that temporary practice creates artificial barriers to the interstate practice and mobility of CPA’s. This is particularly burdensome because many of the organizations requiring the services of CPA’s transact business on both interstate and international basis and therefore practicing CPA extends beyond numerous jurisdictions let alone nations (McGarry, 2005). Age
Some jurisdictions have a minimum age of eighteen years old and some twenty one years old depending on their state board requirement.
Citizenship
Only four jurisdictions namely: Hawaii, Alabama, Puerto Rico, and the Virgin Islands require candidates to be citizens of the jurisdiction. The rest accepts non-citizen applicants. In state residency (employment or Office)
Most states do not require candidates to be employed and have an office in their states to qualify for CPA licensure and certification. Thirteen states require that a candidate be a resident, employed and have an office in the state to be qualified to practice CPA services.
The Application Process
After meeting the above state specific qualifications, most jurisdictions provide an online application form for practicing CPA. Most jurisdictions require the following information on the application form:
‚ Completed and notarized application;
‚ Three (3) 2x2 photographs of applicant;
‚ Copy of Applicant's Social Security Card;
‚ A Favorable Tax Clearance Letter from the Internal Revenue Service;
‚ Applicant must meet the specified education and experience requirement;
‚ A certified copy of applicant's college transcript;
‚ A certified copy of applicant's CPA Certificate from another state (if applicable);
CONCLUSION
Satisfying the requirements of the four E’s: Education, Exam, Experience and Ethics prior to CPA Licensure hopefully ensure that credible, candid and competitive individuals are the ones allowed to serve the growing demand for accounting services.
Since requirements differ somewhat from jurisdiction to jurisdiction, it is extremely important that prospective candidates contact and inquire from their respective State Board of Accountancy for information specific to the jurisdiction in question.
REFERENCES
AICPA (2005). A Postbaccalaureate Education Requirement for the CPA Profession: The Commission on Professional Accounting Education. American Institute of Certified Public Accountants, New York, NY.
AICPA (2006). Education Requirements for Entry into the Accounting Profession. American Institute of Certified Public Accountants, New York, NY: Retrieved April 9, 2009 from http://openlibrary.org/b/OL2101580M/ AICPA, (2006). The uniform CPA exam alert, American Institute of Certified Public Accountants, New York, NY:
Retrieved April 8, 2009 from www.cpa-exam.org
AICPA (2007). Academic Preparation to Become a Certified Public Accountant. American Institute of Certified Public Accountants, New York, NY.
Albrecht, S. W., Sack, R. (2006). Accounting Education: Charting a course through a Perilous Future. American Accounting Association - Accounting Education Series: No. 16, Retrieved April 8, 2009, from www.aaahq.org/pubs/AESv16
Allen, Catherine R. (2007). PCAOB Rules on Independence and Personal Tax Services: Current Guidance for Public Company Auditors. The CPA Journal – Online. Retrieved April 8, 2009, from http://www.nysscpa.org/cpajournal/2007/207/essentials/p28.htm
Becker Review, (2007). CPA Exam Requirements – State by State Reference Guide. Retrieved April 8, 2009 from http://www.beckercpa.com/state
Carroll, L. (2005). The 150-hour rule: bad idea then, worse idea now. Accounting Today, (11)17, 6-7.
CPA certificate and permit to practice requirements. Retrieved from www.aicpa.org/download/states/require_pract.pdf DeMong, R. F., J.H. Lindgren, & S.E.Perry (1994). Designing an assessment program for accounting. Issues in
Accounting Education, (9)1, 11-27.
Deppe, L., D.R. Hansen, & S. Jenne (1988). The 150-hour education requirement: The history and message of the Utah experience. Accounting Horizons, (June), 53 -7.
Johnston, Michael (2007). Becoming a CPA. Retrieved from: http://www.about-accounting.com/becoming-cpa Kay, Carnes C. (2006). A progress report on international auditing reciprocity. Management Auditing Journal, (15)9,
464-468.
Maryland Board of Accountancy (2006). License Requirements – Individuals. Retrieved from: http://www.dllr.state.md.us/license/cpa
Mc Garry, Stephen J. (2002). Multidisciplinary Practices and Partnerships: Lawyers, Consultants, and Clients. Law Journal Press.
Philipp, Roger (2007). About the CPA Exam. CPA Review: Retrieved April 8, 2009 from http://www.rogercpareview.com/aboutexam.html
Raghunandan, K., William J. Read & Clifford D. Brown (2003). “The 150-hour rule: does it improve CPA exam performance?” Managerial Auditing Journal, (18)1, 31-38.
Roberts, David J. (2006). Reconsidering CPA experience requirements. The CPA Journal (Dec). Retrieved from: http://www.nysscpa.org/cpajournal/old
Schick, A.G. (1998). Arguments against the CPA to gauge accounting program success – Reply. Issues in Accounting Education, (13)2, 425-426.
SmartPros (2007). Preparing for the CPA exam. Retrieved April 8, 2009 from http://accounting.smartpros.com/x24559.xml
The Connecticut Society of CPA’s (2007). Requirements to Become a CPA in Connecticut. Retrieved from http://www.cscpa.org/Content/Students
Titard, P.L. & K.A. Russell (1989). Factors Affecting CPA examination success. Accounting Horizons (Sept.) 53-59. USVI Department of Licensing and Consumer Affairs (2007). Requirements for the Practicing CPA. Retrieved April
Table 3: Jurisdictions allowing candidates to sit at 120 hours
(some require completion of baccalaureate as part of requirement to sit for exam), requiring 150 for licensure: 24
1. Alaska 2. Arizona 3. Connecticut 4. Delaware 5. Florida 6. Georgia 7. Hawaii 8. Idaho 9. Iowa 10. Kentucky 11. Maine 12. Massachusetts 13. Michigan 14. Minnesota 15. New Jersey
16. New York (150 for licensure takes effect Aug. 2009, candidates will still be allowed to sit at 120) 17. New Mexico 18. North Carolina 19. Pennsylvania 20. Rhode Island 21. South Carolina 22. Virginia 23. West Virginia 24. Guam (Source: AICPA)
Table 4: Jurisdictions allowing students to sit for exam prior to completion of education (with a defined time period to finish education), requiring 150 for licensure: 6
1. Missouri 2. North Dakota 3. South Dakota 4. Tennessee 5. Washington 6. Wisconsin (Source: AICPA)
Table 5: Jurisdictions that do not require 150 for licensure: 5
1. California 2. Colorado 3. New Hampshire 4. Vermont 5. Virgin Islands (Source: AICPA)
Table 6: Jurisdictions that require 150 to sit for exam and 150 for licensure: 20
1. Alabama
2. Arkansas
3. Commonwealth of Northern Mariana Islands
4. District of Columbia 5. Illinois 6. Indiana 7. Kansas 8. Louisiana 9. Maryland 10. Mississippi 11 Montana 12. Nebraska 13. Nevada 14. Ohio
Table 6: Jurisdictions that require 150 to sit for exam and 150 for licensure: 20 15. Oklahoma 16. Oregon 17. Puerto Rico 18. Texas 19. Utah 20. Wyoming (Source: AICPA)
Table 7: Jurisdictions That Have Passed the 150-hour Education Requirement
State Enacted Effective State Enacted Effective
Alabama 1989 01/01/95 New York 1998 08/01/09
Alaska 1991 01/01/01 North Carolina 1997 01/01/01
Arizona 1999 06/30/04 North Dakota 1993 01/01/00
Arkansas 1990 01/01/98 Ohio 1992 01/01/00 Commonwealth of Northern Marianas 2003 05/20/03 Oklahoma 1998 07/01/03 Oregon 1997 01/01/00 Connecticut 1992 01/01/00 Pennsylvania* 2008 01/01/12
District of Columbia 1995 01/02/00 Puerto Rico 1994 01/01/00
Delaware 2008 08/01/12 Rhode Island 1992 07/01/99
Florida 1979 08/01/83 South Carolina 1991 07/01/97
Georgia 1991 01/01/98 South Dakota 1992 01/01/98
Guam 1994 06/01/00 Tennessee 1987 04/14/93
Hawaii 1997 12/31/00 Texas 1989 08/31/97
Idaho 1993 07/01/00 Utah 1981 07/01/94
Illinois 1991 01/01/01 Virginia 1999 07/01/06
Indiana 1992 01/01/00 Washington 1995 07/01/00
Iowa 1992 01/01/01 West Virginia 1989 02/15/00
Kansas 1990 06/30/97 Wisconsin 1996 01/01/01
Kentucky 1990 01/01/00 Wyoming 1993 01/01/00
Louisiana 1990 12/31/96 Currently in Effect 47
Table 7: Jurisdictions That Have Passed the 150-hour Education Requirement
State Enacted Effective State Enacted Effective
Maryland 1993 07/01/99 TOTAL 50
Massachusetts 1998 07/01/02
Michigan 1998 07/01/03
" Currently five jurisdictions do NOT have the 150 hour requirement in place: California, Colorado, New Hampshire, Vermont and the Virgin Islands.
Minnesota 2000 07/01/06
Mississippi 1990 02/01/95
" 24 jurisdictions allow candidates to sit at 120 hrs, but require 150 for certification. They are: AK, AZ, CT,DE, FL, GA, HI, ID, IA, KY, MA, ME, MI, MN, NC, , NJ, NM, NY, PA, RI, SC, VA, WV, Guam
Missouri 1993 06/30/99
Montana 1989 07/01/97
Nebraska 1991 01/01/98
" Note: PA is still an optional 150 state, but legislation passed in 2008 will require 150 hours for licensure beginning in 2012.
Nevada 1993 01/01/01
New Jersey 1995 07/02/00
" 6 jurisdictions allow students to sit for the exam prior to completion of the 150 hours, but set a time limit to finish the 150 requirement for licensure: MO, ND, SD, TN, WA, WI
New Mexico 1999 07/01/04
PAY VERSUS PERFORMANCE
IN TARP RECIPIENT FIRMS
Mary E. Phillips, Middle Tennessee State University
ABSTRACT
Short-term incentives and excessive risk-taking that stem from executive compensation policies have contributed to the current financial crises which began in 2007 with the Bear Stearns financial woes (Kropp, 2009; Sloan, 2009). The U.S. government has been proactive in creating a stimulus package of unprecedented proportions, and as of June, 2009 there were 613 companies participating in the Troubled Asset Relief Program (TARP). The purpose of this paper is to analyze top TARP recipient firms to test whether compensation in these stressed companies is associated with performance measures. The prediction is that these companies will exhibit an increasing relationship between pay and performance from 2006 to 2008.
Results indicate that performance measures are not significantly associated with Chief Executive Officer (CEO) compensation in 2006, but in 2007 stock returns, EPS, and return on equity are significantly associated with CEO total compensation. This implies that pay is linked with performance in 2007, which coincides with the SEC’s enhanced executive compensation disclosure requirements. In 2008, several performance measures are significantly associated with total CEO compensation, but unpredicted negative coefficients confirm prior research that earnings-related fundamentals are not useful in explaining compensation in loss years (Jackson, Lopez & Reitenga, 2008), even for these companies regulated by TARP.
INTRODUCTION
There has been much discussion in the business press about executive compensation and its alignment to performance and risk-taking, especially since many U.S. companies have received bailout funds from taxpayers (Benjamin & Goldman, 2009). It is widely believed that short-term incentives which stem from executive compensation policies have contributed to the current financial crisis, which began in June, 2007 with the meltdown of two Bear Stearns’ hedge funds that speculated in mortgage-backed securities (Sloan 2009; Kropp, 2009). Numerous legislative packages passed by the U. S. Congress in a relatively short period of time have brought unprecedented amounts of bailout money to troubled U.S. companies. Included in the stimulus package totaling $12.2 trillion is the Troubled Asset Relief Program (TARP) which commits up to $700 billion for investment in companies in exchange for preferred stock which is held by the U.S. Treasury.
Agency theory states that management should act in the interest of stakeholders, but according to Arthur Levitt (2005), America has seen the” breakdown of corporate governance and buildup in greed” which has compromised the fiduciary relationship between management and stakeholders. Huge executive pay “undermines corporate governance,” since management becomes focused on short-term goals rather than the long-term interest of stakeholders (Levitt, 2005). Dating back to Enron’s bankruptcy, we have seen Chief Executive Officers (CEO’s) walk away with millions, leaving behind shareholders, debt holders, and employee retirement funds in shambles. In response, we now have an increased number of shareholder proposals, new disclosure rules from the SEC (2006) and enhanced limits on executive compensation under TARP, all reflecting the general public’s interest in the pay versus performance debate.
The purpose of this paper is to analyze top TARP recipients in order to test whether CEO compensation in these troubled companies is associated with performance measures during the period from 2006 through 2008. I extend prior executive compensation research to analyze total compensation in stressed companies. I test to see whether recent SEC executive compensation disclosure rules and the stringent limits of executive compensation under TARP have increased the relationship between pay and performance. Results indicate that performance measures are not significantly associated with CEO compensation in 2006, but in 2007 stock returns, EPS, and return on equity are significantly associated with CEO total compensation. This implies that pay is linked with performance in 2007, which coincides with the SEC’s enhanced executive compensation disclosure requirements. In 2008 several performance measures are significantly associated with total CEO compensation, but negative coefficients confirm prior research that earnings-related fundamentals are not useful in explaining compensation in loss years (Jackson, Lopez & Reitenga, 2008), even for these companies regulated by TARP.
This paper is organized as follows. The next sections provide background and hypothesis development. Next are the sample and model descriptions, followed by analysis of results. Finally, conclusions are presented.
BACKGROUND
The SEC has alternated between tabular and narrative formats since the first disclosure was required in 1938 and the first tabular disclosure in 1942 (Donahue, 2008). Disclosure was extended to cover all forms of executive packages in 1978, and the format moved away from the tabular disclosure to a more narrative style in 1983. In 1992, requirements returned to predominantly tabular format, and finally in 2006, the rules broadened both the tabular and narrative requirements. The 2006 rules require a thorough Compensation Discussion and Analysis (CD&A) which must be certified under Sarbanes-Oxley. The intent is to better disclose the new types of executive compensation. A summary table of 10 columns is required and must now show total compensation in dollars for the first time, with stock no longer in units. Included are compensation for the current and prior two years, equity compensation and retirement and other post employment compensation.
This information is required for the Principal Executive Officer, the Principle Financial Officer, and the next three highest paid executive officers (SEC, 2006).
Narratives must be written in “Plain English” which requires “clear, concise sections, paragraphs and sentences,” in active voice with concrete everyday words (SEC, 2006). The purpose of the CD&A is to give an overview of the compensation policies and decisions. In addition firms must disclose information about compensation consultants and other resources used by the committee in setting compensation levels. The SEC issued a report after analyzing the first two years of submissions under the new rules and found firms lacking information about how they arrived at compensation policy and how their committees used individual performance to set compensation (White, 2009). Since disclosure requirements are principles-based, each firm decides which parts of the compensation policy merit disclosure. However, firms must disclose performance targets or show that disclosure will cause “competitive harm” (SEC, 2006). If benchmarks are used in setting compensation, the firm should identify the benchmark and its components if applicable. Executive compensation has risen exponentially over the years. In the 1950s executive pay was about $1.3M in 2008 dollars, with big increases between 1980-2000, from $3.7 million to $17.4 million. Also, there were big increases between 1993 and 2000, with slight decreases in 2001 due to poor stock performance (Anson, White, McGrew & Butler, 2004). CEO compensation has risen from 100 times the average worker in 1980 to 400 times in 2000, although part of this increase comes from adding the value of pensions to the compensation package. Also, the use of stock options in pay packages has brought executive compensation to much higher levels (Schooley, 2005).
TARP is part of the $12.2 billion government bailout. Included in the $700 billion allocated to TARP are $100 billion to the Term Asset-Backed Securities Loan Facility (TALF) and $100 billion to the Public-Private Investment Fund. TALF provides loans and accepts securities backed by consumer and small business loans, and the Public-Private Investment Fund buys nonperforming assets from banks. Of the $500 billion remaining, $428.3 billion had been committed to 613 U.S. companies as of June 5, 2009, and $50 billion had been committed to private investors for foreclosure relief. As of February, 2009 firms had paid $2.5 billion in dividends to the government (ProPublica, 2009; New York Times, 2009).
When TARP was established under the Emergency Economic Stabilization Act (EESA) in October, 2008, guidelines were set for executive compensation. These guidelines were revised in their entirety by the American Recovery and Reinvestment Act of 2009 (ARRA). Some of the key points of ARRA (2009) are the following:
‚ No golden parachute payments are allowed.
‚ Bonuses, retention awards and incentive compensation are not allowed, except for long-term restricted stock if it does not exceed one-third of the annual compensation and if it does not fully vest while TARP funds are owed to the government.
‚ Compensation plans are not allowed if they encourage manipulation of earnings to enhance employee compensation.
‚ Specified luxury expenses are limited.
‚ There is a “clawback” clause where employees may be asked for reimbursements if payments were inconsistent with TARP or contrary to the public interest.
‚ Shareholders must be permitted to vote on executive compensation, although the result of the vote is nonbinding.
HYPOTHESIS DEVELOPMENT
Excessive executive pay undermines corporate governance, since management becomes focused on short term goals rather than the long term interest of the stockholders (Levitt, 2005). Interlocking directors and the fraternal nature of boards result in compensation committees’ approving huge salaries, particularly since it is often the case that highly paid CEO’s sit on the compensation committees of other CEOs (Friedland, 2004; Strier, 2007). The NYSE and NASDAQ now require nominating and compensation committee members to be composed of independent directors, but this does not address the issue of interlocking directors. Pay should be aligned with long term goals and performance.
Prior research finds a positive relationship between contemporaneous earnings and CEO compensation (Lambert & Larcker, 1987; Sloan, 1993; Baber, Kang & Kumar, 1999) except when earnings are poor and declining (Gaver & Gaver, 1998). Thus, executive compensation is weakly linked to performance. Accounting fundamentals explain CEO bonuses, but earnings do not explain bonuses if there are negative or declining earnings (Jackson, Lopez & Reitenga, 2008). Compensation committees focus on accounting fundamentals rather than earnings when earnings are negative or declining (Jackson, Lopez & Reitenga, 2008).
Several studies present investigations of different accounting and economic variables that are associated with compensation. Anson, White, McGrew & Butler (2004) suggest nine metrics to measure performance, and Core (1999) lists economic determinants of compensation. Nourayi (2008) examines CEO compensation by looking at size, ROA and total one year stock return in a sample partitioned by CEO tenure, and finds that firm size is the most significant factor. Similarly, Nourayi and Daroca (2008) find that firm size and market-based return are the most significant explanatory variables affecting executive compensation. Less significant are accounting based measures and number of employees.
The purpose of this study is to investigate the pay for performance issue in firms that are recipients of TARP funds. Since these firms are operating under the stringent executive compensation rules in TARP as well as enhanced disclosure for executive compensation required by the SEC since December, 2006, my hypothesis is that these firms will exhibit an increasing relationship between pay and performance from 2006 through 2008.
SAMPLE
The sample for this paper is drawn from the top TARP fund recipients that are listed on the ProPublica (2009) website and that have proxies available on the SEC website for 2006 through 2008. There are 142 companies that received $50 million or greater in TARP funds as of June 5, 2009, and of these there are thirty firms that do not have proxies available on the SEC website. Thus, the total sample size is 112 firms.
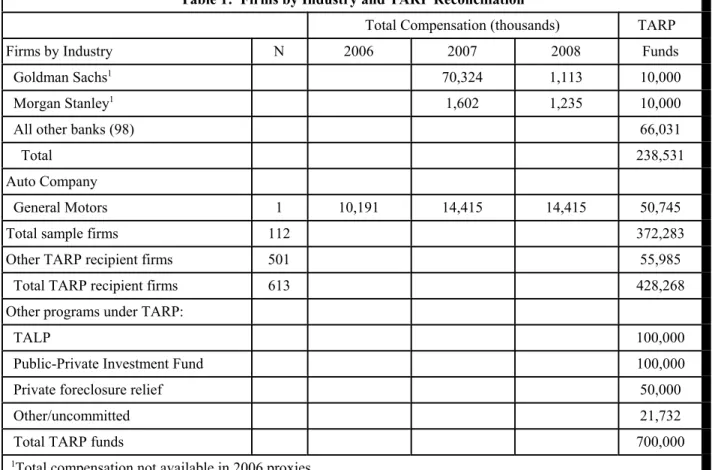
Table 1 shows a summary of the sample firms by industry and the amount of TARP bailout funds they received, along with CEO compensation details for firms receiving larger amounts of TARP funds. Table 1 also shows a reconciliation to the $700 billion TARP funds that were approved by Congress in October, 2008. As companies are paying back these funds and as funds are issued under the TALP, Public-Private Investment Fund and foreclosure relief programs that are part of TARP, the amount outstanding changes daily. For current information see the ProPublica website at http://www.bailout/propublica.org.
Table 1: Firms by Industry and TARP Reconciliation
Total Compensation (thousands) TARP
Firms by Industry N 2006 2007 2008 Funds
Mortgage Servicer (millions)
Ocwen Financial Corporation 1 1,215 2,492 2,273 659
Insurance Company
AIG 4 21,229 14,330 29,692 69,835
Hartford Financial Services 18,211 15,831 4,470 3,400
Lincoln National Corporation 5,208 18,000 7,325 2,500
Principal Financial Group 4,506 5,313 41,639 2,000
Total 77,735
Financial Services Company
American Express 2 29,137 26,082 27,327 3,389
Discover Financial Services1 8,003 8,298 1,225
Total 4,613 Bank Bank of America 104 27,873 24,844 9,959 52,500 Citigroup 25,975 23,833 10,815 50,000 JPMorgan Chase 39,053 27,797 19,651 25,000 Wells Fargo 29,846 12,568 13,782 25,000
Table 1: Firms by Industry and TARP Reconciliation
Total Compensation (thousands) TARP
Firms by Industry N 2006 2007 2008 Funds
Goldman Sachs1 70,324 1,113 10,000
Morgan Stanley1 1,602 1,235 10,000
All other banks (98) 66,031
Total 238,531
Auto Company
General Motors 1 10,191 14,415 14,415 50,745
Total sample firms 112 372,283
Other TARP recipient firms 501 55,985
Total TARP recipient firms 613 428,268
Other programs under TARP:
TALP 100,000
Public-Private Investment Fund 100,000
Private foreclosure relief 50,000
Other/uncommitted 21,732
Total TARP funds 700,000
1Total compensation not available in 2006 proxies.
data sources: http://www.probublica.org as of June 5, 2009 and proxy statement from http://www.sec.gov
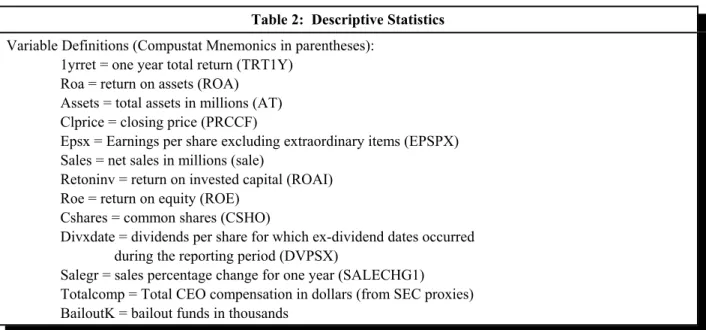
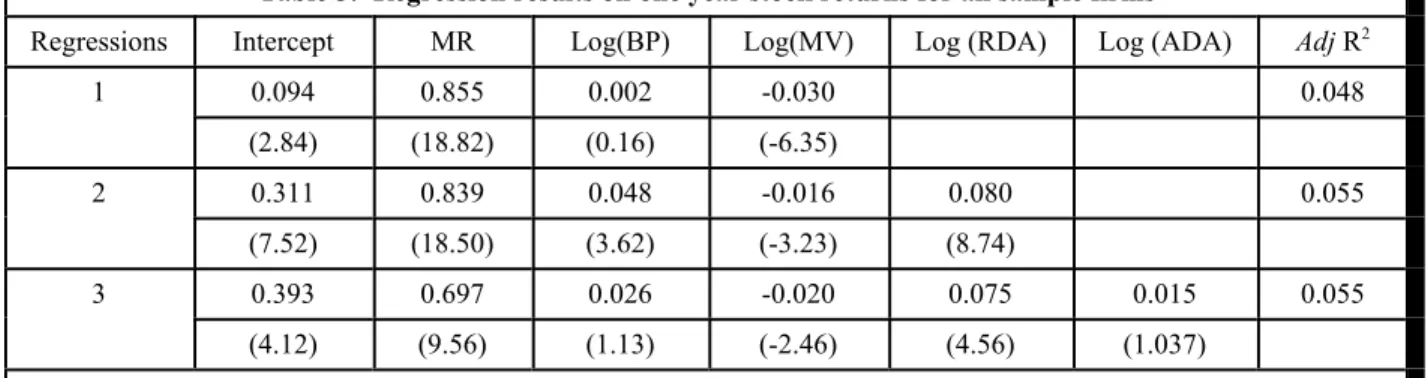
Table 2 shows descriptive statistics for the 112 firms in the sample. The changes from 2006 to 2008 are indicative of the financial crisis that was developing. The one-year stock returns are decreasing, as are ROA, EPS, sales, return on invested capital, ROE, and sales growth. Average total compensation for the sample firms is decreasing from 2006 to 2007 (4.3%) and then decreases dramatically (22.5%) from 2007 to 2008.
Table 2: Descriptive Statistics
Variable Year N Mean Dev Minimum Maximum
1yrret 2006 110 13.876 16.135 -21.123 82.299
1yrret 2007 111 -25.206 18.407 -65.069 28.147
1yrret 2008 112 -29.528 36.288 -97.094 65.704
Table 2: Descriptive Statistics Roa 2007 112 0.593 2.872 -29.081 2.702 Roa 2008 111 -0.768 3.708 -33.895 2.664 Assets 2006 112 101,659.640 299,152.440 476.299 884,318.000 Assets 2007 112 15,146.010 342,395.910 563.828 2,187,631.000 Assets 2008 111 121,007.650 361,912.530 2,002.340 2,175,052.000 Clprice 2006 111 39.126 24.944 9.530 194.800 Clprice 2007 112 29.412 25.754 5.540 226.640 Clprice 2008 112 18.172 14.160 0.710 78.990 Epsx 2006 112 2.604 2.526 -3.500 20.930 Epsx 2007 112 1.386 7.929 -76.520 26.340 Epsx 2008 111 -1.576 7.061 -53.320 5.040 Sales 2006 112 10,162.620 30,806.550 33.419 207,349.000 Sales 2007 112 10,730.390 30,972.240 41.643 181,122.000 Sales 2008 111 8,154.390 23,589.310 51.157 148,979.000 Retoninv 2006 104 9.698 3.833 -1.536 21.291 Retoninv 2007 106 4.940 21.549 -210.865 20.117 Retoninv 2008 107 -3.338 13.448 -44.900 14.580 Roe 2006 111 13.208 5.377 1.810 37.010 Roe 2007 111 9.565 6.201 -8.180 36.703 Roe 2008 110 -8.532 29.481 -189.199 24.246 Cshares 2006 112 302.767 812.163 0.001 4,911.990 Cshares 2007 112 310.139 808.938 6.168 4,994.580 Cshares 2008 111 343.893 912.552 6.159 5,450.070 Divxdate 2006 111 0.828 0.606 0.000 3.690 Divxdate 2007 112 0.883 0.658 0.000 3.730 Divxdate 2008 112 0.800 0.658 0.000 3.770 Salegr 2006 112 25.618 18.536 -2.152 142.707 Salegr 2007 112 13.149 14.930 -36.689 66.133 Salegr 2008 111 -7.124 16.458 -89.795 38.197 Totalcomp 2006 104 5,001,756.09 8,241,281.32 143,851.00 39,053,329.00 Totalcomp 2007 111 4,788,699.63 9,016,669.45 309,196.00 70,324,352.00 Totalcomp 2008 109 3,712,229.89 5,675,970.85 299,354.00 29,692,048.00 bailoutK 112 3,323,956.90 10,893,245.91 50,000.00 69,835,000.00
Table 2: Descriptive Statistics
Variable Definitions (Compustat Mnemonics in parentheses): 1yrret = one year total return (TRT1Y)
Roa = return on assets (ROA) Assets = total assets in millions (AT) Clprice = closing price (PRCCF)
Epsx = Earnings per share excluding extraordinary items (EPSPX) Sales = net sales in millions (sale)
Retoninv = return on invested capital (ROAI) Roe = return on equity (ROE)
Cshares = common shares (CSHO)
Divxdate = dividends per share for which ex-dividend dates occurred during the reporting period (DVPSX)
Salegr = sales percentage change for one year (SALECHG1)
Totalcomp = Total CEO compensation in dollars (from SEC proxies) BailoutK = bailout funds in thousands
MODEL
Following the second anniversary of the 2006 executive compensation disclosure rules, the SEC reviewed the executive compensation disclosures to date and suggested some measures which were deemed appropriate for setting CEO compensation levels. The measures recommended by the SEC are EPS, EBITDA, growth in net sales, and growth in market share. Pursuant to prior research, the SEC’s suggestions and a cursory review of selected CD&A from my sample, I use the following model and variables to test the degree to which the CEO compensation is associated with both accounting and market performance measures for 2006, 2007, and 2008 separately. I predict that as CEO compensation declines over this time period, there will be increased significance of the performance measures in relation to CEO compensation. To test this prediction, the following model from Nourayi (2008) is adapted to include the performance measures listed below:
Total compensation = $0 + $1 size + $2 performance + , (1)
where performance variables are the following (Compustat Mnemonics in parentheses): Total compensation = Total CEO compensation in millions (from SEC proxies) Size = natural log of assets (AT)
Performance variables:
One year total stock return (TRT1Y) Return on assets (ROA)
Earnings per share excluding extraordinary items (EPSPX) Return on invested capital (ROAI)
Return on equity (ROE)
One year sales growth (SALECHG1)
Consistent with prior research, I find the accounting and market performance variables to be significantly correlated (not displayed) for 2006-2008. Thus, I test separately each of the performance variables in the multivariate analysis in order to avoid multicollinearity (Tables 3-5).
RESULTS
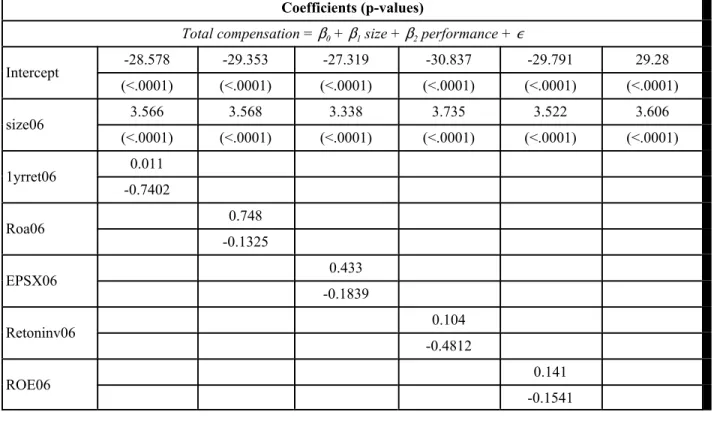
Tables 3-5 display the results of the separate Ordinary Least Squares (OLS) regressions for each of the sample years, 2006-2008. Table 3 shows that none of the performance variables are significantly associated with total CEO compensation in 2006, supporting the lack of a pay for performance model.
Table 3: 2006 Regressions of CEO total compensation on size and performance fundamentals Coefficients (p-values)
Total compensation = $0 + $1 size + $2 performance + ,
Intercept -28.578 -29.353 -27.319 -30.837 -29.791 29.28 (<.0001) (<.0001) (<.0001) (<.0001) (<.0001) (<.0001) size06 3.566 3.568 3.338 3.735 3.522 3.606 (<.0001) (<.0001) (<.0001) (<.0001) (<.0001) (<.0001) 1yrret06 0.011 -0.7402 Roa06 0.748 -0.1325 EPSX06 0.433 -0.1839 Retoninv06 0.104 -0.4812 ROE06 0.141 -0.1541
Table 3: 2006 Regressions of CEO total compensation on size and performance fundamentals Coefficients (p-values)
Total compensation = $0 + $1 size + $2 performance + ,
Salegr06 0.019
-0.4913
Adj R2 0.6129 0.6223 0.6204 0.6328 0.6232 0.6155
N 103 104 104 96 103 104
See Table 2 for variable definitions.
Table 4 demonstrates that as CEO pay is declining, the one year stock return, EPS and ROE are significantly associated with CEO pay, indicating that pay is more closely aligned with performance in these firms for 2007. The TARP rules are not in effect until the end of 2008, but 2007 is the first year the SEC revised disclosure rules are in effect (effective December, 2006), thus requiring increased transparency through enhanced tabular and narrative disclosure, It is interesting to note that the decrease in CEO pay in 2007 coincides with the effective date of the 2006 enhanced disclosure rules for executive compensation.
Table 4: 2007 Regressions of CEO total compensation on size and performance fundamentals Coefficients (p-values)
Total compensation = $0 + $1 size + $2 performance + ,
Intercept -22.745 -27.55 -27.463 -28.689 -29.154 -29.525 (<.0001) (<.0001) (<.0001) (<.0001) (<.0001) (<.0001) size06 3.149 3.398 3.366 3.514 3.192 3.475 (<.0001) (<.0001) (<.0001) (<.0001) (<.0001) (<.0001) 1yrret06 0.096 -0.0051 Roa06 0.0245 -0.9086 EPSX06 0.076 -0.0312 Retoninv06 0.0025 -0.9329 ROE06 0.372 -0.0002
Table 4: 2007 Regressions of CEO total compensation on size and performance fundamentals Coefficients (p-values)
Total compensation = $0 + $1 size + $2 performance + ,
Salegr06 0.094
-0.0242
Adj R2 0.5183 0.4823 0.5041 0.4962 0.5424 0.5061
N 110 111 111 106 110 111
See Table 2 for variable definitions.
Table 5 shows results for tests of 2008 performance variables, with ROA, EPS and ROE all significant. However, contrary to predictions, the signs are negative, indicating that these earnings-related variables are not useful in explaining compensation in loss years, as prior research has determined (Jackson, Lopez & Reitenga, 2008). This time period coincides with the deepening of the economic crisis that began in 2006 and as noted in Table 2, most performance measures are declining. In spite of the increased scrutiny from the SEC and the imposition of TARP regulation on executive compensation, CEO pay does not reflect performance in 2008.
Table 5: 2008 Regressions of CEO total compensation on size and performance fundamentals
Coefficients (p-values)
Total compensation = $0 + $1 size + $2 performance + ,
Intercept -15.57138 -15.671 -15.456 -16.136 -15.737 -15.904 (<.0001) (<.0001) (<.0001) (<.0001) (<.0001) (<.0001) size06 1.972 1.995 1.965 2.055 1.991 2.036 (<.0001) (<.0001) (<.0001) (<.0001) (<.0001) (<.0001) 1yrret06 -0.012 -0.349 Roa06 -0.272 -0.0139 EPSX06 0.056 -0.0016 Retoninv06 -0.03 -0.3273 ROE06 -0.03 -0.0328
Table 5: 2008 Regressions of CEO total compensation on size and performance fundamentals Coefficients (p-values) Salegr06 -0.006 -0.8145 Adj R2 0.4336 0.4609 0.4807 0.4391 0.449 0.4291 N 108 108 108 104 107 108
See Table 2 for variable definitions.
CONCLUSIONS
In summary, the pay for performance predicted for TARP recipient firms is partially supported, but only for 2007, which coincides with effective date of the SEC enhanced disclosure laws. None of the performance variables significantly explain CEO compensation in 2006. The one year stock return, EPS, and return on invested capital are significant variables in 2008, but the signs are not positive as expected. This confirms prior research findings that earnings-based performance measures are not useful in explaining compensation in loss years (Jackson, Lopez & Reitenga, 2008). Future research should track these firms as the executive compensation limits expire upon repayment of TARP funds.
REFERENCES
American Recovery and Reinvestment Act (ARRA) (2009). Section 7001, Executive Compensation and Corporate Governance, 564-575.
Anson, M., R.T. White, W. McGrew & B. Butler (2004). Fair or excessive? A reliable model for determining the appropriateness of executive compensation. Ivey Business Journal Online, May/June, 1-8.
Baber, W., S. Kang & K. Kumar (1999). The explanatory power of earnings levels vs. earnings changes in the contest of executive compensation. The Accounting Review, 74(4), 459-472.
Benjamin, M. & J. Goldman (2009). Obama wants shareholders to have bigger say on pay (Update 1). Retrieved May 13, 2009, from RLINK"http://www.bloomberg.com/apps/
news?pid=20670001&sid=azYjtx8hD8yE"http://www.bloomberg.com/apps/news?pid=20670001&sid=azY jtx8hD8yE
Core, J., R. Holthausen & D. Larcker (1999). Corporate governance, chief executive officer compensation, and firm performance. Journal of Financial Economics, 51(3), 371-406.
Donahue, S.M. (2008). Executive compensation: The new executive compensation disclosure rules do not result in complete disclosure. Fordham Journal of Corporate & Financial Law, 13(1), 59-87.
Friedland, J. (2004). Talking options and oranges: The limits of regulation. International Journal of Disclosure and Governance, March, 1(2), 104-106.
Gaver, J. & K. Gaver, (1988). The relation between nonrecurring accounting transactions and CEO cash compensation. The Accounting Review, 73(2), 235-253.
Jackson, S. B., T.J. Lopez & A. L. Reitenga (2008). Accounting fundamentals and CEO bonus compensation. Journal of Accounting and Public Policy, 27, 374-393.
Kropp, R. (2009). CalSTRS issues guidelines for adoption of executive compensation policies. Retrieved May 15, 2009, from http://www.socialfunds.com/news/print.cgi?sfArticleId=2698
Lambert, R. & D. Larcker (1987). An analysis of the use of accounting and market measures of performance in executive compensation contracts. Journal of Accounting Research, 25(3), 85-125.
Levitt, A. (2005). Corporate culture and the problem of executive compensation. Journal of Corporation Law, Summer, 30(4), 749-753.
New York Times (2009). Adding up the government’s total bailout tab. Retrieved on May 26, 2009 from http://www.nytimes.com/interactive/2009/02/04/business/20090205-bailout-totals-graphic.html
Nourayi, M. & S.M. Mintz (2008). Tenure, firm’s performance, and CEO ‘s compensation. Managerial Finance, Vol. 34(8), 524-536.
Nourayi, M. & F.P. Daroca (2008). Core compensation, firm performance and operational characteristics. Managerial Finance, 34(8), 562-584.
ProPublica (2009). Eye on the bailout. Retrieved May 25, 2009, from http://bailout.propublica.org/main/list/index Schooley, D.K. (2005). Corporate governance reform: Electing directors through shareholder proposals. The CPA
Journal, October, 75(10), 62-64.
SEC (2006). Executive compensation and related person disclosure. SEC Release 33-8732A, Final Rule. Retrieved on May 15, 2009, from http://www.sec.gov
Sloan, A. (2009). The financial meltdown’s unhappy anniversary. Retrieved May 15, 2009, from http://money.cnn.com/2009/05/15/news/economy/bear.stearns.fortune/index.htm?section=money_latest Sloan, R. (1993). Accounting earnings and top executive compensation. Journal of Accounting and Economics, 16(1-3),
55-100.
Strier, F. (2007). Stealth compensation. International Journal of Disclosure and Governance, 4(2), 132-144. White, J. (2009). Executive compensation disclosure: Observations on year two and a look forward to the changing
landscape for 2009. Retrieved on May 25, 2009, from http://www.sec.gov/news/speech/2008/spch102108jww.htm
EVIDENCE OF R&D EFFECTS ON
CROSS SECTIONAL STOCK RETURNS
Yuhong Fan, Weber State University
F. Mark Case, Eastern Kentucky University
ABSTRACT
This article provides evidence on the effects of R&D expenditures on firms’ subsequent stock returns. Results show that R&D expenditures scaled by firms’ market value and total assets are significantly associated with their subsequent returns when other fundamental variables (market return, firm’s market value and price to book ratio) are accounted for. Such effects are larger for the upper quintile R&D expenditure firms (those with higher R&D investments) than to total sample firms. Evidence also shows that R&D expenditures affect firms’ returns up to the third year following the R&D investment.
INTRODUCTION
There exist numerous studies exploring the topic of economic, market, or firm specific factors affecting stock returns. For example, the pioneering work of the Sharp-Lintner asset-pricing model (Sharpe 1964 & Lintner 1965) shows that expected returns on securities are a positive linear function of their market $s, which can describe cross sectional expected returns. Market risk measurement ($) is not the only variable to draw attention from researchers; other variables such as firm size and leverage also draw researchers’ interests due to their ability to capture stock risks and explain variability of returns. Banz (1981)found that average returns on small size stocks are too high based on their $ estimates while average returns on large size stocks are too low. Bhandari (1988) proposes that leverage helps explain the cross section of average stock returns in a test that includes size as well as $. Fama and French (1992) confirmed that size and book-to-market ratio could capture the cross-sectional stock returns together with $, leverage, and earnings-price ratios. It is interesting that in this study, market b seems to have no role in explaining average returns, while size and book-to-market equity capture cross-sectional variation in average stock returns.
While the book to market phenomena are well accepted among researchers, Lev and Sougiannis (1999) examine book to market ratio effects as explained by R&D investment. These authors argue that R&D capital as an innovative effort will affect subsequent stock returns. The argument is that a firm’s market value differs from its book value by the present value of their future abnormal earnings, and that future abnormal earnings are the result of either monopoly power or