©BEYKENT UNIVERSITY
PRELIMINARY SEISMIC RISK
ASSESSMENT OF URBAN BUILDING STOCKS:
A CASE STUDY FOR DENIZLI-TURKEY
Hasan KAPLAN, Salih YILMAZ
Pamukkale University, Department of Civil Engineering, Denizli, Turkey, 20070
[email protected], [email protected] Erdal AKYOL, Gulmustafa ŞEN
Pamukkale University, Department of Geological Engineering, Denizli, Turkey, 20070
[email protected], [email protected] Niyazi DAYANIR
Denizli Municipality, Directory of Public Works, Denizli, Turkey, 20017
ABSTRACT
In order to reduce earthquake damages, it is crucial to estimate seismic performance of buildings in tectonically active areas. Structural system, date and quality of construction and geotechnical properties of soil are important parameters, which affect seismic behavior of the buildings. In this study, building inventory data collected by Turkish Statistical Institute are used to assess the damage states to buildings in Denizli City. Damage assessment for the buildings is made based on an earthquake of magnitude 6.4 on Pamukkale fault line. HAZUS methodology is adapted to reflect building stock in Turkey. Building damage, life loss and maximum ground acceleration maps, which will be used to prepare emergency plans and take safety measures, are proposed for Denizli.
Key Words: Earthquake, Damage assessment, Capacity spectrum method, Denizli
ÖZET
Deprem zararlarının azaltılması için, tektonik olarak aktif alanlardaki yapıların deprem performanslarının belirlenmesi oldukça önemlidir. Yapısal sistem, yapım zamanı ve kalitesi ile yapı zemininin geoteknik özellikleri yapının deprem davranışım etkileyen önemli parametrelerdir. Bu çalışmada, Türkiye İstatistik Kurumu tarafından hazırlanan bina envanteri kullanılarak Denizli şehir merkezindeki yapılar için hasar seviyeleri belirlenmiştir. Binalar için hasar tahmini Pamukkale Fayında meydana gelmesi öngörülen 6.4 büyüklüğündeki deprem için yapılmıştır. HAZUS yöntemi Türkiye bina stoğunu yansıtacak şekilde değiştirilerek kullanılmıştır. Acil durum planlarının
hazırlanması ve gerekli önlemlerin alınması için kullanılacak olan bina hasarı, can kaybı ve maksimum yer ivmesi haritaları Denizli şehir merkezi için verilmiştir.
Anahtar Kelimeler: Deprem, Hasar tahmini, Kapasite spektrumu yöntemi, Denizli
1. INTRODUCTION
Erzincan Earthquake (Ersoy, 1992), occurred in 1992, shows that building stock in Turkey is under a risk taking into account seismic loads. This has been proved by a large number of damaged and collapsed buildings in
1995-Dinar (Kaplan, 1996), 1998-Ceyhan (Kaplan et al., 1998), 1999 Marmara (Sucuoğlu et al., 2000), and 2003-Bingol earthquakes (Kaplan et al., 2004). The excessive number of fragile buildings against lateral loads is of major importance for Turkey.
Cities which are under seismic risk must have master disaster plans. After a probable earthquake, number of deaths, injuries, building damages and their intensity should be known to prepare these plans. In order to prevent earthquake losses, damage assessment is highly essential and the short and long term disaster plans can be prepared based on this information.
Denizli is an important commercial, industrial and tourist city located in Western Turkey. As the city is located on a seismically active region, past earthquakes have caused many casualties and damages in the city (Kaplan et al., 2003). Therefore, an earthquake damage assessment is vital to reduce seismic losses in the city.
Current approaches in seismic vulnerability evaluation methods follow three main stages: walk-down, preliminary and final evaluations (Özcebe et al., 2003). All these stages require time and financial sources. In this study, another stage that does not need giant sources has been employed before the stages mentioned above using the building data collected by Turkish Statistical Institute (TSI) for optimized planning. This raw data, which cannot be used for damage assessment directly, is processed and an earthquake scenario is prepared for the city. The current studies about seismicity of the region and geotechnical investigations (PAU, 2002) are utilized for this purpose.
2. SEISMICITY OF THE REGION
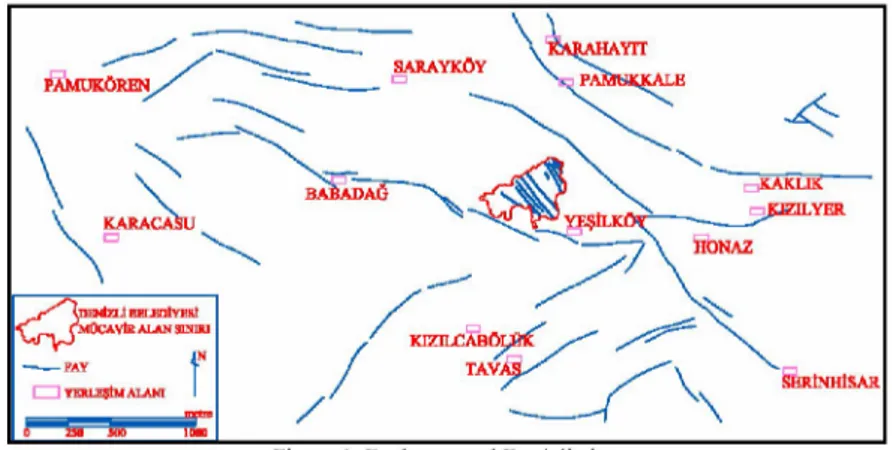
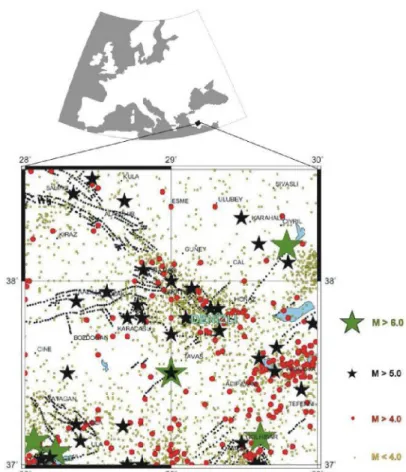
Denizli region is located on a horst and graben system in western Turkey. Specifically, Denizli is in the junction of Menderes and Gediz graben systems. The normal faults, bound the grabens, produce a large number of earthquakes and cause damages in the region (Figure 1). The first casualties have been reported for Hierapolis, Tripolice and Laodikeia in the ancient time. Some major earthquakes, occurred before 1900, have been listed on Table 1. The recorded earthquakes having magnitudes greater than 4.5 since 1900 are shown on Table 2. It demonstrates that seismicity of the region is still active and it causes a large number of casualties in modern time. Figure 2 shows all the earthquakes in the region since 1900.
Figure 1. Faults around Denizli city.
Table 1. Historical earthquakes affected Denizli (Ambrasey and Finkel, 1995, Demirtas et al., 2003, Altunel, 2000).
Date Location Magnitude* Deaths/Damage
B.C. 65 Denizli-Honaz 6.2 Affected Honaz and Denizli
B.C. 60 Pamukkale 6.6 Two ancient cities were destroyed
B.C. 26 Aydin-Denizli 6.2 Trails (an ancient city) were
destroyed completely
B.C. 20 Denizli-Akhisar 6.2
-B.C. 17 Gediz-Denizli 6.6 surface ruptures and landslides Damages in 12 ancient cities, B.C. 60 Pamukkale 6.6 Laodikeia and Hierapolis were destroyed completely
B.C. 494 Pamukkale Heavy damage in Hierapolis and
B.C. 494 Pamukkale Phrygia
7th cent. Denizli? - Heavy damage in Hierapolis
1653 Izmir-Alasehir- 6.6 Heavy damage in Denizli, more
1653
Aydin-Denizli 6.6 than 3000 deaths in Izmir and Aydin
1703 Denizli-Saraykoy- 6.2 Heavy damage and 12000 deaths in
1703
Pamukkale 6.2 Denizli, Saraykoy and Pamukkale
1717 Denizli-Saraykoy- 6000 deaths
1717
Honaz 6000 deaths
1744 Nazilli 6.2 Heavy damage and 15000 deaths in
1744 Nazilli 6.2
Nazilli and Denizli
1886 Denizli-Usak - Heavy damage in Denizli and Usak
1889 Denizli 6.6 Some damages in Denizli
*Converted from intensity
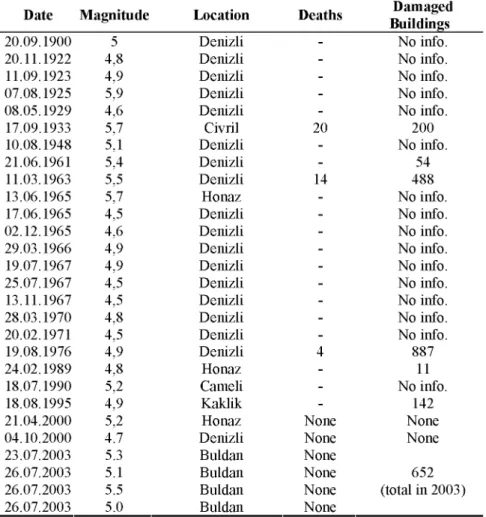
Table 2. Earthquakes occurred around Denizli since 1900 (M>4.5) (DAD, KOERI).
Date Magnitude Location Deaths Damaged
Buildings 20.09.1900 5 Denizli - No info. 20.11.1922 4,8 Denizli - No info. 11.09.1923 4,9 Denizli - No info. 07.08.1925 5,9 Denizli - No info. 08.05.1929 4,6 Denizli - No info. 17.09.1933 5,7 Civril 20 200 10.08.1948 5,1 Denizli - No info. 21.06.1961 5,4 Denizli - 54 11.03.1963 5,5 Denizli 14 488 13.06.1965 5,7 Honaz - No info. 17.06.1965 4,5 Denizli - No info. 02.12.1965 4,6 Denizli - No info. 29.03.1966 4,9 Denizli - No info. 19.07.1967 4,9 Denizli - No info. 25.07.1967 4,5 Denizli - No info. 13.11.1967 4,5 Denizli - No info. 28.03.1970 4,8 Denizli - No info. 20.02.1971 4,5 Denizli - No info. 19.08.1976 4,9 Denizli 4 887 24.02.1989 4,8 Honaz - 11 18.07.1990 5,2 Cameli - No info. 18.08.1995 4,9 Kaklik - 142
21.04.2000 5,2 Honaz None None
04.10.2000 4.7 Denizli None None
23.07.2003 5.3 Buldan None
26.07.2003 5.1 Buldan None 652
26.07.2003 5.5 Buldan None (total in 200
26.07.2003 5.0 Buldan None
Physical and mechanical characteristics of the studied soils change in a very wide perspective which varies from rock to organic clay. In general terms, the locations with lower altitude tend to show weaker strength and vice versa. It is also valid for seismic behaviors of the soils, differences of which have also been noticed, such as, soil amplification factor can reach up to 2.4 while it is 1.0 in some locations. Soil classifications based on Turkish Building Codes (MPW, 1997) have been completed and elastic demand spectrums have been calculated in every quarter.
28' 29' 30'
Figure 2. Earthquake epicenters occurred around Denizli since 1900 (KOERI).
3. STATISTICAL BUILDING DATA
Statistical building data are collected by TSI that makes building inventories periodically in Turkey. The last one was carried out in 2000. The data, taken directly from administrators/owners of the buildings, are collected to prepare economical plans and to make clear demographic structure and they include below:
• Quarter of the building, • Date of construction, • Usage type of the building, • Constructer of the building, • Owner of the building,
• Structural system and wall material, • Floor area,
• Land area,
• Number of storeys, • Number of flats,
• Number of rooms,
• Number of commercial sections in ground floor, • Number of commercial sections in other floors, • Number of industrial sections,
• Type of sewer system,
• Physical condition of the building • Properties of building about: • Water system • Gas installations • Elevator • Fire stairs • Garages • Heating system
• Fuel type used for heating
Some of the information listed above has not any influence for seismic risk assessment while some ones are of importance. As it can be seen, they are raw data, and need to evaluate to use.
4. EVALUATION OF INVENTORY DATA
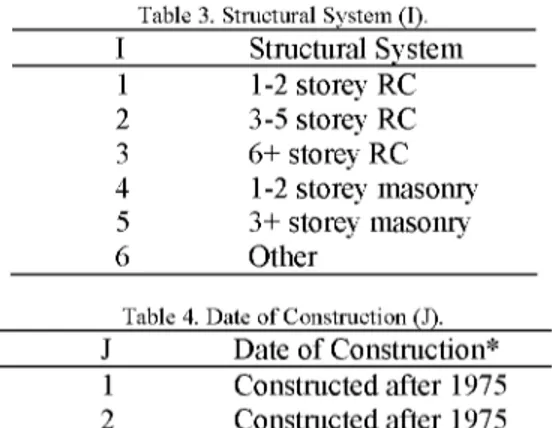
Inventory data have been converted into a format that can be used for building damage assessment. Three parameters, namely structural system (I), date of construction (J) and building quality (K), are used for the estimation. Different values of parameters I, J, K are explained in Table 3, 4 and 5 respectively. Parameters I and J can be obtained directly from statistical data. To determine the building quality, each building is graded and classified.
Table 3. Structural System (I).
I Structural System 1 1-2 storey RC 2 3-5 storey RC 3 6+ storey RC 4 1-2 storey masonry 5 3+ storey masonry 6 Other
Table 4. Date of Construction (J).
J Date of Construction*
1 Constructed after 1975
2 Constructed after 1975
*Turkish Earthquake Code was changed in 1975
Table 5. Building Quality (K).
K Quality Class 1 Good
2 Fair 3 Low Grading Procedure
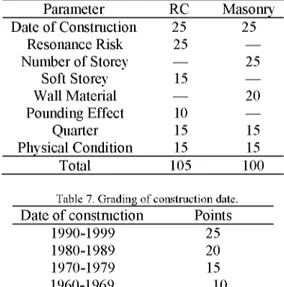
The buildings are classified as poor, fair and good. In order to do that based on the structural system, they are graded, and Table 6 shows the grading system. A total of 105 points for reinforced concrete (RC) structures and 100 points for masonry structures are proposed. The buildings classified into three groups, namely low, fair and good quality, which have <40 points, between 40 and 70 points and >70 points respectively. After grading the buildings with 40 points or lower are assigned as low quality. Grading procedure is explained as follows:
Date of Construction
Considering data structure and factors affecting building quality like code revisions and use of ready mix concrete, newer buildings have higher points. Grading of construction date is given in Table 7.
Table 6. Grading Parameters.
Parameter RC Masonry Date of Construction 25 25 Resonance Risk 25 — Number of Storey — 25 Soft Storey 15 — Wall Material — 20 Pounding Effect 10 — Quarter 15 15 Physical Condition 15 15 Total 105 100
Table 7. Grading of construction date.
Date of construction Points
1990-1999 25 1980-1989 20 1970-1979 15 1960-1969 10 Before 1960 0 Resonance
This point reflects probability of resonance, probability of which increases as period of building and soil get closer to each other. In order to calculate period of building, its height (H) is calculated. If there is any commercial space at ground floor, its height is assumed to be 3.5 meters; otherwise it is taken as 2.8 meters. Story height is taken as 2.8 meters for upper ones. Natural period (Tb) for a RC structure is calculated by Eq. 1.
Tb = 0.07 • H
-Using approximate natural period of soil vibration obtained for each quarter and that of structure, a resonance grade is assigned to each RC building by Eq. 2. For masonry structures resonance grade is not calculated.
RP = 5 •
max(
To,
Tb )
SAmm(T0, Tb ) J/ (2)
In this equation, T0 is natural period of the soil, Tb is the natural period of the building and SA stands for soil amplification ratio. RP is the calculated resonance point. This point is calculated for RC structures only.
Number of storeys for masonry structures
The masonry structures are classified into four groups as shown in Table 8.
Table 8 Number of storeys for masonry structures.
Number of Storeys Point 1 2 3 4+ 25 15 5 0 Soft Storeys
Past earthquakes showed how soft storeys cause failure and collapse of buildings. The ground floor spaces are generally used for commercial purposes. Therefore, they have lesser infill walls and exterior walls and higher floor levels to have large spaces and shop windows, which cause soft storeys and major damages. In this study, ground floors having 2 or more commercial spaces assumed as soft storey.
Wall Material in Masonry Structures
Load carrying system in masonry structures are walls. Materials used in walls directly affect the building quality. In Table 9, grading for different wall materials is given. Local development in material quality is taken into consideration in the grading system.
Pounding in R C Structures
Pounding of adjacent structures is an important damage reason. TSI data do not include whether a building has a pounding risk or not. However, data include base and land area of the buildings. Land usage ratio is calculated using these two data. High land usage ratio increases the probability of a building being adjacent with another one. In Table 10, grades for different land usage ratios are given.
Table 9. Affect of wall material for masonry structures.
Wall Material Point
Stone 20 Brick (before 1980) 17 Brickets 13 Brick (after 1980) 10 Wooden 7 Sundried brick 4 Other/Unknown 10
Table 10. Grading for land usage ratio.
Land Usage Ratio Point
>%85 0
>%70 2
>%50 5
<%50 10
Quarter Point
Quarters that shape cities are not only administrative borders but also socio-economical borders. On the other hand, formation of quarters has an important role in urbanization process of cities.
Seismic vulnerability increases with decreasing economical status. In a developed country, an earthquake of the same magnitude causes less damage than in a poor one. This can also be said for different socio-economical regions in a country. The same relation can be established even in a city. Construction quality in different parts of a city may differ due to these factors, which can lead an intensity of unlicensed and uncontrolled constructions in some areas.
Considering socio-economical status and general construction quality according to their location, points of all buildings ranging between 0 and 15 are given.
Physical Condition of the Building
During the site work carried by TSI, the building owners/administrators questioned whether their buildings need a restoration or not. Their opinion about the buildings is converted into points between 0 and 15.
Building Stock in Denizli
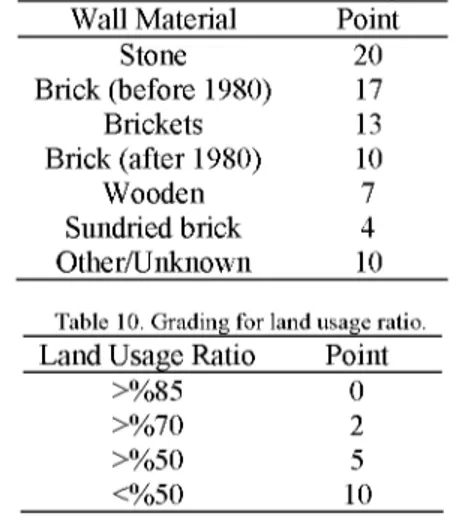
In Denizli, 65% of the buildings have RC structural system, 33% of the stock is masonry and the rest is constructed using other structural systems (Figure 3).
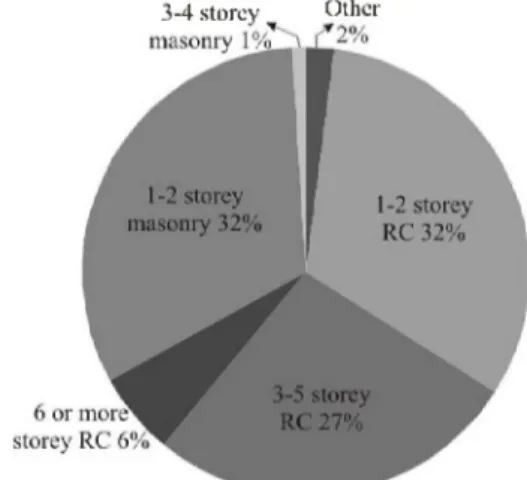
RC structures, which are 2/3 of the stock, are mostly constructed after 1970. On the other hand 1/3 of masonry structures are constructed before that (Figure 4).
The city has grown fast by migrations due to industrial development after 70s. Therefore, number of buildings increased rapidly. In this process, old
buildings were not replaced. Instead, owners preferred to use old ones and they constructed new buildings in unurbanized areas. Therefore, non-circulation of building stock has caused poor city-planning.
Figure 3. Distribution of buildings according to structural system.
Distribution of buildings according to their number of storeys is shown in Figure 5. Almost all of the masonry buildings have 1 or 2 storeys. 1/6 of RC structures have 5 or more storeys, in which damage and losses increase with respect to ones having fewer storeys in Turkey. These multi-storey and old masonry buildings are in central parts of the city mostly.
After grading, all buildings are qualified as good (K=1), fair (K=2) or low (K=3). Distribution of buildings according to this qualification is shown in Figure 6.
Half of RC structures can be described as fair quality, where only a quarter is qualified as good. On the other hand, 69% of the masonry structures are good quality buildings as 75% of them have one storey.
5. DAMAGE ESTIMATION METHODOLOGY
Nonlinear static (pushover) analysis is a popular and efficient analysis method used in structural engineering. Building capacity against lateral loads can be calculated by pushover analysis without nonlinear dynamic analysis. Capacity spectrum method (CSM) is another efficient tool that used to determine a building's displacement level (performance) for a given earthquake demand.
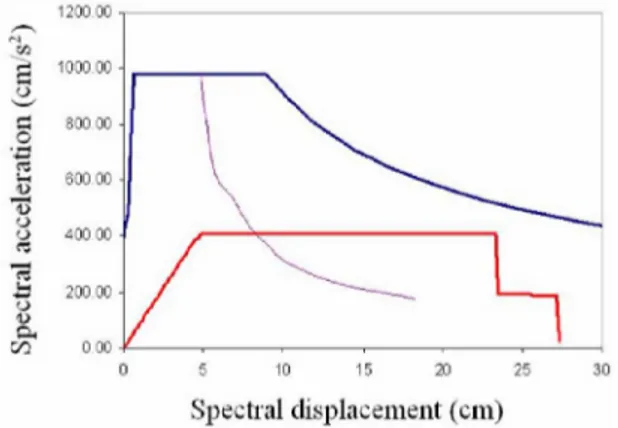
Details can be found at ATC-40 (1996). In this paper, procedure B of CSM is utilized (Figure 7) as it is more appropriate for programming.
There are many factors affecting building capacity. Capacity of a building is defined with its lateral load carrying capacity and ductility. However, these may change significantly with changes in material quality,
lateral and longitudinal reinforcement ratios, structural system type, structural irregularities and some other factors.
Up to 1949 1950-59
1% Up to 1949
5%
1990-99 38%
Figure 4. Distribution of buildings according to date of construction; a) RC, b) Masonry.
7 - storeys
6 storeys r ^
4% * r "
3 storevs 4 storeys
Figure 5. Distribution of buildings according to number of storeys; a) RC, b) Masonry.
Low
31%
Figure 6. Distribution of buildings according to quality; a) RC, b) Masonry.
In this study, coefficients that define building capacity were modified to reflect building stock in Turkey. These parameters have been tailored from HAZUS (1997) (EDMPI, 2000). In this study, the capacity is obtained using 3 parameters (I, J, K) of building. After that, capacity curves are converted into capacity spectrum (ADRS format).
Spectral displacement (cm)
Figure 7. Calculation of seismic performance of a building by procedure-b of CSM building capacity.
Demand Spectrum
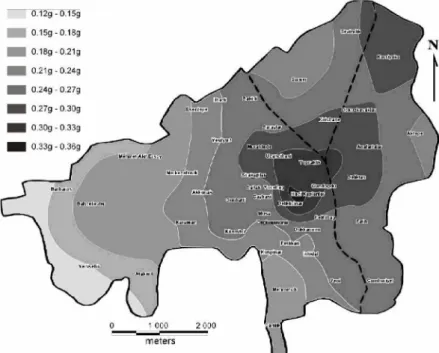
Another factor affecting the performance of a building is the earthquake demand. Maximum expected earthquake around Denizli city center would have a magnitude of 6.4 considering the faults around the city. Peak ground acceleration maps of the city is taken from Kaplan et al. (2006) and shown in Figure 8. This map is prepared using attenuation relationship proposed by Boore et al. (1997). Map shows peak accelerations arisen from Pamukkale
fault line which is treating the city. Using this information, acceleration spectrums are prepared and converted into ADRS format.
Damage and Loss Estimation
To determine seismic vulnerability of structures, CSM is utilized to calculate performance points of each structure. Concerning geographical location of buildings, different demand spectrums are used in the calculation.
In this study, building damages classified into 4 categories: light, moderate, heavy, very heavy. Buildings, not included in any one of these, are considered as non-damaged. Definitions for these damage states are given in (HAZUS, 1997; EDMPI, 2000). Each damage state is characterized by median and standard deviation of earthquake damage.
Figure 8. Expected peak ground accelerations in Denizli after a probable earthquake on Pamukkale fault (Kaplan et al., 2006).
Varying ratios of very heavily damaged structures, depend upon structural system, are assumed as collapsed buildings. For RC structures, 20% of 1-2 storey (I=1), 15% of 3-5 storey (I=2), and 10% of higher (I=3) very heavily damaged structures and 25% of very heavily damaged masonry structures are expected to collapse. Injury matrices given in HAZUS (1997) to estimate the number of injuries and deaths are adapted to the cases in Turkey. In Anatolian earthquakes, deaths are 5 times more than the ones in the U.S.A. Based on this information and other observations, injury matrices
proposed for Turkey is given in Table 11 for RC structures and in Table 12 for masonry structures. Injuries are categorized into 4 groups as follows:
1s degree injuries 2nd degree injuries 3rd degree injuries 4th degree injuries
: Medical treatment on foot. : Short term treatment in hospital. : Long term treatment in hospital. : Injury results in death.
Average house costs (per 1 m ) in each quarter are determined by field investigations to calculate economical losses. It is assumed that heavily or very
heavily damaged buildings will loose all their value. On the other hand,
buildings that have moderate damage will loose 30% and those have light damage will loose 10% of its economical value (EDMPI, 2000).
Table 11. Injury matrix for RC structures (%).
Degree of injury Light Damage Medium Damage Heavy Damage Very Heavy Damage Collapsed 1st 2nd 3rd 4th 0.05 0.005 0 0 0.2 0.02 0 0 1 0.5 0.01 0.01 10 8 0.1 0.1 50 15 10 10
Table 12. Injury matrix for masonry structures (%).
Degree of injury Light Damage Medium Damage Heavy Damage Very Heavy Damage Collapsed 1st 2nd 3rd 4th 0.05 0.005 0 0 0.4 0.05 0 0 2 0.5 0.002 0.002 10 8 0.2 0.2 50 15 10 10
6. DAMAGE SCENARIO
It is estimated that 720 people will be dead after the scenario earthquake. 5050 of 42000 buildings will be heavily damaged and 1100 of them will totally collapse. After such an earthquake, 4400 people will need medical treatment in hospitals. Total economical losses are estimated to be around 1.76 billion dollars.
In Figure 9, damage distribution in RC and masonry structures is illustrated. Only 20% of RC structures will be damaged heavily or very heavily, whereas this ratio increases up to 42% for masonry structures.
Ratios of serviceable flats after scenario earthquake are shown in Figure 10. 74300 of flats in the city are in RC structures. Only 15800 flats are in masonry structures. After the earthquake, 17300 of them will be out of service. 38000 would be usable after a seismic retrofit and strengthening of the
structures. In light of this data, 75000 people will be faced with sheltering problem. It is estimated that 1.6 billion dollar of all the economical losses would result from damages in RC structures. This estimation does not include industrial damages and work-day losses which are crucial for the industrialized city of Denizli.
Figure 9. Damage distribution; a) RC, b) Masonry.
Estimated damages in the city are also mapped and Figure 11 shows collapse ratio of buildings. Old and squatter parts of the city are the most critical regions. Deaths in 1 km2 area are illustrated in Figure 12.
In service alter simple repair 20% Oui of service 16% In service after strengthening 45% In service after simple repair 15% In service after strengthening 30%
Figure 10. Serviceability of flats; a) RC, b) Masonry.
In Figure 13, economical losses per capita are figured out. It is so similar to damage maps as they increase with the damage. Another major problem that will be faced with after the quake is the sheltering. The flats which cannot be used after the earthquake are given in Figure 14.
7. RESULTS
Denizli is located at the junction of Menderes and Gediz grabens, which are tectonically highly active. They cause a large number of catastrophic earthquakes both in historical and recent times.
Although, current approaches in seismic vulnerability evaluation methods include three main stages: walk-down, preliminary and final evaluations which require abundant time, qualified workmanship and financial sources in this study. Another stage that does not need giant sources has been employed before starting the stages for optimized planning.
Evaluation of seismic vulnerabilities of buildings in Denizli is performed based on the statistical data obtained by TSI. The data are evaluated to obtain each building's structural system, construction date and quality. The developed scenario includes both the structural information and geotechnical properties.
Capacity spectrum for each building is calculated using the parameters adapted from HAZUS to reflect building stock in Turkey. The demand spectrums are shaped by attenuation relations. Then, using the CSM, performance of each building is calculated as spectral displacements, which is used to define seismic vulnerability of structures.
Damages are observed mostly in old settlement and the squatters areas, in which masonry structures are the most popular ones.
The study estimates that 720 people will be dead after the scenario earthquake. 5050 of 42000 buildings will be heavily damaged and 1100 of them will totally collapse. After such an earthquake, 4400 people will need medical treatment in hospitals and total economical losses will be around 1.76 billion dollars.
After the earthquake, 17300 flats will be out of service while 38000 of them would be usable after seismic strengthening. In light of the obtained
results, 75000 people will be faced with sheltering problem in Denizli.
8. REFERENCES
Altunel, E.; Ricerche Archeologiche Turche Nella Valle Del Lykos; Eds.: F. D'Andria and F. Silvestrelli, (2000), 315-331, (in French).
Ambrasey, N. N. and Finkel, C. F.; The Seismicity of Turkey and Adjacent Areas: A Historical Review (1500-1800), Eren Publications, Istanbul,
(1995).
ATC (1985) Applied Technological Council, ATC-13 Earthquake Damage Evaluation Data for California, USA.
ATC (1996) Applied Technological Council, ATC-40 Seismic Evaluation and Retrofit of Concrete Buildings, Redwood City, California, USA.
Boore, D. M., Joyner, B. J., Fumal, T. E.; Equations for Estimating Horizontal Response Spectra and Peak Acceleration from Western North American Earthquakes: A Summary of Recent Work, Seismological Research Letters, 68, (1997), 128-151.
DAD, Earthquake Research Center, www.deprem.gov.tr
Demirtas, R., Erkmen, C., Yaman, M., Eravci, B., Aktan, T., Tepeugur, E. and Ozdemir, F.; Active Faults around Denizli and Paleosismicity of Pamukkale Fault, Report to DAD, Ankara, (2003).
EDMPI (2000) Earthquake Disaster Master Plan for the city of Izmir, www.koeri.boun.edu.tr
Ersoy, U.; Erzincan Earthquake and RC Structures - Technical Report on 13 March 1992 Erzincan Earthquake, TMMOB - Association of Civil Engineers, Ankara, Turkey, (1992).
HAZUS (1997), Earthquake loss estimation methodology technical manual prepared by the National Institute of Building Sciences for Federal Emergency Management Agency (FEMA).
Kaplan, H.; Damages of Dinar Earthquake on 1st October 1995 and their
Prevention, Journal of Engineering Sciences, Vol. 2 (1996), 25-34, (in Turkish).
Kaplan, H., Binici, H., Un, H.; The Ceyhan Earthquake of June 27, 1998 and Design of Earthquake Resisting Buildings, Journal of Engineering Sciences, Vol. 4, (1998), 853-863, (in Turkish).
Kaplan, H., Inel, M., Senel, S. M., Toprak, S., Tama, Y. S., Kayhan, A. H., Ozsoy, I., Yazar, E., Yilmaz, S.; Technical Report on 23-26 July 2003 Buldan/Denizli Earthquakes, Denizli, (2003).
Kaplan, H., Yilmaz, S., Binici, H., Yazar, E., Cetinkaya, N.; May 1, 2003 Turkey-Bingöl Earthquake: damage in reinforced concrete structures, Engineering Failure Analysis Vol. 11, (2004), 279-291.
Kaplan, H., Yılmaz, S., Akyol, E., Şen, G., Dayanır, N.; Preliminary Seismic Risk Assessment Based on Statistical Data, 2nd ASIA Conference on
Earthquake Engineering (ACEE2006-IVA4) Manila, Philippines, (2006). KOERI, Kandilli Observatory and Earthquake Research Institute,
www.koeri.boun.edu.tr
MPW, (1997) Ministry of Public Works, Turkish Earthquake Code, Ankara. Özcebe, G., Yucemen, M. S., Yakut, A., Aydogan, V.; Seismic Vulnerability
Assessment Procedure for Low- to Medium-Rise Reinforced Concrete Buildings, METU, Ankara, Turkey (2003).
PAU, (2002) Geological, Hydrogeological and Geotechnical Properties of Denizli Municipality, Technical Report (in Turkish).
TSI, Republic of Turkey, Prime Ministry Turkish Statistical Institute (TURKSTAT), www.tuik.gov.tr
Sucuoğlu, H., Gulkan, P., Yilmaz, C., Bakir, S., Ozcebe, G., Ersoy, U., Tankut, T., Gur, T., Akkar, S., Erberik, A., Yilmaz, T.; Technical Report on Marmara and Duzce Earthquakes, METU- EERI, Ankara (2000).
![M. KADIOĞLU, Die Scaene frons des Theaters von Nysa am Maander. Forschungen in Nysa am Maander. Band 1 (2006). Mainz am Rhein. [Kitap Tanıtımı]](data:image/gif;base64,R0lGODlhAQABAIAAAP///wAAACH5BAEAAAAALAAAAAABAAEAAAICRAEAOw==)