Contents lists available atScienceDirect
Atherosclerosis
j o u r n a l h o m e p a g e :w w w . e l s e v i e r . c o m / l o c a t e / a t h e r o s c l e r o s i s
The association of serum uric acid levels on coronary flow in patients with STEMI
undergoing primary PCI
Mahmut Akpek
a, Mehmet G. Kaya
a,∗, Huseyin Uyarel
b, Mikail Yarlioglues
a, Nihat Kalay
a,
Ozgur Gunebakmaz
a, Orhan Dogdu
a, Idris Ardic
a, Deniz Elcik
a, Omer Sahin
a,
Abdurrahman Oguzhan
a, Ali Ergin
a, Charles M. Gibson
caDepartment of Cardiology, Erciyes University School of Medicine, Kayseri, Turkey bDepartment of Cardiology, Balikesir University School of Medicine, Balikesir, Turkey
cDepartment of Medicine, Beth Israel Deaconess Medical Center, Harvard Medical School, Boston, MA, USA
a r t i c l e i n f o
Article history: Received 15 March 2011
Received in revised form 11 June 2011 Accepted 10 July 2011
Available online 22 July 2011 Keywords:
Uric acid
ST elevation myocardial infarction Primary percutaneous coronary intervention
a b s t r a c t
Objective: Uric acid has been shown as a predictor and an independent risk factor for coronary heart disease, but little is known regarding the association of uric acid levels with coronary blood flow in STEMI. We hypothesized that elevated uric acid levels would be associated with impaired flow and perfusion in the setting of STEMI treated with primary PCI.
Methods: Two hundred and eighty nine patients with STEMI who treated primary PCI were enrolled to study. Patients were divided into two groups based upon the TIMI flow grade. No-reflow was defined as TIMI Grade 0, 1 and 2 flows (group 1). Angiographic success was defined as TIMI 3 flow (group 2). Uric acid, MPV and high sensitive CRP were measured. Major adverse cardiac events (MACE) were defined as in stent thrombosis, non-fatal myocardial infarction and in-hospital mortality.
Results: There were 126 patients (mean age 63± 11 and 71% male) in group 1 and 163 patients (mean age 58± 12 and 80% male) in group 2. Uric acid, MPV, and hs-CRP levels on admission were higher in group 1 (p = 0.0001 for each). A uric acid level≥5.4 mg/dl measured on admission had a 77% sensitivity and 70% specificity in predicting no-reflow at ROC curve analysis. In-hospital MACE was significantly higher in group 1 (29% vs. 7%, p = 0.0001). At multivariate analyses, high plasma uric acid (odds ratio (OR) 2.05, <95% confidence interval(CI) 1.49–2.81; p < 0.0001), hs-CRP (OR 1.02, <95% CI 1.01–1.03; p = 0.0007) and MPV (OR 3.09, <95% CI 1.95–4.89; p < 0.0001) levels were independent predictors of no-reflow post primary PCI and uric acid (OR 2.75, <95% CI 1.93–3.94; p < 0.0001), hs-CRP (OR 1.01, <95% CI 1–1.02; p = 0.006) levels, but not MPV, were independent predictors of in-hospital MACE.
Conclusion: Plasma uric acid level on admission is a strong and independent predictor of poor coronary blood flow following primary PCI and in hospital MACE among patients with STEMI. Except for predictive value, uric acid levels may be a useful biomarker for stratification of risk in patients with STEMI and may also lead to carry further therapeutic implications.
© 2011 Elsevier Ireland Ltd. All rights reserved.
1. Introduction
Rapid restoration of infarct related arterial (IRA) flow is associ-ated with improved ventricular performance and lower mortality among patients with myocardial infarction[1,2]. However, poor arterial flow and no-reflow phenomena may limit the benefits of recanalization of the IRA[3].
Several biomarkers are associated with poorer outcomes in ST-elevation myocardial infarction (STEMI). Mean platelet volume (MPV) is an easily measured platelet indices, which increase
dur-∗ Corresponding author. Tel.: +90 505 3784696; fax: +90 352 4377634. E-mail address:[email protected](M.G. Kaya).
ing platelet activation[4]. Furthermore, increased MPV levels have been associated with poor clinical outcome in survivors of myocar-dial infarction[5]and higher MPV correlates with thrombolysis failure in patients presenting with STEMI treated with thrombolytic therapy[6]. C-reactive protein (CRP) is an acute phase protein and several studies have shown that CRP may have prognostic value in patients with acute coronary syndromes and undergoing percuta-neous coronary intervention (PCI)[7–10].
Uric acid, the end product of purine metabolism in circulation, is an independent risk factor for cardiovascular disease but the underlying pathophysiology is not clear. The relationship between circulatory uric acid levels and endothelial dysfunction has been demonstrated previously[11–13]. It has been shown that coro-nary flow reserve, a marker of corocoro-nary microvascular function, 0021-9150/$ – see front matter © 2011 Elsevier Ireland Ltd. All rights reserved.
is significantly greater in participants with lower serum uric acid concentrations[14]. It has been also demonstrated that high serum uric acid level is associated with slow coronary flow in patients underwent elective angiography[15].
Uric acid has been shown as a predictor and an independent risk factor for cardiovascular events and is also an independent risk fac-tor for coronary heart disease[16,17], but little is known regarding the association of uric acid levels with coronary blood flow in the setting of STEMI. Given that elevated uric acid is associated with poorer flow during elective angiography, we hypothesized that ele-vated uric acid levels would be associated with impaired flow and perfusion in the setting of STEMI treated with primary PCI. 2. Materials and methods
2.1. Study population
Two hundred and eighty nine consecutive patients (male 76% and mean age 60± 12) who were admitted with STEMI within 6 h from symptom onset were enrolled the study. All of the patients were treated with primary PCI at our institution from 2006 to 2010. STEMI was defined as: typical chest pain >30 min duration with ST elevation >1 mm in at least two consecutive leads on the electrocardiogram or new onset left bundle brunch block. Patients were divided into two groups based upon the Thrombolysis In Myocardial Infarction (TIMI) flow grade score[18]. No-reflow was defined as TIMI grade 0, 1 and 2 flows (group 1)[5,8,19–21]post PCI. Angiographic success was defined as TIMI 3 flow (group 2). Exclusion criteria included treatment of STEMI in the previous 24 h with thrombolytic drugs, a history of gout, active infections, sys-temic inflammatory disease, known malignancy, end stage liver and renal failure. Informed consent was obtained from all patients and the protocol was approved by the Ethics Committee and the institutional review board of Erciyes University Medical School. 2.2. Coronary angiography and PCI procedure
All of primary PCI procedures were performed with standard femoral approach with a 7-French guiding catheter. After adminis-tration of 5000 IU of heparin and 300 mg clopidogrel loading dose conventional wire crossing, direct stenting was implanted when-ever possible; in the remaining cases, balloon pre-dilatation was carried out. The type of stents (bare metal or drug-eluting stent) were left to the operator’s discretion. In each patient who treated with tirofiban, tirofiban was administrated after primary PCI pro-cedure in coronary care unit. Use of systemic bolus of tirofiban, followed by a 12-h continuous infusion, was left to the operator discretion. To achieve maximal dilatation each coronary angiogram was preceded by intracoronary injection of 100g nitroglycer-ine. The Thrombolysis in Myocardial Infarction (TIMI) grade was assessed by three independent interventional cardiologists. Intra and inter-observer variabilities were obtained from random sam-ples of 100 patients. The intra- and inter-observer variabilities for TIMI 0–1 were 6 and 8%, respectively; for TIMI 2 the corresponding values were 1 and 3%, respectively; and for TIMI 3 both intra- and inter-observer variability were 0%.
2.3. Laboratory analysis and echocardiography
In all patients, antecubital venous blood samples for the labo-ratory analysis were drawn on admission in the emergency room. Uric acid, glucose and lipid profile were determined by standard methods. High sensitive CRP was measured by using a BN2 model nephlometer (Dade-Behring). Citrate based anticoagulated blood samples stored at +4◦C and MPV levels were measured by Sys-mex K-1000 auto analyzer within 30 min of sampling. Transthoracic
echocardiography was performed for each patient immediately after primary PCI in intensive cardiac care unit. All measurements were performed using a commercially available machine (Vivid 7® GE Medical System, Horten, Norway) with a 3.5-MHz transducer. 2.4. Follow-up and major adverse cardiac events
Major adverse cardiac events (MACE) were defined as in stent thrombosis, non-fatal myocardial infarction and in-hospital mor-tality during in-hospital follow up period. In-stent thrombosis was defined as angiographically documented total occlusion. Non-fatal myocardial infarction was defined as recurrent chest pain and/or development of new ECG changes accompanied by a new rise ≥20% of cardiac biomarkers measured after the recurrent event. In-hospital mortality had to be verified death due to myocardial infarction, cardiac arrest or other cardiac causes.
2.5. Statistical analysis
Continuous variables were tested for normal distribution by the Kolmogorov–Smirnov test. We report continuous data as mean and standard deviation or median. We compared continuous variables using Student t-test between groups. Categorical variables were summarized as percentages and compared with the Chi-square test. Pearson correlation coefficients examined the degree of asso-ciation between examined variables. p value <0.05 was considered as significant. The Receiver Operating Characteristics (ROC) curve was used to demonstrate the sensitivity and specificity of Uric acid, MPV, hs-CRP and their respective, optimal cut-off value for predict-ing poor coronary flow after primary PCI in patients with STEMI. The effects of different variables on No-reflow and in hospital MACE were calculated in univariate analysis for each. The variables for which the unadjusted p value was <0.10 in logistic regression anal-ysis were identified as potential risk markers and included in the full model. We reduced the model by using backward elimination multivariate logistic regression analyses and we eliminated poten-tial risk markers by using likelihood ratio tests. p value <0.05 was considered as significant and confidence interval (CI) was 95%. All statistical analyses were performed with the SPSS version 15 (SPSS, Inc., Chicago, Illinois).
3. Results
There were 126 patients (mean age 63± 11 and 71% male) in group 1 and 163 patients (mean age 58± 12 and 80% male) in group 2. Baseline characteristics are shown inTable 1. Mean age was sig-nificantly higher in group1 (p = 0.0001). With respect to coronary risk factors; there was significant difference in the presence of dia-betes mellitus (DM) (p = 0.0001) and prior coronary artery disease (p = 0.0001) but there was no significant difference in hypertension and active smoking (p = 0.169 and p = 0.254, respectively).
With respect to baseline laboratory status, the serum glucose level on admission was significantly higher in group 1 (p = 0.0001), while there was no significant difference in serum lipid profile, glomerular filtration rate (GFR), hemoglobin (Hg), platelet and white blood cell count (WBC) between groups. Also, left ven-tricular ejection fraction (LVEF) and pain to balloon time were not significantly different between groups (p = 0.112 and p = 0.429, respectively).
A greater proportion of patients with multi-vessel disease (more than 50% occlusion for each coronary artery) were in group 1 (p = 0.0001). Left anterior descending artery is the more common infarct related artery (IRA) in both groups, but there is no sig-nificant difference in involvement of circumflex, right coronary artery, left anterior descending artery and saphenous graft or left internal mammarian artery as IRA between groups (p = 0.381,
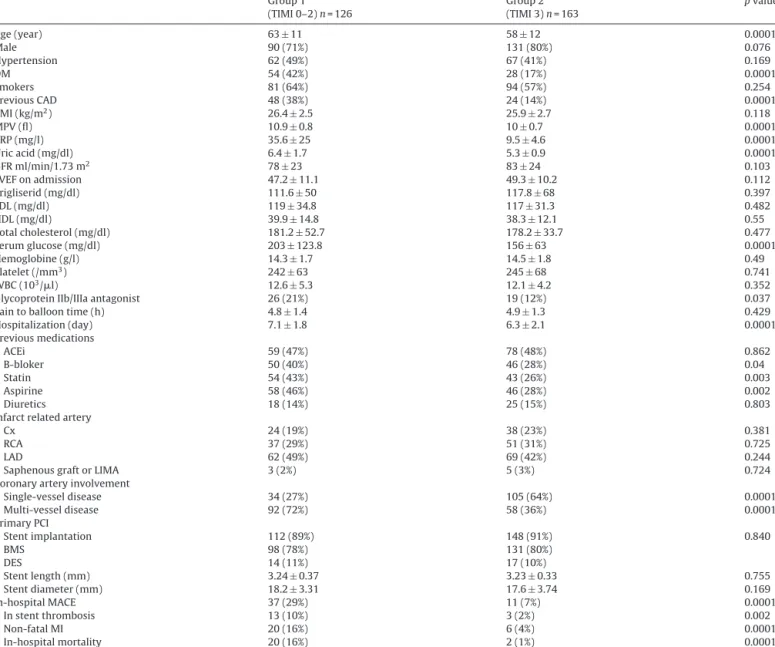
Table 1 Baseline characteristics. Group 1 (TIMI 0–2) n = 126 Group 2 (TIMI 3) n = 163 p value Age (year) 63± 11 58± 12 0.0001 Male 90 (71%) 131 (80%) 0.076 Hypertension 62 (49%) 67 (41%) 0.169 DM 54 (42%) 28 (17%) 0.0001 Smokers 81 (64%) 94 (57%) 0.254 Previous CAD 48 (38%) 24 (14%) 0.0001 BMI (kg/m2) 26.4± 2.5 25.9± 2.7 0.118 MPV (fl) 10.9± 0.8 10± 0.7 0.0001 CRP (mg/l) 35.6± 25 9.5± 4.6 0.0001 Uric acid (mg/dl) 6.4± 1.7 5.3± 0.9 0.0001 GFR ml/min/1.73 m2 78± 23 83± 24 0.103 LVEF on admission 47.2± 11.1 49.3± 10.2 0.112 Trigliserid (mg/dl) 111.6± 50 117.8± 68 0.397 LDL (mg/dl) 119± 34.8 117± 31.3 0.482 HDL (mg/dl) 39.9± 14.8 38.3± 12.1 0.55 Total cholesterol (mg/dl) 181.2± 52.7 178.2± 33.7 0.477 Serum glucose (mg/dl) 203± 123.8 156± 63 0.0001 Hemoglobine (g/l) 14.3± 1.7 14.5± 1.8 0.49 Platelet (/mm3) 242± 63 245± 68 0.741 WBC (103/l) 12.6± 5.3 12.1± 4.2 0.352
Glycoprotein IIb/IIIa antagonist 26 (21%) 19 (12%) 0.037
Pain to balloon time (h) 4.8± 1.4 4.9± 1.3 0.429
Hospitalization (day) 7.1± 1.8 6.3± 2.1 0.0001 Previous medications ACEi 59 (47%) 78 (48%) 0.862 B-bloker 50 (40%) 46 (28%) 0.04 Statin 54 (43%) 43 (26%) 0.003 Aspirine 58 (46%) 46 (28%) 0.002 Diuretics 18 (14%) 25 (15%) 0.803
Infarct related artery
Cx 24 (19%) 38 (23%) 0.381
RCA 37 (29%) 51 (31%) 0.725
LAD 62 (49%) 69 (42%) 0.244
Saphenous graft or LIMA 3 (2%) 5 (3%) 0.724
Coronary artery involvement
Single-vessel disease 34 (27%) 105 (64%) 0.0001 Multi-vessel disease 92 (72%) 58 (36%) 0.0001 Primary PCI Stent implantation 112 (89%) 148 (91%) 0.840 BMS 98 (78%) 131 (80%) DES 14 (11%) 17 (10%) Stent length (mm) 3.24± 0.37 3.23± 0.33 0.755 Stent diameter (mm) 18.2± 3.31 17.6± 3.74 0.169 In-hospital MACE 37 (29%) 11 (7%) 0.0001 In stent thrombosis 13 (10%) 3 (2%) 0.002 Non-fatal MI 20 (16%) 6 (4%) 0.0001 In-hospital mortality 20 (16%) 2 (1%) 0.0001
Data are expressed as mean± standard deviation for normally distributed data and percentage (%) for categorical variables. DM: diabetes mellitus, CAD: coronary arterial disease, MPV: mean platelet volume, CRP: C-reactive protein, GFR: glomerular filtration rate, LVEF: left ventricular ejection fraction, LDL: low density lypoprotein, HDL: high density lypoprotein, WBC: white blood cell, BMI: Body mass index, ACEi: angiotensin converting enzyme inhibitors, LAD: left anterior descending, CX: circumflex artery, RCA: right coronary artery, LIMA: left internal mammarian artery, PCI: percutaneous coronary intervention, BMS: bare metal stent, DES: drug eluting stent, MACE: major advanced cardiovasculary events, MI: myocardial infarction.
p = 0.725, p = 0.244 and p = 0.724, respectively). In the PCI procedure, stent implantation percentage and used stent types were similar between groups (p = 0.840). Also, there was no significantly dif-ference in the stent length (3.24± 0.37 vs. 3.23 ± 0.33, p = 0.755) and stent diameter (18.2± 3.31 vs. 17.6 ± 3.74, p = 0.169) between groups.
In previous medication history of patients, b-blocker, statin group drugs and aspirine usage significantly higher in group 1 (p = 0.04, p = 0.003 and p = 0.002 respectively). But there was no significant difference in angiotensin converting enzyme inhibitors (ACEi) and diuretic drugs usage between groups (p = 0.863 and p = 0.803, respectively).
In-stent thrombosis, non-fatal MI, and in-hospital mortality were significantly higher in group 1 (p = 0.002, p = 0.0001, and p = 0.0001, respectively). Over all, in-hospital MACE was also sig-nificantly higher in group 1 (29% vs. 7%, p = 0.0001).
Uric acid, MPV, and hs-CRP levels on admission were higher in group 1 when compared with group 2 (p = 0.0001 for each). There was a significant correlation between each of these three parame-ters with each other (Fig. 1): hs-CRP and MPV levels were correlated (Fig. 1A) (r = 0.61; p = 0.0001), and uric acid was correlated with both MPV and hs-CRP levels (Fig. 1B and C) (r = 0.56; p = 0.0001 and r = 0.49; p = 0.0001, respectively).
The ROC curves of uric acid, hs-CRP, and MPV for predicting no-reflow are shown inFig. 2. A uric acid level≥5.4 mg/dl measured on admission had a 77% sensitivity and 70% specificity in predicting no-reflow. Hs-CRP level≥5.4 mg/l predicted no-reflow with an 89% sensitivity and 80% specificity and MPV level≥10.4 fl predicted no-reflow with a 75% sensitivity and 73% specificity.
When we divided the study population into two groups accord-ing to the 5.4 mg/dl uric acid level cut-off value used in the ROC analysis, multi-vessel disease and no-reflow phenomena were
Fig. 1. Correlation between hs-CRP and MPV levels (A), MPV and uric acid levels (B), hs-CRP and uric acid levels (C).
significantly higher in increased uric acid group (p = 0.0001). In-hospital MACE was significantly higher in increased uric acid group (p = 0.001) (Table 2). Age and sex were not significantly different between groups (p = 0.09 and p = 0.46 for male sex, respectively). With respect to coronary risk factors, only previous coronary artery disease history was significantly higher in increased uric acid group (p = 0.009).
In the groups; some of variables that can be effective on impaired flow after primary PCI and in hospital MACE were significantly dif-ferent between groups. So, the effects of multiple variables on the TIMI grade score analyzed with univariate and multivariate logistic regression analyses (Table 3). The variables for which the unad-justed p value was <0.10 in univariate analysis were identified as potential risk markers for no-reflow and included in the full model.
Table 2
Baseline risk factors and in-hospital MACE stratified by uric acid levels.
Uric acid <5.4 n = 141 Uric acid≥5.4 n = 148 p value
Age (year) 59± 12 61± 12 0.09
Male 107 (76%) 114 (77%) 0.46
Coronary risk factors
DM 37 (26%) 45 (30%) 0.26
Hypertension 63 (45%) 66 (45%) 0.54
Smokers 85 (60%) 90 (61%) 0.51
Previous CAD 26 (18%) 46 (31%) 0.009
Severity of coronary artery disease
Single-vessel disease 84 (60%) 55 (37%) 0.0001 Multi-vessel disease 57 (40%) 93 (63%) 0.0001 In hospital MACE 9 (6%) 39 (26%) 0.0001 In stent thrombosis 4 (3%) 12 (8%) 0.05 Non-fatal MI 5 (3%) 21 (14%) 0.002 In-hospital mortality 3 (2%) 19 (13%) 0.001 No-reflow 28 (20%) 98 (66%) 0.0001
Data are expressed as percentage (%) for categorical variables and mean± standard deviation. DM: diabetes mellitus, CAD: coronary artery disease, MACE: major advanced cardiovasculary events, MI: myocardial infarction.
Fig. 2. The receiver-operating characteristic (ROC) curve of uric acid (A), MPV (B) and hs-CRP (C) for predicting angiographic no-reflow.
Table 3
Effects of multiple variables on the no-reflow in univariate and multivariate logistic regression analyses.
Variables Unadjusted OR 95% CI p value Adjusted ORa 95% CI p value
Age 1.04 1.02–1.06 0.0006 1.03 0.99–1.06 0.1615 MPV 4.69 3.17–6.95 <0.0001 3.09 1.95–4.89 <0.0001 CRP 1.04 1.03–1.06 <0.0001 1.02 1.01–1.03 0.0007 Uric acid 1.94 1.55–2.43 <0.0001 2.05 1.49–2.81 <0.0001 Aspirine 2.23 1.36–3.65 0.0015 0.19 0.05–0.67 0.0102 B-blocker 2.72 1.66–4.46 0.0001 0.61 0.18–2.10 0.4295 Male 0.62 0.36–1.08 0.0886 0.62 0.28–1.37 0.233 Hypertension 1.43 0.89–2.30 0.1376 Diabetes mellitus 3.69 2.14–6.35 <0.0001 6.70 2.31–19.50 0.0005 Smoking 1.36 0.84–2.22 0.2125 Previous CAD 3.73 2.11–6.58 <0.0001 11.11 2.25–54.99 0.0032 Glucose on admission 1.01 1–1.01 0.0002 1.00 0.99–1.01 0.4354 CK-mb 1.01 1–1.01 0.0057 1.01 0.99–1.01 0.0722 GFR ml/min/1.73 m2 0.96 0.84–1.10 0.5691 Multivessel disease 4.98 2.97–8.34 <0.0001 2.99 1.43–6.26 0.0037
aAdjusted for age, MPV, CRP, uric acid, b blocker, aspirine, DM, previous CAD, glucose on admission, multivessel disease, sexual status and Ck-mb. OR: odds ratio, CI: confidence interval, MPV: mean platelet volume, CRP: C-reactive protein, CAD: coronary artery disease, LVEF: left ventricular ejection fraction, GFR: glomerular filtration rate
Table 4
Effects of various variables on in-hospital MACE in univariate and multivariate logistic regression analyses.
Variables Unadjusted OR 95% CI p value Adjusted ORa 95% CI p value
Age 1.04 1.01–1.07 0.004 1.00 0.96–1.04 0.987 MPV 2.09 1.44–3.03 0.0001 1.43 0.89–2.29 0.138 CRP 1.01 1.01–1.02 0.0004 1.01 1–1.02 0.006 Uric acid 2.89 2.07–4.03 <0.0001 2.75 1.93–3.94 <0.0001 Aspirine 1.38 0.70–2.71 0.356 B-blocker 1.24 0.63–2.44 0.534 Male 2.87 1.43–5.77 0.003 0.34 0.13–0.87 0.025 Hypertension 1.44 0.74–2.82 0.283 Diabetes mellitus 1.63 0.81–3.28 0.171 Smoking 2.09 1.06–4.09 0.033 0.56 0.23–1.35 0.195 Previous CAD 1.55 0.75–3.20 0.235 Glucose on admission 1.01 1–1.01 <0.0001 1.01 1–1.01 0.007 CK-mb 1.00 0.99–1.01 0.182 GFR ml/min/1.73 m2 1.01 0.91–1.13 0.800 Multivessel disease 0.53 0.27–1.07 0.077 1.09 0.43–2.79 0.858
Glycoprotein IIb/IIIa antagonist 2.39 1.10–5.25 0.028 1.96 0.69–5.52 0.204
aAdjusted for age, MPV, CRP, uric acid, sexual status, smoking, glucose on admission, multivessel disease. OR: odds ratio. CI: confidence interval. MPV: mean platelet volume. CRP: C-reactive protein. CAD: coronary artery disease. LVEF: left ventricular ejection fraction. GFR: glomerular filtration rate
Age, MPV, hs-CRP, uric acid, b-blocker, aspirine, DM, previous CAD, glucose on admission, multivessel disease, sexual status (male) and ck-mb were analyzed with multivariate logistic regression model. At multivariate analyses, high plasma uric acid (odds ratio (OR) 2.05, <95% confidence interval (CI) 1.49–2.81; p < 0.0001), hs-CRP (OR 1.02, <95% CI 1.01–1.03; p = 0.0007) and MPV (OR 3.09, <95% CI 1.95–4.89; p < 0.0001) levels were still independent predictors of no-reflow post primary PCI (Table 3). In the multivariate analy-ses for in-hospital MACE, age, MPV, hs-CRP, uric acid, sexual status (male), smoking, glucose on admission, multivessel disease and the use of glycoprotein IIb/IIIa antagonist were analyzed with multi-variate logistic regression model. High plasma uric acid (OR 2.75, <95% CI 1.93–3.94; p < 0.0001), hs-CRP (OR 1.01, <95% CI 1–1.02; p = 0.006) levels were still independent predictors of in-hospital MACE (Table 4). But, the statistically significance of MPV level (OR 1.43, <95% CI 0.89–2.29; p = 0.138) for prediction to in-hospital MACE disappeared in the multivariate analyses (Table 4).
4. Discussion
This study includes three major findings in patients with STEMI. There is a significant relationship between serum uric acid levels and post primary PCI myocardial perfusion grade. Baseline serum uric acid, MPV and hs-CRP are specific and sensitive predictors of poor coronary blood flow after primary PCI in STEMI. Additionally, these parameters are correlated with each other.
Although the pathophysiology of no-reflow has not been fully elucidated, its etiology appears to be multi-factorial. These factors include ischemic endothelial damage, microvascular leuko-cytes and platelet plugging, reactive oxygen species and complex interactions between leukocytes and platelets induced by the inflammatory process[22]. It is known that angiographic no-reflow is strongly correlated with short and long-term morbidity and mor-tality in acute myocardial infarction[5]. There is also a relationship between the recovery of left ventricular function after an acute myocardial infarction and the no-reflow phenomenon, as well[23]. With the growing understanding of the role of inflammation in the atherosclerotic process, studies have focused on hs-CRP as a marker of risk[24]. Hs-CRP is an acute phase reactant and marker of inflammation with a half-life of 19 h and it is released 6 h after a coronary event, on average[25]. Elevation of hs-CRP has been demonstrated in acute coronary syndromes and it has been shown to be associated with cardiac events[7]. Several studies demon-strated a significant correlation between the vascular occlusion score and baseline hs-CRP levels[8–10]. Inflammation has also been implicated in the development of the no-reflow phenomenon. But,
there are some controversial reports about relationship between hs-CRP and post PCI coronary flow in patients with STEMI. Celik et al.[9]reported that admission high hs-CRP level in patients with only acute anterior MI undergoing primary PCI is likely to be in the causal pathway leading to the development of poor myocar-dial perfusion. Tomoda et al.[8]reported that CRP levels within 6 h after the onset of acute myocardial infarction reflect the vul-nerability of culprit coronary lesions and predict adverse coronary events after primary PCI. However, Niccoli et al. [21] inversely reported that there is not a significant role of systemic inflamma-tory status (groups were divided due to CRP levels >5.4 or below) as a main determinant of no-reflow in acute myocardial infarc-tion (AMI) patients treated by primary or rescue PCI within 6 h of symptom onset. These studies have relatively small population. However, in our study we demonstrate that hs-CRP level≥5.4 mg/l predicts the no-reflow with an 89% sensitivity and 80% specificity and hs-CRP level is a significant, independent predictor of no-reflow and in hospital MACE.
Platelets play a pivotal role in acute coronary syndromes[26,27]. It has been showed that a higher MPV is correlated with greater platelet activation[28]. Larger platelets are more aggregable and are components of both platelet–leukocyte and platelet–platelet plugging in the IRA which may lead to no-reflow following PCI[5]. Previous studies have suggested that MPV could be a marker of the success of coronary reperfusion in STEMI patients[5,6,28]. Huczek et al.[5]found that, MPV levels are an independent predictor of the no-reflow phenomenon after primary PCI. Estévez-Loureiro et al. [28]demonstrated that MPV is associated with IRA patency and 30-day clinical outcomes in patients with STEMI. The present study confirms these findings and extends them to demonstrate that MPV is associated with no-reflow after primary PCI in patients with STEMI and with MPV levels≥10.4 fl predicting no-reflow with 75% sensitivity and 73% specificity. However, Pereg et al.[6]reported that, 30% of patients in low MPV group had failed reperfusion after thrombolytic therapy. Therefore, MPV levels cannot be a single pre-dictor for outcomes of reperfusion in patients with STEMI. But it may be stronger for prediction when used in combination more than one parameter together. So, we evaluated these three param-eters together and found significant relationship with TIMI flow grade. Also, these parameters were correlated with each other.
Uric acid is an end product of xanthine oxidase enzyme activ-ity[29]. Thus, the serum uric acid level is a marker of xanthine oxidase enzyme activity. During production of uric acid and the activity of xanthine oxidase enzyme, oxygen free radicals are gen-erated[30]. The generation of oxygen free radicals are another underlying mechanism in the no-reflow phenomena[31]. Synthesis
and secretion of vasodilators and vasoconstrictors regulate blood flow[32]. In particular, endothelial derived nitric oxide with its potent vasodilator effect plays an important role in the regulation of coronary blood flow[33]. Hyperuricemia has been associated with decreased production of nitric oxide in the vascular endothelial cells[34,35]. So, in the elevated levels of uric acid may be implicated in both endothelial dysfunction and oxygen free radical genera-tion. Previous studies have demonstrated a relationship between serum uric acid level and coronary arterial disease[36–38]. Bickel et al.[36]demonstrated that serum uric acid is an independent predictor of mortality in patients with coronary artery disease. Bos et al.[37]have also reported that elevated serum uric acid levels are associated with an increased risk for ischemic heart disease or myocardial infarction. Lazzeri et al.[38] reported that serum uric acid has a prognostic value about in-hospital mortality in the acute phase of STEMI patients, however, there is no difference in TIMI flow grade pre/post PCI in the patients with low and high uric acid level. Inversely, the present study demonstrated that uric acid level≥5.4 mg/dl predicts no-reflow with 77% sensitivity and 70% specificity. Additionally, elevated uric acid levels were also a strong and independent predictor of no-reflow and in-hospital MACE in patients with STEMI undergoing primary PCI.
In this study, patients groups did not differ in respect to LVEF and in pain to balloon time. Some studies that assessing the recov-ery of LVEF after primary PCI indicate that the improvement of ejection fraction does not recover immediately after reperfusion. In a previous study[39], the improvement of LVEF in the reper-fused myocardium is modest after 3 days and significant recovery occurs over the first month. In this study, TTE was performed immediately after primary PCI in coronary care unit. It is possi-ble that stunned myocardial regions caused to reduce the ejection fraction in both groups. However, if we would to evaluate the sys-tolic functions at the end of the hospitalization or several months later, LVEF could be significantly higher in reflow group. In addi-tion, we detected no difference in pain to balloon time between groups. Several recent studies in patients with AMI treated with primary angioplasty demonstrated that especially in the first 6 h, the influence of time-to-treatment interval on the reperfusion suc-cess, myocardial salvage and clinical outcomes in patients with AMI depends on the type of reperfusion therapy[40–42]. In the first 6 h from the symptom onset, patients who treated with throm-bolytic therapy, these outcomes increase with the prolongation of time to treatment interval. However, patients treated with primary PCI, these outcomes remained stable and independent from the time-to-treatment interval. However in our study, only patients who admitted within 6 h from symptom onset were enrolled and there is no difference in pain to balloon time between groups. We commented that this is an advantage for homogenization of groups. 4.1. Limitations
Possible limitations of the present study are a single center expe-rience and may be represented by the small number of patients. However, our population contain homogeneous unselected STEMI patients submitted to primary PCI within 6 h from symptoms’ onset, therefore mirroring the real world scenario.
5. Conclusion
Hs-CRP, MPV and uric acid levels on admission are strong and independent predictors of poor coronary blood flow following primary PCI. Hs-CRP and uric acid levels are also independent pre-dictors of in-hospital MACE among patients with STEMI. Uric acid levels may be a simple, routinely assessed biomarker for risk strat-ification among STEMI patients. Apart from predictive value, uric
acid levels may be a useful biomarker for stratification of risk in patients with STEMI and may also lead to carry further therapeu-tic implications. Although the clinical significance in the way the patients are treated after developing a STEMI, the association of uric acid levels and primary PCI outcome are still relevant and possibly further studies are needed in order to know if treatment of hyper-uricemia prevents no-reflow in patient with STEMI and increased uric acid levels.
Conflict of interest
The authors have no conflicts of interest to disclose. References
[1] The GUSTO Angiographic Investigators. The effects of tissue plasminogen activator, streptokinase, or both on coronary–artery patency, ventricular function, and survival after acute myocardial infarction. N Engl J Med 1993;329(November (22)):1615–22.
[2] Kaya MG, Arslan F, Abaci A, van der Heijden G, Timurkaynak T, Cengel A. Myocardial blush grade: a predictor for major adverse cardiac events after primary PTCA with stent implantation for acute myocardial infarction. Acta Cardiol 2007;62(October (5)):445–51.
[3] Ito H, Maruyama A, Iwakura K, et al. Clinical implications of the ‘no reflow’ phenomenon. A predictor of complications and left ventricular remodeling in reperfused anterior wall myocardial infarction. Circulation 1996;93(January (2)):223–8.
[4] Yarlioglues M, Kaya MG, Ardic I, et al. Relationship Between Mean Platelet Volume Levels and Subclinical Target Organ Damage in Newly Diagnosed Hypertensive Patients. Blood Press; November 24, 2010.
[5] Huczek Z, Kochman J, Filipiak KJ, et al. Mean platelet volume on admission predicts impaired reperfusion and long-term mortality in acute myocardial infarction treated with primary percutaneous coronary intervention. J Am Coll Cardiol 2005;46(July (2)):284–90.
[6] Pereg D, Berlin T, Mosseri M. Mean platelet volume on admission correlates with impaired response to thrombolysis in patients with ST-elevation myocar-dial infarction. Platelets 2010;21(2):117–21.
[7] Magadle R, Hertz I, Merlon H, Weiner P, Mohammedi I, Robert D. The relation between preprocedural C-reactive protein levels and early and late complica-tions in patients with acute myocardial infarction undergoing interventional coronary angioplasty. Clin Cardiol 2004;27(March (3)):163–8.
[8] Tomoda H, Aoki N. Prognostic value of C-reactive protein levels within six hours after the onset of acute myocardial infarction. Am Heart J 2000;140(August (2)):324–8.
[9] Celik T, Iyisoy A, Kursaklioglu H, et al. The impact of admission C-reactive pro-tein levels on the development of poor myocardial perfusion after primary percutaneous intervention in patients with acute myocardial infarction. Coron Artery Dis 2005;16(August (5)):293–9.
[10] Hong YJ, Jeong MH, Choi YH, et al. Predictors of no-reflow after percutaneous coronary intervention for culprit lesion with plaque rupture in infarct-related artery in patients with acute myocardial infarction. J Cardiol 2009;54(August (1)):36–44.
[11] Many A, Hubel CA, Roberts JM. Hyperuricemia and xanthine oxidase in preeclampsia, revisited. Am J Obstet Gynecol 1996;174(January (1 Pt 1)):288–91.
[12] Kato M, Hisatome I, Tomikura Y, et al. Status of endothelial dependent vasodilation in patients with hyperuricemia. Am J Cardiol 2005;96(December (11)):1576–8.
[13] Erdogan D, Gullu H, Caliskan M, et al. Relationship of serum uric acid to mea-sures of endothelial function and atherosclerosis in healthy adults. Int J Clin Pract 2005;59(November (11)):1276–82.
[14] Erdogan D, Gullu H, Caliskan M, et al. Coronary flow reserve and coronary microvascular functions are strongly related to serum uric acid concentrations in healthy adults. Coron Artery Dis 2006;17(February (1)):7–14.
[15] Yildiz A, Yilmaz R, Demirbag R, Gur M, Bas MM, Erel O. Association of serum uric acid level and coronary blood flow. Coron Artery Dis 2007;18(December (8)):607–13.
[16] Freedman DS, Williamson DF, Gunter EW, Byers T. Relation of serum uric acid to mortality and ischemic heart disease. The NHANES I Epidemiologic Follow-up Study. Am J Epidemiol 1995;141(April (7)):637–44.
[17] Culleton BF, Larson MG, Kannel WB, Levy D. Serum uric acid and risk for car-diovascular disease and death: the Framingham Heart Study. Ann Intern Med 1999;131(July (1)):7–13.
[18] TIMI Study Group. The Thrombolysis in Myocardial Infarction (TIMI) trial. Phase I findings. N Engl J Med 1985;312(April (14)):932–6.
[19] Rezkalla SH, Dharmashankar KC, Abdalrahman IB, Kloner RA. No-reflow phe-nomenon following percutaneous coronary intervention for acute myocardial infarction: incidence, outcome, and effect of pharmacologic therapy. J Interv Cardiol 2010;23(October (5)):429–36.
[20] Niccoli G, Marino M, Spaziani C, Crea F. Prevention and treatment of no-reflow. Acute Card Care 2010;12(September (3)):81–91.
[21] Niccoli G, Lanza GA, Spaziani C, et al. Baseline systemic inflammatory status and no-reflow phenomenon after percutaneous coronary angioplasty for acute myocardial infarction. Int J Cardiol 2007;117(May (3)):306–11.
[22] Rezkalla SH, Kloner RA. No-reflow phenomenon. Circulation 2002;105(February (5)):656–62.
[23] Topsakal R, Kaya MG, Karakaya E, et al. Relationship between no-reflow phenomenon and serotonin levels in patients with acute ST-elevation myocar-dial infarction who underwent primary percutaneous intervention. Anadolu Kardiyol Derg 2010;10(June (3)):253–9.
[24] Libby P, Ridker PM, Maseri A. Inflammation and atherosclerosis. Circulation 2002;105(March (9)):1135–43.
[25] Kaya MG, Yarlioglues M, Gunebakmaz O, et al. Platelet activation and inflam-matory response in patients with non-dipper hypertension. Atherosclerosis 2010;209(March (1)):278–82.
[26] Cameron HA, Phillips R, Ibbotson RM, Carson PH. Platelet size in myocardial infarction. Br Med J (Clin Res Ed) 1983;287(August (6390)):449–51. [27] Van der Loo B, Martin JF. A role for changes in platelet production in the cause
of acute coronary syndromes. Arterioscler Thromb Vasc Biol 1999;19(March (3)):672–9.
[28] Estévez-Loureiro R, Salgado-Fernández J, Marzoa-Rivas R, et al. Mean platelet volume predicts patency of the infarct-related artery before mechanical reperfusion and short-term mortality in patients with ST-segment elevation myocardial infarction undergoing primary percutaneous coronary interven-tion. Thromb Res 2009;124(November (5)):536–40.
[29] Caymaz O. Chronic heart failure and uric acid. Türk J Cardiol 2006;9:110–4. [30] Saugstad OD. Role of xanthine oxidase and its inhibitor in hypoxia:
reoxygena-tion injury. Pediatrics 1996;98(July (1)):103–7.
[31] Romano M, Buffoli F, Tomasi L, et al. The no-reflow phenomenon in acute myocardial infarction after primary angioplasty: incidence, predictive fac-tors, and long-term outcomes. J Cardiovasc Med (Hagerstown) 2008;9(January (1)):59–63.
[32] Pohl U, Busse R. Endothelium-dependent modulation of vascular tone and platelet function. Eur Heart J 1990;11(April (Suppl. B)):35–42.
[33] Parent R, Paré R, Lavallée M. Contribution of nitric oxide to dilation of resis-tance coronary vessels in conscious dogs. Am J Physiol 1992;262(January (1 Pt 2)):H10–6.
[34] Khosla UM, Zharikov S, Finch JL, et al. Hyperuricemia induces endothelial dys-function. Kidney Int 2005;67(May (5)):1739–42.
[35] Farquharson CA, Butler R, Hill A, Belch JJ, Struthers AD. Allopurinol improves endothelial dysfunction in chronic heart failure. Circulation 2002;106(Jul (2)):221–6.
[36] Bickel C, Rupprecht HJ, Blankenberg S, et al. Serum uric acid as an independent predictor of mortality in patients with angiographically proven coronary artery disease. Am J Cardiol 2002;89(January (1)):12–7.
[37] Bos MJ, Koudstaal PJ, Hofman A, Witteman JC, Breteler MM. Uric acid is a risk factor for myocardial infarction and stroke: the Rotterdam study. Stroke 2006;37(June (6)):1503–7.
[38] Lazzeri C, Valente S, Chiostri M, Sori A, Bernardo P, Gensini GF. Uric acid in the acute phase of ST elevation myocardial infarction submitted to primary PCI: its prognostic role and relation with inflammatory markers: a single center experience. Int J Cardiol 2010;138(January (2)):206–9.
[39] Schmidt WG, Sheehan FH, von Essen R, Uebis R, Effert S. Evolution of left ventric-ular function after intracoronary thrombolysis for acute myocardial infarction. Am J Cardiol 1989;63(March (9)):497–502.
[40] Aquaro GD, Pingitore A, Strata E, et al. Relation of pain-to-balloon time and myocardial infarct size in patients transferred for primary percutaneous coro-nary intervention. Am J Cardiol 2007;100(July (1)):28–34.
[41] Zijlstra F, Patel A, Jones M, et al. Clinical characteristics and outcome of patients with early (<2 h), intermediate (2–4 h) and late (>4 h) presentation treated by primary coronary angioplasty or thrombolytic therapy for acute myocardial infarction. Eur Heart J 2002;23(April (7)):550–7.
[42] Cannon CP, Gibson CM, Lambrew CT, et al. Relationship of symptom-onset-to-balloon time and door-to-balloon time with mortality in patients undergoing angioplasty for acute myocardial infarction. JAMA 2000;283(June (22)):2941–7.