c
⃝ T¨UB˙ITAK
doi:10.3906/elk-1210-51 h t t p : / / j o u r n a l s . t u b i t a k . g o v . t r / e l e k t r i k /
Research Article
Correlation analysis between surface electromyography and continuous-wave
near-infrared spectroscopy parameters during isometric exercise to volitional
fatigue
¨Omer S¸AYL˙I1,∗, Ata AKIN2, Hasan Birol C¸ OTUK3 1
Department of Biomedical Engineering, Faculty of Technology, Kocaeli University, Kocaeli, Turkey 2Department of Genetics and Bioengineering, Faculty of Engineering, Bilgi University, ˙Istanbul, Turkey
3School of Physical Education and Sports, Marmara University, ˙Istanbul, Turkey
Received: 10.10.2012 • Accepted: 07.12.2012 • Published Online: 21.03.2014 • Printed: 18.04.2014
Abstract: In this study, the process of muscular fatigue was examined using surface electromyography (sEMG) and continuous-wave near-infrared spectroscopy (cw-NIRS) simultaneously during an isometric hand grip exercise at 50% and 75% of the maximal voluntary contraction (MVC), sustained until volitional fatigue. The mean frequency of the sEMG decreased during the whole exercise, whereas the root mean square had a tendency to increase. Oxy-hemoglobin/deoxyhemoglobin concentration changes computed with cw-NIRS were found to exhibit a fast linear de-crease/increase in the first 10–20 s of the exercise, the so-called fast phase, followed by a plateau-like slow phase. The change rates were higher at 75% MVC for both the sEMG and cw-NIRS parameters. Significant correlations were found, especially at 50% MVC, between the sEMG parameters computed for the whole exercise and cw-NIRS parameters com-puted from the early region of the exercise, i.e. infection duration and amplitude changes to the inflection point. The findings emphasize the potential of cw-NIRS for muscle studies.
Key words: Fatigue, oxygenation, near-infrared spectroscopy, surface electromyography, isometric exercise
1. Introduction
A body of research is devoted to the study of fatigue. In broad terms, fatigue may be described as a decrease in performance [1]. It is a complex phenomenon depending on many factors, such as muscle load, work type, duty cycle, timing, and cognitive and emotional factors [2]. The responsible factors range from the macro system level and central fatigue to factors at the cellular level. Cardiovascular performance and respiratory dynamics are among the macro system level factors. A deficiency in oxygen and energy source supplies, increase in metabolic byproducts, change in ion balances around the sarcolemma, decrease in the pH and adenosine triphosphate production rate, and impairments in Ca++ release from the sarcoplasmic reticulum are some of
the leading factors at the cellular level. Since isolating a single step in this process chain is very challenging [3], investigations were undertaken for the identification and determination of the most dominant factor(s) for the cause of fatigue. Yet another challenge is the dependence of all of these factors on different exercise tasks and conditions, as well as the physiological state of the subject. Hence, a deeper investigation of fatigue is required for a better understanding of the basic physiology, developing exercise, and training programs in sports, leading
to a higher performance, more effective rehabilitation programs, and better ergonomics designs for healthier work conditions, as well as improved fitness.
Unfortunately, there are only a few tools available for probing the local muscle physiology dynamics. Surface electromyography (sEMG), recorded with surface electrodes placed on the skin, is one of those methods and is mainly sensitive to the summation of all active motor unit (MU) potentials within the measured volume [4]. Although sEMG is thought to give more global MU activity-related information (central factors), its amplitude and power spectrum properties are also affected by the muscle fiber membrane properties along with physiological changes (local factors) [5].
Another valuable tool, near-infrared spectroscopy (NIRS), is a noninvasive technique utilizing the relative transparency of tissues to light in the near-infrared range between 700 and 1000 nm, called the ‘optical window’, where water has relatively low absorption. Dominant absorption is caused by deoxyhemoglobin (Hb) and oxyhemoglobin (HbO2) in this wavelength range. NIRS has found an increasing usage in muscle as well as
brain studies. In continuous-wave NIRS (cw-NIRS), light of constant intensity is sent through tissue with light sources placed on the skin. The light sources emit light at 2 (minimal number) wavelengths and optic detectors placed a few centimeters away from the light sources collect the light that has scattered from the underlying tissues. Changes in the detected light intensities for the 2 light wavelengths are then used to compute signals proportional to the concentration changes of Hb and HbO2 [6] within the probed volume underneath the source
detector. Light reaching the detector follows a banana-like shape and the depth of this probed volume from the surface is approximately half of the distance between the light source and the detector, illustrated in Figure 1. NIRS measurements give information about Hb and HbO2 concentration changes as a weighted average of
small blood vessels, capillaries with less than 1 mm diameter, and intercellular sites of oxygen uptake, since photons are unlikely to pass through large vessels because of high absorption [7]. NIRS cannot differentiate Hb from myoglobin (Mb) (or HbO2 from MbO2) since the absorption spectra of the deoxygenated and oxygenated
forms of myoglobin are identical to that of hemoglobin. Hence, Hb(O2) refers to the combination of Hb(O2)
and Mb(O2) .
Light source Light detector r
Probed volume ~ r / 2
Skin + Fat Muscle
Figure 1. Illustration of the probed tissue volume for cw-NIRS for the muscle measurements.
The simultaneous use of sEMG and NIRS has been attempted in numerous studies for the goal of obtaining additional information in the process of local muscular fatigue, starting with the works of Alfonsi et al. [8] and Hicks et al. [9]. The study of Alfonsi et al. [8] failed to show the relationship between sEMG parameters and NIRS curves. Hicks et al. [9] also did not find tissue oxygenation changes at 10% maximal voluntary contraction (MVC) isometric contraction; while the median frequency (MDF) of sEMG indicated progressive fatigue development, they observed simultaneous changes at 30% MVC. Praagman et al. [10] found a linear relationship between sEMG activity magnitude and oxygen consumption determined by NIRS for flexion and pro/supination moments of biceps breve and brachioradialis flexion moment, but not for brachioradialis
pro/supination moment. Elcadi et al. [11] also observed good and moderate correlations between oxygen saturation measured with NIRS and the root mean square (RMS) of sEMG for a 20-s isometric contraction and concluded that aerobic demands are negatively correlated to the RMS. Miura et al. [12] computed significant negative correlations between the percentage of oxy-Hb/Mb and integrated EMG for 6 min of dynamic cycling exercise. Moalla et al. [13] also observed a strong correlation between muscle oxygenation and the mean frequency (MNF), and a negative correlation was reported between the RMS and muscle oxygenation for an isometric knee extension at 50% MVC until fatigue in children. Greater changes of oxy- and deoxy-Hb were accompanied by a greater decrease slope of the MNF for 1 min of 50% MVC-sustained isometric contraction in a study by Yamada et al. [14]. A positive relationship was observed between the tissue oxygenation index change and EMG parameters of the MDF and conduction velocity (CV) (all computed for the time range of the fast phase of NIRS) by Felici et al. [15] for 30 s of static and sinusoidal isometric exercises between 20% and 60% MVC.
In this study, we aimed to investigate further the correlations between sEMG and cw-NIRS parameters in detail, with the aim of investigating the relationship between the electrophysiological and local tissue oxygenation parameters, in depth, for isometric exercise. Specifically, relationships between the sEMG parameters and inflection point parameters of cw-NIRS were examined. During this constant-force isometric hand grip protocol, either at 50% and 75% MVC, electromyographic and hemodynamic changes in the flexor digitorum superficialis (FDS) muscle were recorded simultaneously. In contrast to a fixed exercise duration, we preferred an exercise protocol that lasted until volitional fatigue to investigate the correlations between the cw-NIRS parameters computed from an early phase of the exercise and sEMG parameters calculated for the whole exercise until fatigue. A parametric analysis was performed on each signal, and then correlations were sought between the sEMG and cw-NIRS parameters.
2. Methodology 2.1. Subjects
Participants in the study included 16 male rowers and canoe athletes. Five participants were excluded since either they failed to hold force within the allowed margin or they did not participate in both force level tests. Outlier cw-NIRS data from 1 participant were excluded. Descriptive data of the remaining 10 participants were mean age of 22.7 ± 3.3 years, mean height of 1.8 ± 0.1 m, and mean weight of 77.9 ± 9.9 kg. Fat thickness measured on the FDS muscle was 2.1 ± 0.7 mm. Study approval was given by the Bo˘gazi¸ci University Human Studies Ethics Committee.
2.2. Exercise protocol
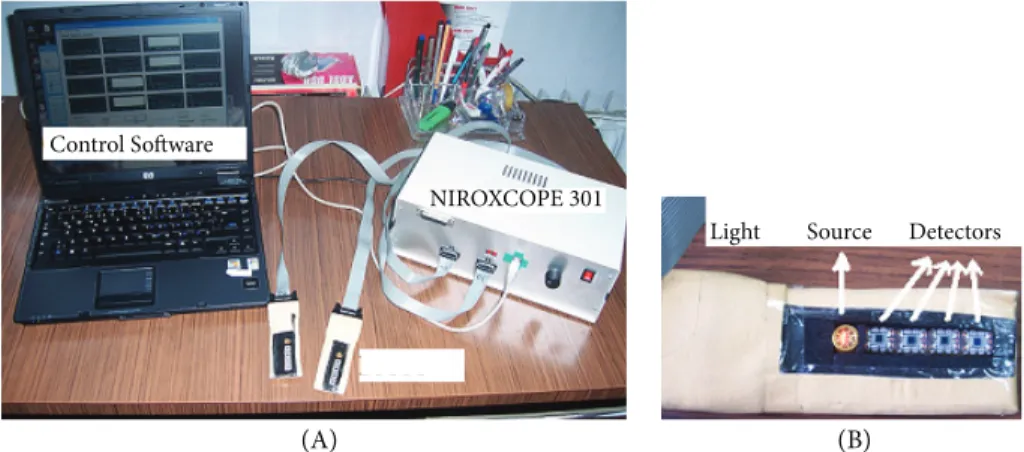
The MVC hand grip force of the dominant right hand was measured initially with a hand grip transducer, the BIOPAC SS25LA hand grip dynamometer with a BIOPAC MP30 data acquisition system. Both NIRS and EMG measurements were taken from the FDS muscle. The muscle was located as outlined by Blackwell et al. [16]. Participants were asked to resist against pulling with their fourth finger while the contracting muscle was palpated. sEMG electrodes and an NIRS probe were placed on top of the muscle belly next to each other, as shown in Figure 2 [17]. Participants were asked to maintain a constant hand grip force at the target level (either 50% or 75% MVC) for as long as possible. The force level was presented on the computer screen in real time. When a participant was no longer able to maintain the target force level within a 5%–10% margin, he was asked to stop the exercise. A resting period of 15–20 min separated the 2 force levels.
(A) (B)
Light Source Detectors NIROXCOPE 301
Control Software
Figure 2. A) cw-NIRS device NIROXCOPE 301. B) Probe containing the light source and detectors.
2.3. NIRS measurement
For a single light absorber in a homogeneous medium, the light attenuation for a single absorber is given by the modified Beer–Lambert law (MBLL) as [18];
OD (λ) = ln (I0/I) = ϵ (λ) L (λ) c + G (λ) . (1) OD( λ) represents the optical density at wavelength λ , I0 is the sent light intensity, I(t) is the detected light
intensity, and ε(λ) is the concentration change of a specific chromophore in the tissue with concentration c .
L(λ) is the mean path length of light between the light source and detector and G(λ) accounts for the geometry
and scattering dependent factors. L(λ) is equal to r.DPF( λ) , where r is the minimal distance between the light source and detector and DPF is called the differential path length factor. The change in the optical density with time is proportional to the concentration change of light-absorbing chromophore and is given by the differential form of the MBLL as:
∆OD (λ) = ϵ (λ) L (λ) ∆c, (2)
assuming L(λ) and G(λ) do not change during measurement. In the biological tissue and in the near-infrared range, where Hb and HbO2 are the main light-absorbing chromophores, the optical density can be written as
(ignoring absorption of other chromophores):
∆OD (λ) = (ϵHb(λ) ∆ [Hb] + ϵHbo2(λ) ∆ [HbO2]) L (λ) . (3)
The concentration changes of Hb and HbO2 for 2 wavelength cw-NIRS systems were found using ∆ OD( λ1)
and ∆ OD( λ2) , with formulas given below:
∆ [Hb] = ϵHbo2(λ2) ∆OD (λ1) L (λ2)− ϵHbo2(λ1) ∆OD (λ2) L (λ1)
L (λ1) L (λ2) (ϵHbo2(λ2) ϵHb(λ1)− ϵHbo2(λ1) ϵHb(λ2)) , (4) ∆ [HbO2] = ϵHb(λ1) ∆OD (λ2) L (λ1)− ϵHb(λ2) ∆OD (λ1) L (λ2) L (λ1) L (λ2) (ϵHbo2(λ2) ϵHb(λ1)− ϵHbo2(λ1) ϵHb(λ2)) . (5)
In these equations, ∆OD(λ) was calculated by logarithmic ratios of the detected light at any time instant to baseline values for 2 wavelengths. In this study, maximum changes obtained at 75% MVC were used to obtain normalized amplitude parameters [19].
A cw-NIRS device (NIROXCOPE 301, Bo˘gazi¸ci University, Institute of Biomedical Engineering, shown in Figure 3) was utilized for the study. The detected light intensity changes of 2 light wavelengths (730 and 850 nm) were converted to signals proportional to the concentration changes of the Hb and HbO2. The source
detector distance was 3.0 cm, which allowed for probing of approximately 1.5 cm in depth from the surface.
(A) (B)
sEMG electrodes
Light detectors and source
Figure 3. A) Photograph of the experiment and B) illustration of the positioning of the sEMG electrodes and cw-NIRS probe on the forearm (reproduced with permission, [17]).
2.4. Feature extraction for NIRS
From the recorded NIRS signal, various parameters were calculated (shown in Figure 4): the inflection point denotes the time point when the initial fast change rate of the NIRS signal decelerates considerably and the inflection duration ( ∆tn) represents the duration from the start of the exercise until the inflection point. The algorithm for the calculation of the inflection point is as follows [20]:
100 150 200 250 -20 -15 -10 -5 0 5 Time [s] ∆tn End of exercise Start of exercise ∆R f slope m ∆ R n
Figure 4. Illustration of the cw-NIRS parameters on a typical ∆ [HbO2] graph.
1. First, a time range of interest was selected manually, i.e. selecting the first minute of the exercise, giving data y[n] having N data points. A division point (‘ s ’) was selected, dividing the selected region into 2 segments, the first segment from the start of the exercise to the selected time index ‘s’ (containing data points y [0], y [1], . . . ., y [ s – 1]) and the second segment from the selected time instant to the end of the exercise (containing y [ s ], y [ s + 1], . . . ., y[N− 1]).
2. Least squares line fittings for the 2 segments were calculated. The slopes of these 2 fitted lines, ‘ m1’ for
the first segment and ‘ m2’ for the second segment, as well as the determination coefficients of these line
fittings ( R2
1 and R22 , respectively), were found.
3. The division point ‘ s ’ was moved from start to end to consider all possible 2 segments in the selected time range. Step 2 was repeated for each division point.
4. The inflection point was found such that:
(a) the first segment’s slope was higher than that of second segment’s, and
(b) the sum of determination coefficients of the least squares line fits were maximum.
The concentration change from the start of the exercise to the inflection point was called ∆Rn, and the maximum concentration change in the exercise was found as ∆Rf (depicted in Figure 4). For each subject, the ∆Rf level obtained at 75% MVC was taken as 100% and it was used to scale corresponding ∆Rn and ∆Rf values obtained at 50% MVC and ∆Rn at 75% MVC. The second subscript indicates the force level whenever used. In the text, a.u. and n.u. stand for arbitrary unit and no unit, respectively.
2.5. Surface EMG
A PowerLab 16/30 ML880/P data acquisition system with ML132 and ML135 amplifiers was used for the sEMG measurements [2 kHz sampling rate, hardware set (10–500 Hz) pass band, adaptive mains filter and notch filter, 5 mV range]. An adaptive mains filter removed the mains frequency and its harmonics with minimal distortion to the signal. The skin surface was shaved, rubbed with sand paper, and cleaned with liquid containing 70% alcohol. The sEMG electrodes were trimmed from neighboring borders to attain a 2.0-cm electrode distance and allow more space for the NIRS probes without losing skin contact. The acquired signals were digitally filtered with a 10-Hz high-pass filter (fourth-order Butterworth filter) and notch filter. The RMS and MNF were computed for nonoverlapping time windows of 0.5 s using the EMGALY sEMG analysis program [17,21]. The computation of the RMS is given below.
RM S = v u u t 1 N N∑−1 i=0 x[n]2, (6)
where x[n] is the n th sample in the window containing N samples. The discrete Fourier transform of a data sequence s[n] with M data points is given by:
X (fk) =
∑M−1 k=0 s[n]e
−j2πkn/M, k = 0, . . . , M− 1, (7)
where j2 = 1, f
s is the sampling frequency, and fk= fs× k/M in Hz. Prior to the calculation of the density functional theory (DFT), window data was initially multiplied using the Hanning function, given below [22]:
w [n] = 0.5 ( 1− cos ( 2πn L )) 0≤ n ≤ L. (8)
In our implementation, L was equal to N + 1. The first and last points of w [ n ] (which are zero) were deleted. Windows sEMG data were multiplied first by this function and then 0 was padded to 4096 points for calculation of the DFT using the fast Fourier transform (FFT) algorithm. The power spectrum was calculated with a periodogram estimator, given by the following formula:
P (fk) = 1
H |X(fk)| 2
, (9)
where H is the FFT length, 4096. MNF was calculated for each data window using the following equation over the range of k : M N F = ∑ fkP (fk) ∑ P (fk) . (10)
The slopes of the least squares line fittings and percentage changes of the fitted lines for the mentioned parameters were calculated. The MNF percentage changes and decline slopes are given in magnitude in the results.
2.6. Data processing and statistics
Parameter values were given as µ (mean) ± σ (standard deviation). Differences between the 2 test levels were tested with a paired t-test (significance level was 0.05). Pearson correlation coefficients were computed to find correlations between the parameters.
3. Results
The exercise durations were 82.7 ± 21.9 s (range: 52–121 s) at 50% MVC and 37.3 ± 4.9 s (range: 30.5–45.0 s) at 75% MVC (significantly shorter, P < 0.0001). An example of the simultaneous sEMG and cw-NIRS recording at 50% MVC is shown in Figure 5.
100 150 200 250 300 -20 -10 0 10 20 Time [s] ∆Hb ∆HbO2 100 150 200 0 50 100 Hz Time [s] 100 150 200 0 1 mV MNF RMS Exercise Rest
Figure 5. Sample Hb/HbO2 changes and MNF and RMS at 50% MVC.
3.1. cw-NIRS results
Following the start of the exercise, ∆ [HbO2] and ∆ [Hb] changed in opposite directions quasi-linearly at high
rates. This region is called the fast phase. In a short amount of time (i.e. typically up to 16 s), ∆ [Hb] and ∆ [HbO2] reached a plateau, the so-called ‘slow phase’. ∆ [Hb] had more plateau patterns compared to
∆ [HbO2] across the participants. In some participants, a high magnitude increase in ∆ [HbO2] was observed
Statistics of the cw-NIRS parameters are given in Table 1. When 1 participant’s outlier data at 50% MVC (28.0 s for Hb, 35.6 s for HbO2) was excluded, the inflection durations were calculated as 11.8 ± 2.9 s
for ∆ [Hb] and 11.2 ± 2.8 s for ∆[HbO2]. A 75% MVC exhibited statistically lower inflection durations and
higher slopes. An interesting point to note is that the mean ∆Rn was similar between the 2 exercise levels (about 70%) for both Hb and HbO2. Moreover, the mean level for ∆Rf at 50% MVC was above 90% (i.e. close to the ∆Rf obtained at 75% MVC) for both Hb and HbO2.
Table 1. Statistics of the NIRS parameters (bold font indicates statistically different value).
∆[Hb] ∆[HbO2]
∆ Rf (%) ∆ tn(s) ∆ Rn (%) m(%/s) ∆ Rf (%) ∆ tn (s) ∆ Rn (%) m(%/s)
MVC 50% 101.7 ± 19.9 13.4 ± 5.8 66.8 ± 20.6 7.4 ± 3.0 91.0 ± 26.0 13.7 ± 8.1 65.6 ± 27.7 6.9 ± 4.1 75% - 8.8± 1.9 71.0 ± 16.3 10.9± 3.2 - 8.9± 1.9 74.5 ± 11.5 10.7± 2.4
3.2. EMG results
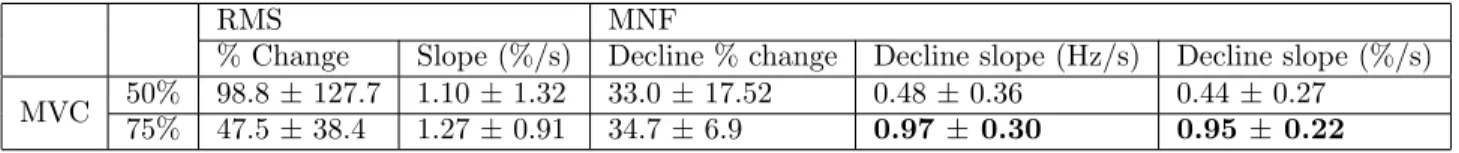
Statistics of the sEMG parameters are given in Table 2. RMS changes were positive (except in 3 cases for all of the measurements), while the MNF values were all decreased. The RMS changes had a very large variation in magnitude. The mean percentage changes of the MNF were close to each other for 50% and 75% MVC, while the exercise duration of 75% MVC was much shorter. Hence, the slopes had significantly higher magnitudes for 75% MVC.
Table 2. Statistics of the sEMG parameters (bold font indicates statistically different mean).
RMS MNF
% Change Slope (%/s) Decline % change Decline slope (Hz/s) Decline slope (%/s) MVC 50% 98.8± 127.7 1.10 ± 1.32 33.0± 17.52 0.48± 0.36 0.44± 0.27
75% 47.5± 38.4 1.27± 0.91 34.7± 6.9 0.97± 0.30 0.95 ± 0.22
3.3. Correlations
Correlations between the sEMG and cw-NIRS parameters at 50% MVC are given in Table 3 for 10 participants (9 participants for correlations of ∆tn, excluding the outlier). Statistically significant correlations existed between the inflection duration for ∆ [Hb] and all of the frequency parameters of the MNF, with values of –0.73, –0.90, and –0.80. The inflection duration for the ∆ [HbO2] showed a statistically significant correlation
(–0.79) with the MNF slope (Hz/s). ∆Rn,HbO2,50 had statistically significant correlations with all of the MNF parameters, with values of 0.66 and 0.82. The fast phase’s slope parameter m showed statistically significant positive correlations with all of the MNF parameters for both ∆ [Hb] and ∆ [HbO2]. Statistically significant
correlations between the exercise duration and MNF at 50% MVC were –0.59 for the MNF slope (Hz/s) and –0.65 (statistically significant) for the MNF slope (%/s).
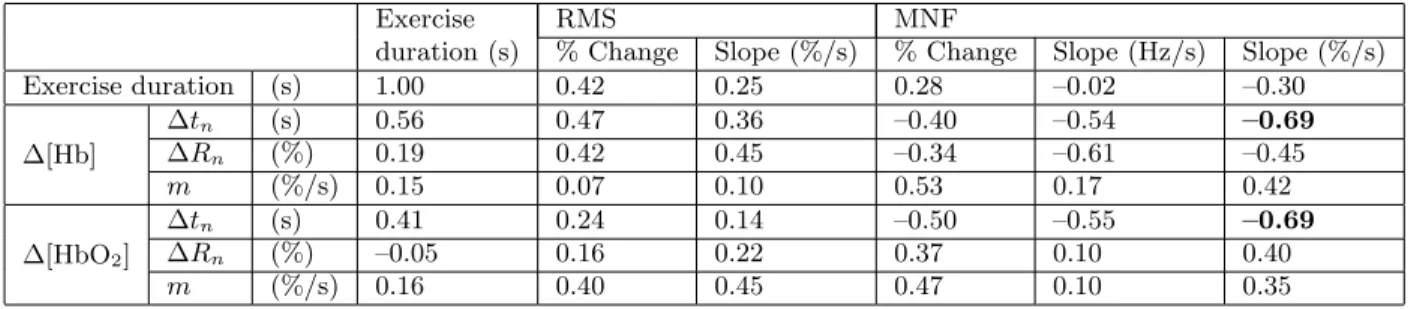
Table 4 lists the correlation values at 75% MVC for the 10 participants. There were just 2 statistically significant correlations for this force level, between ∆tn and the MNF slope (%/s), with a value of –0.69 for both Hb and HbO2.
Table 3. Correlation coefficients between sEMG parameters and NIRS parameters at 50% MVC (statistically significant values are in bold font).
Exercise RMS MNF
duration (s) % Change Slope (%/s) % Change Slope (Hz/s) Slope (%/s)
Exercise duration (s) 1.00 0.46 0.33 –0.31 –0.59 –0.65 ∆[Hb] ∆Rf (%) –0.10 0.24 0.30 0.41 0.36 0.33 ∆tn (s) 0.53 0.20 0.04 –0.73 –0.90 –0.80 ∆Rn (%) 0.04 0.48 0.51 0.37 0.14 0.25 m (%/s) –0.11 –0.06 –0.02 0.82 0.66 0.67 ∆[HbO2] ∆Rf (%) –0.03 0.21 0.23 0.53 0.48 0.45 ∆tn (s) 0.55 0.32 0.14 –0.50 –0.79 –0.61 ∆Rn (%) –0.05 0.00 –0.01 0.82 0.66 0.66 m (%/s) –0.09 –0.22 –0.22 0.84 0.71 0.68
Table 4. Correlation coefficients between sEMG parameters and NIRS parameters at 75% MVC (statistically significant values are in bold font).
Exercise RMS MNF
duration (s) % Change Slope (%/s) % Change Slope (Hz/s) Slope (%/s)
Exercise duration (s) 1.00 0.42 0.25 0.28 –0.02 –0.30 ∆[Hb] ∆tn (s) 0.56 0.47 0.36 –0.40 –0.54 –0.69 ∆Rn (%) 0.19 0.42 0.45 –0.34 –0.61 –0.45 m (%/s) 0.15 0.07 0.10 0.53 0.17 0.42 ∆[HbO2] ∆tn (s) 0.41 0.24 0.14 –0.50 –0.55 –0.69 ∆Rn (%) –0.05 0.16 0.22 0.37 0.10 0.40 m (%/s) 0.16 0.40 0.45 0.47 0.10 0.35 4. Discussion
A high energy demand coupled with an oxygen limitation due to intramuscular pressure (IMP) increase was responsible for the rapid changes of Hb and HbO2 in the fast phase. IMP is known to be positively correlated
with the force during static contractions, leading to a compression of the vascular bed and occlusion of the blood flow [23]. The sequel of local energy turnover during isometric contractions was reflected in the dynamics of the Hb and HbO2 concentration changes by the trend order of the initial fast phase, followed by the slow
phase, and finally the hyperemic phase at the end of exercise, which has been reported previously [15,24,25]. In contrast, the sEMG parameter MNF decreased continuously, which has been well documented for fatiguing exercises. Typical MNF decrease has been attributed to the decrease in CV [26,27] and MU synchronization [28]. The RMS was quite variable in terms of the time-series pattern, but in general, it increased, except in one case. EMG signal amplitude increases have been reported in isometric exercises [29,30] and explained with MU synchronization and firing rate increases, which counteract the fatigue process of the MUs and contraction force decrements [31]. Statistically significant negative correlations were computed between the exercise duration and MNF slopes at 50% MVC.
The fast phase change rates of ∆ [Hb] and ∆ [HbO2] were higher and the inflection durations were
significantly shorter at 75% MVC. The MNF slopes were higher at 75% MVC. Interestingly, the resulting mean percentage changes of the MNF at the end of the exercise were close for the 2 force output levels. This finding had a counterpart in the cw-NIRS signal, as the maximum concentration change levels were also close for the 2 force output levels.
Significant correlations were computed between the sEMG and NIRS parameters, especially at 50% MVC, namely those significant correlations of the ∆tn, ∆Rn, and fast phase slopes with the MNF parameters at 50%
MVC. For this force level, significant negative correlations were found between the ∆tn and MNF decline magnitudes for both Hb and HbO2, i.e. a longer inflection duration was accompanied by a slower MNF decline.
The fast phase slope m had significant positive correlations with all of the MNF parameters, for both ∆ [Hb] and ∆ [HbO2]. The ∆Rn,HbO2,50 and MNF decline slopes were among those significant correlations. At 75% MVC, statistically significant correlations existed only between the ∆tn and MNF slope (%/s), for both Hb and HbO2.
The inflection duration determined from the fast phase was negatively correlated (significant at both force levels) with the MNF slopes, indicating a slower myoelectric fatigue process for a longer fast phase. Correlation between the exercise duration and inflection duration was positive but low and not significant. In the fast phase, the available oxygen within the vascular bed was consumed by the aerobic energy production mechanism. As shown in Table 1, the means of ∆Rn were similar between the 2 force levels for ∆ [Hb] and ∆ [HbO2]. Hence,
oxygen was consumed until it dropped to similar levels at both force levels, being faster at 75% MVC. The reduced oxygenation decline rate observed after the inflection point can be explained by the reduced availability of oxygen in the aerobic energy pathways and blood occlusion by the IMP increase. The decrease of oxygen available to mitochondrial pathways leads to the preference for anaerobic metabolism over aerobic metabolism [32].
Correlation between the cw-NIRS parameters calculated from the fast phase and sEMG parameters computed for the whole exercise can be explained by the fact that higher energy requirements should lead to a faster fatigue process. The fast phase slopes of the cw-NIRS parameters indicate an energy requirement and the sEMG slope parameters reflect a fatigue development rate throughout the whole exercise. Thus, fast phase NIRS parameters give information about the energy requirement rate, which had to be maintained throughout the whole exercise. The decrease in the number and magnitudes of significant correlations between the sEMG and NIRS at 75% MVC also supports the above reasoning. It can be assumed that mostly aerobic fibers were recruited at 50% MVC, at least in the early region of the isometric exercise. The high energy turnover rate at 75% MVC requires contributions from both aerobic and anaerobic mechanisms, starting from the very beginning of exercise; hence, the rate found from the cw-NIRS does not match the total energy rate. This should lead to the poor correlation between the cw-NIRS parameters obtained from the fast phase region and sEMG parameters. Supporting this line of thought, Felici et al. [15] found reductions of between 60% and 80% MVC in the interval change of deoxygenation, whereas the sEMG parameters (computed for the fast phase of NIRS) exhibited new steep increases. They stated that this finding showed recruitment of mostly type II B glycolytic fibers above 60% MVC. The lower loading during 50% MVC has probably allowed for a more ‘balanced’ force production, as well as a ‘smooth’ and delayed fatigue development due to the MU rotation (substitution). The contraction pattern of the FDS muscle during the isometric finger flexion forces up to 50% MVC, causing only less than half of the MUs to be active [33]. MU rotation states that fatigued MUs can be switched with more ‘ready’ MUs, which is speculated to be for the protection of MUs from excessive fatigue during sustained low-level muscle activity [34]. A higher work rate and the necessity of a high number of active muscle fibers should decrease the efficiency of this mechanism.
Although care was taken, nearby muscles in the forearm may have caused crosstalk for the sEMG. It is assumed that blood flow occlusion caused by high isometric force levels employed in this study limited the skin blood flow effect for cw-NIRS. The source detector distance was also 3.0 cm and the fat thickness of the participants was 2.1 ± 0.7 mm, allowing the major probed volume to be muscle tissue.
5. Conclusion
The main finding of this study was that the enhanced local energy requirement of the FDS muscle in isometric force was well reflected in the parametric analysis of both the cw-NIRS and sEMG recordings. The 2 techniques are sensitive to different mechanisms. cw-NIRS parameters are sensitive to Hb and HbO2 in the probed tissue
volume at the capillary levels. sEMG, on the other hand, is affected by both physiological changes leading to a decrease in the excitation-contraction mechanism and MU recruitment and synchronization strategies of the central nervous system that try to cope with the fatigue process. sEMG is an indicator of continuing changes, whereas NIRS provides more information about the initial phase of the isometric exercise. Although cw-NIRS parameters do not change much after the fast phase, these fast phase parameters have been shown to give information about fatigue development throughout isometric exercise.
Fast phase decline/increase rates were used in some studies by finding the slope of the fastest change in the early rapid change phase of the signal. Use of the inflection point was previously employed for NIRS analysis for dynamic exercises [35–39], especially for the relationship of cardiopulmonary and NIRS parameters, i.e. for anaerobic point determination. We showed the correlation of the inflection point parameters (i.e. duration and amplitude) with the sEMG parameters, computed using the whole exercise duration. Our results were encouraging, and the correlation analysis of the inflection duration parameter, as well as the amplitude changes until the inflection point with the sEMG parameters, gave successful results. These findings have implications to reveal these parameters as biometrics for probing energy metabolism. In our study, maximum changes within the first minute of exercise obtained at 75% MVC were used to obtain normalized amplitude parameters to alleviate the quantification problem of cw-NIRS (similarly, normalization by a value obtained at 50% MVC was the method in the study of Yamada et al. [40]). The method of this normalization level and the successful results should help researchers to develop exercise protocols for the investigation of muscle performance and fatigue, enabling them to avoid the uncomfortable and painful ischemia measurements employed in some experiments for amplitude normalization. We also adopted an isometric contraction until volitional fatigue, i.e. not a fixed-time protocol. Hence, the relationships between the cw-NIRS parameters, which were shown to mostly change in the early phase of the exercise, with the parameters of the sEMG found for the whole exercise were investigated. This showed that the cw-NIRS parameters calculated from the early phase of the exercise can reveal information about the fatigue process rate. The results encourage the use of cw-NIRS technology for sports and physiology studies.
Acknowledgments
This study was supported by the Bo˘gazi¸ci University Research Fund through project 04S0101 and by the Turkish State Planning Organization (DPT) through project 03K120250. The Marmara University Sports Sciences and Athletes’ Health Research and Practice Center facility was used for performing the measurements. We would like to thank Bilal Bi¸cer, Orkun Pelvan, and Selda Uzun for their help with data collection and Bilal Bi¸cer again for his participation in discussions. We would like to thank Deniz Nev¸sehirli for his help with the technical issues and maintenance of the NIROXCOPE 301 device. The doctoral fellowship for ¨Omer S¸ayli from the Scientific and Technological Research Council of Turkey (T ¨UB˙ITAK) is gratefully acknowledged.
References
[1] R.H. Edwards, D.K. Hill, D.A. Jones, P.A. Merton, “Fatigue of long duration in human skeletal muscle after exercise”, The Journal of Physiology, Vol. 272, pp. 769–778, 1977.
[2] D.K. Kumar, N.D. Pah, A. Bradley, “Wavelet analysis of surface electromyography to determine muscle fatigue”, IEEE Transactions on Neural Systems & Rehabilitation Engineering, Vol. 11, pp. 400–406, 2003.
[3] N.K. Vøllestad, “Measurement of human muscle fatigue”, Journal of Neuroscience Methods, Vol. 74, pp. 219–227, 1997.
[4] G. Kamen, G.E. Caldwell, “Physiology and interpretation of the electromyogram”, Journal of Clinical Neurophysi-ology, Vol. 13, pp. 366–384, 1996.
[5] D. Farina, R. Merletti, R.M. Enoka, “The extraction of neural strategies from the surface EMG”, Journal of Applied Physiology, Vol. 96, pp. 1486–1495, 2004.
[6] M. Ferrari, M. Muthalib, V. Quaresima, “The use of near-infrared spectroscopy in understanding skeletal muscle physiology: recent developments”, Philosophical Transactions, Series A, Mathematical, Physical, and Engineering Sciences, Vol. 369, pp. 4577–4590, 2011.
[7] D.M. Mancini, L. Bolinger, H. Li, K. Kendrick, B. Chance, J.R. Wilson, “Validation of near-infrared spectroscopy in humans”, Journal of Applied Physiology, Vol. 77, pp. 2740–2747, 1994.
[8] E. Alfonsi, R. Pavesi, I. M. Merlo, A. Gelmetti, D. Zambarbieri, P. Lago, A. Arrigo, C. Reggiani, A. Moglia, “Hemoglobin near-infrared spectroscopy and surface EMG study in muscle ischaemia and fatiguing isometric contraction”, The Journal of Sports Medicine and Physical Fitness, Vol. 39, pp. 83–92, 1999.
[9] A.A. Hicks, S. McGill, R.L. Hughson, “Tissue oxygenation by near-infrared spectroscopy and muscle blood flow during isometric contractions of the forearm”, Canadian Journal of Applied Physiology, Vol. 24, pp. 216–230, 1999.
[10] M. Praagman, H.E.J. Veeger, E.K.J. Chadwick, W.N.J.M. Colier, F.C.T. van der Helm, “Muscle oxygen consump-tion, determined by NIRS, in relation to external force and EMG”, Journal of Biomechanics, Vol. 36, pp. 905–912, 2003.
[11] G.H. Elcadi, M. Forsman, A.G. Crenshaw, “The relationship between oxygenation and myoelectric activity in the forearm and shoulder muscles of males and females”, European Journal of Applied Physiology, Vol. 111, pp. 647–658, 2011.
[12] H. Miura, H. Araki, H. Matoba, K. Kitagawa, “Relationship among oxygenation, myoelectric activity, and lactic acid accumulation in vastus lateralis muscle during exercise with constant work rate”, International Journal of Sports Medicine, Vol. 21, pp. 180–184, 2000.
[13] W. Moalla, A. Merzouk, F. Costes, Z. Tabka, S. Ahmaidi, “Muscle oxygenation and EMG activity during isometric exercise in children”, Journal of Sports Sciences, Vol. 24, pp. 1195–1201, 2006.
[14] E. Yamada, T. Kusaka, N. Arima, K. Isobe, T. Yamamoto, S. Itoh, “Relationship between muscle oxygenation and electromyography activity during sustained isometric contraction”, Clinical Physiology and Functional Imaging, Vol. 28, pp. 216–21, 2008.
[15] F. Felici, V. Quaresima, L. Fattorini, P. Sbriccoli, G.C. Filligoi, M. Ferrari, “Biceps brachii myoelectric and oxygenation changes during static and sinusoidal isometric exercises”, Journal of Electromyography and Kinesiology, Vol. 19, pp. e1–11, 2009.
[16] J.R. Blackwell, K.W. Kornatz, E.M. Heath, “Effect of grip span on maximal grip force and fatigue of flexor digitorum superficialis”, Applied Ergonomics, Vol. 30, pp. 401–405, 1999.
[17] ¨O. S¸ayli, B. Bi¸cer, S. Uzun, O. Pelvan, A. Akın, B. C¸ otuk, “Muscle fatigue investigation studies using near-infrared spectroscopy and surface electromyography”, Journal of Marmara University Institute of Health Sciences, Vol. 1, pp. 17–25, 2011 (article in Turkish with English abstract).
[18] M. Cope, “The application of near infrared spectroscopy to non-invasive monitoring of cerebral oxygenation in the newborn infant”, PhD, University College London, 1991.
[19] ¨O. S¸ayli, “Accuracy improvements of NIRS and investigation of muscle oxidative metabolism”, PhD, Bo˘gazi¸ci University, 2009.
[20] S. Yamaji, S. Demura, Y. Nagasawa, M. Nakada, “Relationships between decreasing force and muscle oxygenation kinetics during sustained static gripping”, Journal of Physiological Anthropology and Applied Human Science, Vol. 23, pp. 41–47, 2004.
[21] ¨O. S¸ayli, S. Uzun, A. Akın, B. C¸ otuk, “EMGALY.1: Grafik kullanıcı ara y¨uzl¨u y¨uzeyel elektromyografi inceleme yazılımı”, Biomedical Engineering Meeting B˙IYOMUT, 2007 (in Turkish).
[22] A.V. Oppenheim, R.W. Schafer, Discrete-Time Signal Processing, Upper Saddle River, NJ, USA, Prentice Hall, 1989.
[23] T. Sadamoto, F. Bonde-Petersen, Y. Suzuki, “Skeletal muscle tension, flow, pressure, and EMG during sustained isometric contractions in humans”, European Journal of Applied Physiology and Occupational Physiology, Vol. 51, pp. 395–408, 1983.
[24] Y. Yoshitake, H. Ue, M. Miyazaki, T. Moritani, “Assessment of lower-back muscle fatigue using electromyography, mechanomyography, and near-infrared spectroscopy”, European Journal of Applied Physiology, Vol. 84, pp. 174–179, 2001.
[25] J. Taelman, J. Vanderhaegen, M. Robijns, G. Naulaers, A. Spaepen, S. Van Huffel, “Estimation of muscle fatigue using surface electromyography and near-infrared spectroscopy”, Advances in Experimental Medicine and Biology, Vol. 701, pp. 353–359, 2011.
[26] H. Kranz, A.M. Williams, J. Cassell, D.J. Caddy, R.B. Silberstein, “Factors determining the frequency content of the electromyogram”, Journal of Applied Physiology, Vol. 55, pp. 392–399, 1983.
[27] L.H. Lindstrom, R.I. Magnusson, “Interpretation of myoelectric power spectra: a model and its applications”, Proceedings of the IEEE, Vol. 65, pp. 653–662, 1977.
[28] C.J.D. Luca, J.L. Creigh, “Do the firing statistics of motor units modify the frequency component of the EMG signal during sustained contractions?”, International Series on Biomechanics, Vol. 5A, pp. 358–362, 1985.
[29] B.R. Bigland-Ritchie, N.J. Dawson, R.S. Johansson, O.C. Lippold, “Reflex origin for the slowing of motoneurone firing rates in fatigue of human voluntary contractions”, The Journal of Physiology, Vol. 379, pp. 451–459, 1986. [30] T. Moritani, M. Muro, A. Nagata, “Intramuscular and surface electromyogram changes during muscle fatigue”,
Journal of Applied Physiology, Vol. 60, pp. 1179–1185, 1986.
[31] J.A. Kent-Braun, “Noninvasive measures of central and peripheral activation in human muscle fatigue”, Muscle & Nerve Supplement, Vol. 5, pp. S98–101, 1997.
[32] T. Hamaoka, T. Osada, N. Murase, T. Sako, H. Higuchi, Y. Kurosawa, M. Miwa, T. Katsumura, B. Chance, “Quantitative evaluation of oxygenation and metabolism in the human skeletal muscle”, Optical Review, Vol. 10, pp. 493–497, 2003.
[33] T.J. Butler, S.L. Kilbreath, R.B. Gorman, S.C. Gandevia, “Selective recruitment of single motor units in human flexor digitorum superficialis muscle during flexion of individual fingers”, The Journal of Physiology, Vol. 567, pp. 301–309, 2005.
[34] R.H. Westgaard, C.J. De Luca, “Motor unit substitution in long-duration contractions of the human trapezius muscle”, Journal of Neurophysiology, Vol. 82, pp. 501–504, 1999.
[35] R.P. Rao, M.J. Danduran, R.S. Loomba, J.E. Dixon, G.M. Hoffman, “Near-infrared spectroscopic monitoring during cardiopulmonary exercise testing detects anaerobic threshold”, Pediatric Cardiology, Vol. 33, pp. 791–796, 2012.
[36] L. Wang, T. Yoshikawa, T. Hara, H. Nakao, T. Suzuki, S. Fujimoto, “Which common NIRS variable reflects muscle estimated lactate threshold most closely?”, Applied Physiology Nutrition and Metabolism, Vol. 31, pp. 612–620, 2006.
[37] R.P. Rao, M.J. Danduran, P.C. Frommelt, N.S. Ghanayem, S. Berger, P.M. Simpson, K. Yan, G.M. Hoffman, “Mea-surement of regional tissue bed venous weighted oximetric trends during exercise by near infrared spectroscopy”, Pediatric Cardiology, Vol. 30, pp. 465–471, 2009.
[38] A.P.E. Rissanen, H.O. Tikkanen, A.S. Koponen, J.M. Aho, H. H¨agglund, H. Lindholm, J.E. Peltonen, “Alveolar gas exchange and tissue oxygenation during incremental treadmill exercise, and their associations with blood O(2) carrying capacity”, Frontiers in Physiology, Vol. 3, p. 265, 2012.
[39] M. Mizuno, K. Tokizawa, T. Iwakawa, I. Muraoka, “Inflection points of cardiovascular responses and oxygenation are correlated in the distal but not the proximal portions of muscle during incremental exercise”, Journal of Applied Physiology, Vol. 97, pp. 867–873, 2004.
[40] E. Yamada, T. Kusaka, K. Miyamoto, S. Tanaka, S. Morita, Y. Cao, S. Mori, H. Norimatsu, S. Itoh, “Relationships between changes in oxygenation during exercise and recovery in trained athletes”, Optical Review, Vol. 5, pp. 436–439, 2003.

![Figure 4. Illustration of the cw-NIRS parameters on a typical ∆ [HbO 2 ] graph.](https://thumb-eu.123doks.com/thumbv2/9libnet/4250350.67491/5.918.180.650.694.914/figure-illustration-cw-nirs-parameters-typical-hbo-graph.webp)