ISTANBUL BILGI UNIVERSITY INSTITUTE OF SOCIAL SCIENCES
ORGANIZATIONAL PSYCHOLOGY MASTER PROGRAM
A Meta-Analysis on the Relationship between Job Satisfaction and Job Performance
Cem Cemre Korkut Öğrenci No: 113634002
Tez DanıĢmanı: Yrd. Doç Dr. Ġdil IġIK
ĠSTANBUL 2017
A Meta-Analysis on the Relationship between Job Satisfaction and Job Performance
ĠĢ Performansı ve ĠĢ Tatmini Üzerine Meta-Analiz ÇalıĢması
Cem Cemre Korkut Öğrenci No: 113634002
Tez DanıĢmanı: Yrd. Doç. Dr. Ġdil IĢık ĠMZASI: Jüri Üyesi: Yrd. Doç. Dr. Gergely Czukor ĠMZASI: Jüri Üyesi: Doç.Dr. Burcu Güler ĠMZASI:
Tezin Onaylandığı Tarih: Toplam Sayfa Sayısı:
Anahtar Kelimeler Keywords
1) ĠĢ Performansı 1) Job Performance
2) ĠĢ Tatmini 2) Job Satisfaction
iii
ACKNOWLEDGEMENTS
I want to thank my advisor, Asst. Prof. Dr. Ġdil IĢık for her opinions, support and guidance. I would like to thank my family and friends for their support.
iv Abstract
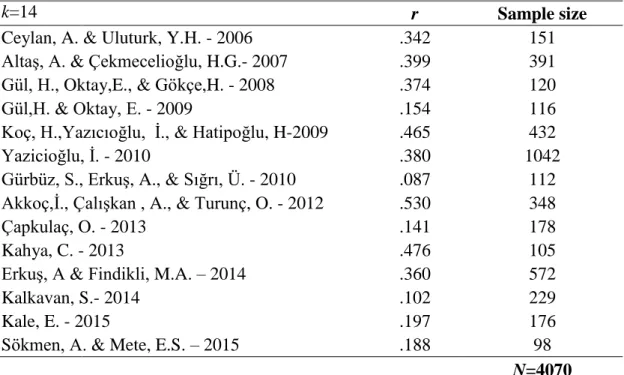
The purpose of this study is to determine the relationship between job satisfaction and job performance by using meta-analytic research methodology. In a quantitative research paper, researchers focus on a specific correlation between variables or the effect of a specific variable on other variables statistically. This approach is important and necessary for a simple and understandable research paper. In recent years, meta-analytic studies are carried out in order to assess cumulatively the findings of quantitative research. Researchers conduct it in different areas of science to make a general judgement about correlational or causal relationships. Within the framework of this research methodology, this thesis focuses on studies with samples from Turkey specifically and examines the relationship between job satisfaction and job performance. In the process of decision on variables to study meta-analytically, literature review has been conducted about factors that affect organizational and individual performance. In this phase, the studies about the effect and relationship of job satisfaction on job performance were more frequent than the other constructs and it was decided to concentrate on this relationship. The inclusion criteria were as follows: quantitative research with sufficient information for calculation of effect size on samples solely include employees from Turkey. Consequently, 12 articles, one master thesis and one doctorate thesis met these inclusion criteria. Total sample size of 14 studies is 4070. Among these fourteen studies; Akkoç, ÇalıĢkan and Turunç (2012)‟s study reported the highest correlation between job satisfaction and job performance (r=.530, p=.01). Gürbüz, ErkuĢ, and Sığrı (2010)‟s study has the lowest correlation (r=.087, p=.05). Meta-analysis was conducted by using Comprehensive Meta-Analysis Software and overall results depicted that there is positive and statistically significant correlation (r= .315, p= .000, k=14, N= 4070) between job satisfaction and job performance and the effect size is medium to large level (Cohen, 1988). In addition, it was possible to categorize nine studies within 14 papers according to their samples. When six research papers with private sector employees only were investigated, there is positive and statistically significant correlation (r= .258, p= .000, k=6, N= 1434) again. According to
v
Cohen (1988), this is small to medium effect. Furthermore, the three research papers out of 14 studies were investigated that included solely public sector employees as sample, the relationship is positive and statistically significant (r= .339, p= .000, k=3, N= 341). According to Cohen (1988), this is medium to large effect. In the discussion section, these general and sector specific effect sizes are interpreted and compared with the available meta-analytic research from the international literature. It was observed that these effect sizes ranging between small to large level are consistent with earlier research findings.
vi Öz
Bu çalıĢmanın amacı iĢ tatmini ve iĢ performansı arasındaki iliĢkiyi araĢtırmaktır. Nicel bir çalıĢmada, bir araĢtırmacı değiĢkenler arasındaki iliĢkileri ya da bir değiĢkenin, diğer değiĢkenler üzerindeki nedensel etkisini istatiksel olarak irdeler. Bu istatiksel yaklaĢım, basit ve anlaĢılabilir bir analiz ve çalıĢma için çok önemlidir. Son yıllarda, farklı bilim alanlarında, çeĢitli olgular üzerinde yürütülen nicel araĢtırmalardan elde edilen bulguların kümülatif Ģekilde değerlendirilmesi ve farklı olgular arasındaki korelasyonel ya da nedensel iliĢkilere dair genel bir yargıya varılması için meta-analiz araĢtırmaları yapılmaktadır. Bu metodoloji çerçevesinde, bu tez kapsamında yürütülen araĢtırma da spesifik olarak iĢ tatmini ve iĢ performansı arasındaki iliĢkiye dair Türkiye‟den farklı örneklemlerle yapılmıĢ nicel araĢtırmalardan elde edilen bulguları bir araya getirmek amacıyla yapılan bir meta-analiz çalıĢmasıdır. Bu kapsamda hangi değiĢkenler arasındaki iliĢkiye bakılacağına karar verilme sürecinde, genel anlamda örgütsel ve bireysel performansı etkileyen faktörler üzerine araĢtırma yapılmıĢtır. Literatürle ile ilgili ön araĢtırma sonucunda, birçok çalıĢma incelenmiĢ olup, diğer faktörler ile kıyaslandığında iĢ tatmininin iĢ performansı üzerine etkisi ve iliĢkisine dair daha fazla sayıda araĢtırma bulunduğu görülmüĢ ve bu iliĢkiye yoğunlaĢılmasına karar verilmiĢtir. ÇalıĢmaların, meta-analize dahil edilmesi için makalelerin nicel bir çalıĢma olması ve etki büyüklüğünün hesaplanması için yeterli bilgiye sahip olması ve en önemli kriter olarak, örneklemlerinin sadece Türkiye‟deki çalıĢanları içermesi gerekmektedir. Sonuç olarak, 12 makale, bir yüksek lisans tezi ve bir doktora tezi istenen seçim kriterlerini karĢıladığı için meta-analiz çalıĢmasına dahil edilmesine karar verilmiĢtir. Analize dahil edilen 14 çalıĢmanın toplam örneklem büyüklüğü 4070‟dir. ĠĢ tatmini ile iĢ performansı arasındaki korelasyonu inceleyen bu meta-analiz içerisinde en yüksek korelasyona sahip çalıĢma, Akkoç, ÇalıĢkan ve Turunç (2012)‟nin makalesidir (r=.530, p=.01). Minimum korelasyona sahip çalıĢma ise Gürbüz, ErkuĢ ve Sığrı (2010)‟nın makalesidir (r=.087, p=.05). Meta-analitik çalıĢma Comprehensive Meta-Analysis Software programı kullanılarak yürütülmüĢtür ve genel sonuçlara dayanarak; iĢ tatmini ile iĢ performansı olguları arasında pozitif ve istatiksel yönden anlamlı bir sonuç (r=
vii
.315, p= .000, k=14, N= 4070) elde edilmiĢ olup, bu iliĢki etki büyüklüğü açısından orta ile büyük arasındaki bir seviyededir (Cohen, 1988). Ayrıca, 14 çalıĢma içerisinden dokuz çalıĢma örneklemleri açısından özel ve kamu sektörü olarak gruplanabilmektedir. Örneklemi, özel sektör çalıĢanlarını içeren altı çalıĢma, iĢ tatmini ile iĢ performansı arasında pozitif ve istatiksel yönden anlamlı bir sonuç (r= .258, p= .000, k=6, N= 1434) vardır; bu iliĢkinin etki büyüklüğü küçük ile orta seviye arasında nitelendirilmiĢtir (Cohen, 1988). Örneklemi, kamu sektör çalıĢanlarını içeren üç çalıĢmaya ise yine pozitif ve istatiksel yönden anlamlı bir iliĢki olduğunu (r= .339, p= .000, k=3, N= 341) ve bu iliĢkinin orta ile büyük arasındaki bir etki düzeyi olduğunu göstermektedir (Cohen, 1988). TartıĢma bölümünde, bu genel ve sektöre özel etki büyüklükleri uluslararası meta-analiz çalıĢmalarından elde edilen etki büyüklükleri açısından yorumlanmıĢ ve karĢılaĢtırılmıĢtır. Küçük ile büyük etki büyüklüğü aralığında değiĢkenlik gösteren bu pozitif iliĢki önceki meta-analiz bulguları ile tutarlıdır.
viii
TABLE OF CONTENT
SECTION 1 – INTRODUCTION ... 1
1.Job Satisfaction ... 1
2.Job Performance ... 4
3.Meta-analysis as a research methodology ... 5
4.Aim of the present study ... 6
SECTION II – METHOD ... 7
1.Literature Search and Inclusion Criteria ... 7
2.Coding Procedures ... 12
3.Meta-Analytic Procedures ... 12
SECTION III – RESULTS ... 13
1.Sampling characteristics of the studies included in meta-analysis ... 13
2.Measurement tools used by the studies included in meta-analysis ... 20
2.1.Job Satisfaction scales used by the fourteen studies of present meta-analysis 20 2.1.1.Minnesota Job Satisfaction Scale by Weiss, Dawis, England, and Lofquist (1967)……… 20
2.1.2.Index of Job Satisfaction by Brayfield, and Rothe (1951) ... 20
2.1.3.Job Satisfaction scale by Bakan and BüyükbeĢe (2004) ... 21
2.1.4.Job Satisfaction scale by Babin and Boles (1996) ... 21
2.1.5.Job Satisfaction scale by Hackman and Oldham (1974) ... 21
2.1.6.Job Satisfaction scale by Arnett (1999) / Judge, Woolf, and Hurst (2009) 22 2.1.7.Job Satisfaction scale by Lytle (1994) / Kim, Leong, and Lee (2005) ... 22
2.1.8.Job Satisfaction scale by Cammann, Fichman, Jenkin, and Klesh (1983) ... 22
2.1.9.Job Satisfaction scale by Miller and Medalia (1955) ... 23
2.1.10.Job satisfaction scale by Rusbult, Farrell, Rogers, and Mainous (1988) ... 23
3.1.Job Performance scales used by the fourteen studies of present meta-analysis………..23
3.1.1.Job performance scale by Kirkman, and Rosen (1999) and Sigler, and Pearson (2000)……….. 23
3.1.2.Job performance scale by Gürkanlar (2010) ... 24
3.1.3.Job performance scale by Porter, and Lawler (1968) ... 24
3.1.4.Job performance scale by Bush, Ortinau, and Hair (1990) ... 24
ix
3.1.6.Job Performance scale of Choo (1986) ... 25 4.Summary of the studies included in the meta-analysis ... 29 4.1.Studies with the private sector employee samples ... 29 4.1.1.AltaĢ and Çekmecelioğlu (2007)‟s research on relationship among job satisfaction, organizational commitment, and job performance ... 29 4.1.2.Gürbüz, ErkuĢ, and Sığrı (2010)‟s research on the relationship of core self evaluation with job satisfaction and job performance... 30 4.1.3.Akkoç, ÇalıĢkan, and Turunç (2012)‟s research on the effect of development culture and perceived organizational support on job satisfaction and job
performance and the mediating role of trust ... 30 4.1.4.Çapkulaç (2013)‟s master thesis on the effect of managers‟ emotional
intelligence on job satisfaction and job performance ... 31 4.1.5.Kalkavan (2014)‟ doctorate thesis on the effect of coaching behavior of managers on job satisfaction, organizational commitment, and organizational performance in the context of various organizational cultures ... 31 4.1.6.Kale (2015)‟s research on the effect of leader and peer support on job
performance and the mediating role of job and life satisfaction ... 32 4.2.Studies with the sample from public sector organizations ... 32 4.2.1.Gül, Oktay, and Gökçe (2008)‟s research on the relationship between job performance, job satisfaction, organizational commitment, intention to leave, and stress……….. 33 4.2.2.Gül and Oktay (2009)‟s research on the relationship between job
performance, job satisfaction, wage and career ... 33 4.2.3.Kahya (2013)‟s research on mediating role of job satisfaction in the
relationship between organizational cynicism and job performance ... 34 4.3.Studies with the samples that are not specified either as public or private sector 34 4.3.1.Ceylan and Ulutürk (2006)‟s research on relationship between job
performance, job satisfaction, role ambiguity and rol conflict ... 34 4.3.2.Study done by Koç, Yazıcıoğlu, and Hatipoğlu (2009)‟s on teachers‟ job satisfaction and job performance ... 35 4.3.3.Yazıcıoğlu (2010)‟s research on the relationship between job satisfaction and performance in the samples of Turkey and Kazakistan ... 35 4.3.4.ErkuĢ and Fındıklı (2013)‟s research on the effect of psychological capital on job satisfaction, job performance, and intention to leave... 35 4.3.5. Sökmen and Mete (2015)‟s research on workplace bullying‟s effect on job performance, job satisfaction, intention to leave and harrassment………...36
x
4.4.Summary of the statistical results from the 14 studies included in
meta-analysis………...37
5.Results from the meta-analysis of 14 studies‟ correlational observations……..40
6.Meta-analysis of the studies targeting private sector versus public sector employees………...45
6.1.Meta-Analysis of studies with the sample of Private Sector Employees…….45
6.2.Meta-Analysis of Studies with the sample of Public Sector Employees…….48
SECTION IV – DISCUSSION and CONCLUSION ... 53
References……….59
Appendix A - The Minnesota Job Satisfaction Questionnaire (Weiss, Dawis, England & Lofquist, 1967)………65
Appendix B - Job Satisfaction scale of Brayfield and Rothe (1951)………67
Appendix C - Job Satisfaction scale of Bakan, and BüyükbeĢe (2004) ……… 79
Appendix D - Job Satisfaction scale of Babin, and Boles (1996) ……… 70
Appendix E - Job Satisfaction scale of Hackman, and Oldham (1974) …………..…71
Appendix F - Job Satisfaction scale of Arnett (1999) and Judge& Woolf and Hurst (2009) ………73
Appendix G - Job Satisfaction scale of Lytle (1994) / Kim, Leong, and Lee (2005) ………...74
Appendix H - Job Satisfaction scale of Cammann, Fichman, Jenkin, and Klesh (1983) ………75
Appendix I - Job Satisfaction scale of Miller and Medalia (1955) ……….76
Appendix J - Job Satisfaction scale of Rusbult, Farrell, Rogers, and Maınous (1988) ………...77
Appendix K - Job Performance scale of Kirkman, and Rosen (1999) ……….78
Appendix L - Job Performance scale of Gürkanlar (2010) ……….…79
Appendix M - Job Performance scale of Porter and Lawler (1968)……….80
Appendix N - Job Performance scale of Bush, Ortinau, and Hair (1990)………81
Appendix O - Job Performance scale of Sökmen (2010)……….82
xi
LIST OF FIGURES
Page
Figure 1. Fourteen Studies of Meta-Analysis with Effect Size Calculations and Overall Effect Size based on Random Model with 95% Confidence Intervals
43 Figure 2. Fourteen Studies of Meta-Analysis with Effect Size
Calculations and Overall Effect Size based on Fixed Model With 95% Confidence Intervals
44 Figure 3. Meta-Analysis of Six Studies with Sample from Private Sector -
Fixed Model 46
Figure 4. Meta-Analysis of Six Studies with Sample from Private Sector -
Random Model 47
Figure 5. Meta-Analysis of Three Studies with Sample from Public
Sector - Fixed Model 50
Figure 6. Meta-Analysis of Three Studies With Sample from Public
xii
LIST OF TABLES
Page Table 1. Result from Initial Literature Review and Distribution Of Studies
according to the Constructs Focused in Relation to Job Performance 8 Table 2. List of 14 Studies Included in the Meta-Analysis and Their
Sources 10
Table 3. Pearson Correlation Coefficient “r” As Effect Size Index and Its
Interpretation (Cohen, 1988) 12
Table 4. The Sample Characteristics of 14 Studies Included in the
Meta-Analysis 14
Table 5. Distribution of 14 Studies according to Their Sample Size 16 Table 6. Distribution of 14 Studies according to the Sectors of Their
Samples 16
Table 7. Distribution of 14 Studies according to Their Targeted Sample 17 Table 8. Demographic Characteristics Of the Samples in the 14
Studies Included in the Meta-Analysis 18
Table 9. Measurement Instruments, Tools, and Scales of the 14 Studies
Included in Meta-Analysis 26
Table 10. Distribution of 14 Studies according to Scales Used to Measure
Job Satisfaction 28
Table 11. Distribution of 14 Studies according to Scales Used to Measure
Job Performance 28
Table 12. Reported Correlation Levels between Job Satisfaction and Job
Performance in the 14 Studies included in the Meta-Analysis 38 Table 13. Distribution of 14 Studies according to Effect Sizes 40 Table 14. Data from 14 Studies Entered to Comprehensive Meta Analysis
Software 41
Table 15. Result of the Meta-Analysis (K=14) 42
Table 16. Result of the Meta-Analysis regarding to Private Sector
Employees (K=6) 48
Table 17. Result of the Meta-Analysis regarding to Public Sector
Employees (K=3) 49
Table 18. Comparison of Effect Sizes from Overall Meta-Analysis, Private
and Public Sector Studies 52
Table 19. Comparison of the Effect Sizes on the Relationship Between Job Satisfaction and Job Performance from the Present Meta-Analysis and Earlier International Meta-Analyses
1
SECTION 1 – INTRODUCTION
Factors that affect job satisfaction and job performance levels of employees are among the core constructs that industrial and organizational psychologists frequently focus on. Pioneering interest on job satisfaction is attributed to Hoppock (1936)‟s research on 500 teachers in United States of America. Hoppock (1936) found that teachers who are more satisfied with their jobs showed high levels of emotional adjustment, lower work monotony, better interpersonal relationships and better work performance (in Bowling & Cucina, 2012).
Moving from these early research attempts, job satisfaction and performance appear to be one of the most extensively studied construct in the literature related to workplace issues. Moreover, over the years researchers started to focus on this relationship via meta-analytic lenses (Davar & RanjuBala, 2012; laffaldano & Muchinsky, 1985; Judge, Thoresen, Bono, & Patton, 2001; Petty, McGee, & Cavender, 1984). Details of these meta-analytic studies will be reported in discussion section of the present thesis to compare their results with the present research‟s findings. Following the footsteps of these researchers, the present study aims to investigate the relationship between job satisfaction and job performance meta- analytically in the context of Turkey. To the current researchers‟ knowledge, there is no meta-analytic study on this relationship done so far in Turkey.
Within the framework of this objective, the following sections will first summarize present studies that matched the inclusion criteria (n=14) for the present meta-analysis. These fourteen studies will be summarized individually. Then meta-analytic results showing the mean correlation between job satisfaction and job performance conducted on these 14 studies will be reported and interpreted.
1. Job Satisfaction
Job satisfaction is one of the most extensively studied construct in the literature related to work place issues. One of the early definition was noted by Churchill, Ford, and Walker (1974) by focusing on salesmen‟s attitudes shaped by
2
the characteristics of the job itself and the work environment which are found to be “rewarding, fulfilling, and satisfying, or frustrating and unsatisfying" (p. 258). Beside, Locke (1976) defined job satisfaction as "a pleasurable or positive emotional state resulting from the assessment of one's job or job experiences" (p.1300). He emphasizes the importance of the relationship between job satisfaction and morale by focusing on satisfaction as an individual factor rather than as a group factor. There is numerous research on job satisfaction that guide us to understand this construct properly. Among these, perceived organizational support is one of the factors that researchers emphasize. Kraimer, Wayne, and Jaworski (2001) notes that high level of organizational support provides aid to workers, not only in terms of socio-emotional needs but also in terms of equipment, funding, technology, ideas, and physical assistance. Without such resources, job satisfaction is hard to be experienced, and consequently attaining performance with high quality and quantity is difficult (Eisenberger & Aselage, 2008).
If we summarize the theoretical backgrounds on job satisfaction reported by the studies included in the present meta-analysis, one of the theories covered by the studies included in the current research is Hackman and Oldman (1974)‟s Job Characteristics Model which aims to depict how job redesign and job characteristics affect job satisfaction. Hackman and Oldman (1974) argued that intrinsic nature of work leads employees to be satisfied with their jobs. Their pioneering research included 658 employees working on 62 different jobs in seven organizations including blue collar and white-collar employees. They focused on five core job characteristics: (a) task identity, degree to which one can see one‟s work from beginning to end; (b) task significance, range of abilities needed to perform a specific job; (c) skill variety, degree to which job allows employees to do different tasks; (d) autonomy, degree to which employee has control and discretion for how to conduct their job; and (e) feedback, degree to which the work itself provides feedback for how employee performs the job. They observed positive correlation between task identity and job satisfaction (r = .38, p= .001) and between skill variety and job satisfaction (r = .54, p= .001).
3
Hackman et al. (1974) was mentioned by Gul and Oktay (2009) which is included in the present meta-analysis.
The second framework that was used by the studies included in the current meta-analysis is based on Bakan and Buyukbese (2004)‟s research that aims to operationalize job satisfaction in terms of overall perception of pay, managerial approach, and relationship between employee and employer and its relation with organizational communication. This study included 133 academicians working in the universities of Turkey. Results revealed positive correlation between pay and job satisfaction (r = .114, p= .01) and between positive management approach towards employees and job satisfaction (r = .429, p= .01). Koç, Yazıcıoğlu and Hatipoğlu (2009) and Yazıcıoğlu (2010)‟s articles that are included in the meta-analysis cited Bakan and Buyukbese (2004).
The third theoretical background worth to mention is Babin and Boles (1996) who focus on supervisory support and job satisfaction of employees. They emphasize that positive perceptions of employees towards work have a positive effect on their lives and this triggers job satisfaction and the following that job performance. This study included 261 employees working in restaurants. The positive correlation between job satisfaction and job performance (r = .20, p= .01); and between job satisfaction and supervisory support (r = .32, p= .01) were observed. There was negative correlation between job satisfaction and role conflict (r = -.22, p= .01). Babin et al. (1996)‟s perpective was the framework for ErkuĢ and Fındıklı (2013), and Kale (2015) which are included in the present meta-analysis.
The distinctiveness of these specific theories are clear when we review the diverse tools, because job satisfaction scales are closely connected to job satisfaction theories. Macdonald and MacIntyre (1997) examined specific job satisfaction scales and evolution of these scales over time and they emphasized that pioneers of job satisfaction scales are very important as a manifestation of job satisfaction as a scientific construct. Therefore, theories of job satisfaction and scales of job satisfaction are hard to distinguish. In the method section of this thesis, we will review these tools.
4 2. Job Performance
Job performance is the amount of output that an employee creates in a determined period. Visveswaran (2000) claims that job performance is related to measurable actions, behaviors and potential outcomes that employees involve in or bring about that are linked with and contribute to organizational goals. To understand what constitutes job performance, researchers have reviewed job performance measures used in different contexts and relied on job analytic techniques to explain the behaviors and the associated dimensions of job performance.
Kahn (1990) theorized that there is a unique aspect of job performance that functions in a more holistic, consistent, and connected manner with other organizational outcomes. According to Kahn (1990), organizational productivity and effectiveness are the most important outcome of job performance when job involvement, job satisfaction, and intrinsic motivation are additional mediators. Furthermore, Greenhouse (1990) claims that psychological well-being of groups or teams are consequences of job performance. Moreover, job performance is frequently studied in terms of organizational determinants such as organizational structure, systems, size and history, performance monitoring and feedback by employer, communication flow between employees, human resource management factors, leadership, group working processes, and job conditions (Hansen & Wernerfelt, 1989).
Kirkman and Rosen (1999) were the most frequently cited researchers by the studies included in the present meta-analysis. They conducted a study to reveal antecedents and consequences of team empowerment. This study included 181 employees who work in textile, technology, and insurance sectors in United States of America. They compared the job performance of team members and team leaders following team empowerment. Results showed that responsibilities given to teams, and team based human resources management policies trigger job performance of members in a team. Kirkman et al. (1999) concluded that team empowerment triggers job performance and increases individual job performance.
5
Another theoretical framework belongs to Sigler and Pearson (2000) whose research is about the relationship between organizational culture and employee performance. This study included 212 employees who work in textile sector in Southeastern United States. Sigler et al. (2000) reinterpreted and developed job performance scale of Kirkman et al. (1999). Çöl (2008) investigated the effect of perceived empowerment on job performance following the approach of Kirkman et al. (1999) and Sigler et al. (2000). This study included 403 academicians who work in state universities of Turkey. According to the findings, there is positive correlation between perceived team empowerment and job performance. Çöl (2008) found that team empowerment is composed of three factors: meaning-competence, self-determination, and impact. Results showed that there is positive correlation between meaning-competence and job performance (r= .555, p=.01); between self-determination and job performance (r= .380, p=.01) and between impact and job performance (r= .211, p=.01).
The third theoretical approach that emerges from the studies included in the present meta-analysis is Porter and Lawler (1968)‟s. According to Porter et al. (1968), the measure of output rates, performance appraisal of employees by managers, and employees‟ self-appraisal of their performance are the three indicators of performance. Especially, the performance self-appraisal techniques were found to be beneficial for employees because these techniques encourage employees to take responsibility by letting them to set their own goals.
3. Meta-analysis as a research methodology
Meta-analysis is a statistical method to integrate or aggregate the findings from individual research studies. A high quality meta-analysis is based on the quality of systematic literature review with the coverage of all relevant published and unpublished studies.
Meta-analysis presents a rational and helpful way of dealing with a number of practical difficulties that in normal circumstances we meet to get sense out of diverse findings of multiple studies. Meta-analysis as a research method provides researcher the chance to reach a general conclusion from a variety of related research papers. Meta-analysis has become an important research
6
methodology in recent years, as statistical analysis seemed necessary to form the meaning out of hundreds of research results.
The “Meta-analysis” term was first introduced by Glass in April 1976 in the American Association for Educational Research Journal. However, Rosenthal (1963) had made important contributions to quantitative reviews before Glass (1976). Rosenthal in early 1960s began comparing and combining results of studies dealing with experimenter expectancies. In 1976, the year in which Glass‟s meta-analysis appeared, Rosenthal had already published a landmark synthesis of findings from 311 studies of interpersonal expectancies. Consistent with Glass (1976)‟s suggestions, the effect size values became an alternative way to interpret the findings from diverse studies in a cumulative way. Tebala (2015) claims that the annual rate of publication of new meta-analysis and systematic reviews is growing exponentially since 2004s: there are now over 10,000 meta-analysis published every year, which is double the number that appeared in 2004s. As a result, meta-analytic studies are popular nowadays because this method provides overall understanding about the size of effect among the variables and to count and combine possibilities (Koricheva & Gurevitch, 2016).
Even if the discourse of meta-analysis is getting also prevalent in the academic arena in Turkey, as IĢık (2014) claimed that there are not many meta-analysis published in Turkey. According to literature search dated January 9, 2014, only twenty-nine published meta-analysis in Turkey emerges in ULAKBİM Social Science Database that match the “meta-analysis” keyword. According to this research, twelve research papers from twenty-nine meta-analysis examines individual studies‟ effect sizes on related topic and two research papers are just about the techniques of meta-analysis. As reported by this article, this is a major drawback in the field of organizational psychology, because there is no information to aggregate the effect sizes of research done in Turkey (IĢık, 2014).
4. Aim of the present study
Job performance and job satisfaction are two major employee behavior and attitude that organizational psychology explores because both have effect on productivity, efficiency of organization itself, and relationship among employees.
7
Even if meta-analytic research on relationship between job satisfaction and performance is available in international literature, no research was identified in Turkey. Therefore, the present study aims to conduct a meta-analytic research on the relationship between job satisfaction and job performance by targeting the empirical research done in Turkey.
Specifically, the present study will examine previous studies‟ reported correlation between job satisfaction and job performance and aggregate the results by meta-analysis. The hypothesis of the present study is that job satisfaction will have a positive relationship with job performance.
SECTION II – METHOD 1. Literature Search and Inclusion Criteria
Published journal articles, and unpublished master and doctorate thesis conducted in Turkey were included in this research. Basic criterion of this study was to include the studies with the samples from Turkey. Therefore, international studies were not included. My thesis includes research papers that were published between 2006 and 2015. This meta-analytic study has been completed in more than two years which started in 2015.
As the present study is a meta-analysis conducted within the scope of Turkey, relevant sources for this study were ULAKBĠM Social Sciences Databases of TUBITAK (The Scientific and Technological Research Council of Turkey), Council of Higher Education Thesis Center, and Google Academic. The search of these databases was on the period from 25.03.2014 to 26.04.2016.
Initial literature review was solely on “job performance” and its determinants at psychological, individual, and organizational levels. 104 studies were found on the relationship of job performance with various variables like job satisfaction, organizational commitment, leadership style, reward, conflict management, stress, mobbing, job safety and roles, human resources management, training opportunities, organizational culture, behaviour, justice responsibility and support. Table 1 presents the distribution of the studies according to their constructs that they focus on in connection with job performance.
8 Table 1
Results from Initial Literature Review and Distribution of Studies according to the Constructs Focused in Relation to Job Performance
Major constructs focused in relation to job performance Total number of studies (k=104) Job Satisfaction 43 Organizational commitment 12 Leadership 6 Physical conditions 6 Reward 6 Conflict management 5 Career management 5 Stress 4 Job safety 3 Mobbing 3 Organizational responsibility 3
Human resources factor 2
Training opportunities 1
Organizational culture 1
Organizational behaviour 1
Organizational justice 1
Organizational support 1
Job role ambiguity 1
Among these construct, the most frequent one was “job satisfaction” so that the focus of this meta-analysis was decided to be on this issue (k=43) in connection to job performance. In the second phase of literature review, I scanned these 43 studies to find direct correlations between job satisfaction and job performance. I excluded other 27 research papers that were not quantitative research or did not report sufficient information for calculation of effect size. Beside, 10 studies had moderator variables and they did not report the direct correlation between job satisfaction and performance so that these did not match inclusion criteria either. The most important inclusion criteria of this meta-analysis is the sampling which must solely include organizations in Turkey because the main purpose of this study is to reveal the level of relationship between job satisfaction and job performance in Turkey. Therefore, those studies that do not have samples from Turkey were excluded. Moreover, studies that were
9
operationalizing the job performance at individual level and measuring it via self-evaluation were included. Therefore, if the studies were reporting organizational performance measures or if the performance evaluation measures were from a third party like managers, co-workers or customers, these studies were considered out of scope for the present meta-analysis. An example to this is Gürbüz et al. (2008)‟s research. The correlation between job satisfaction and job performance was very strong (r=.732) compared to other studies and when we elaborated it we recognized that job satisfaction and job performance measures were administered to managers to evaluate their employees. Of course, this creates a remarkable impact in terms of consistency between the perceptions of two different constructs.
In sum, we obtained fourteen studies and Table 2 shows the final 14 studies included in the meta-analysis, type of publication and their sources.
10 Table 2
List of 14 Studies Included in the Meta-Analysis and Their Sources
Authors Type of
Publication Journal/Institution Year Database CEYLAN, A. & ULUTURK, Y.H. Article DoğuĢ Üniversitesi Dergisi 2006 ULAKBIM ALTAġ, A. & ÇEKMECELIOĞLU,
H.G. Article Öneri Dergisi 2007 Google Academics
GÜL, H., OKTAY, E., & GÖKÇE, H. Article Akademik BakıĢ 2008 ULAKBIM
GÜL, H. & OKTAY, E. Article Selçuk Üniversitesi Sosyal
Bilimler Dergisi 2009 ULAKBIM
KOÇ, H., YAZICIOĞLU, Ġ., &
HATIPOĞLU, H. Article
Ondokuz Mayıs Üniversitesi
Eğitim Fakültesi Dergisi 2009 ULAKBIM
YAZICIOĞLU, Ġ. Article Bilig Türk Dünyası Sosyal
Bilimler Dergisi 2010 Google Academics
GÜRBÜZ, S., ERKUġ, A., & SIĞRI,
Ü. Article Sosyal ve BeĢeri Bilimler Dergisi 2010 Google Academics
AKKOÇ, Ġ., ÇALIġKAN , A., &
TURUNÇ, O. Article Yönetim ve Ekonomi Dergisi 2012 Google Academics
CAPKULAÇ, O. Master Thesis
Akdeniz Üniversitesi Sosyal Bilimler Enstitüsü, ĠĢletme Ana
Bilim Dalı
2013 National Thesis Center
KAHYA, C. Article Küresel Ġktisat ve ĠĢletme
11 Table 2 (continued)
List of 14 Studies Included in the Meta-Analysis and Their Sources
Authors Type of
Publication Journal/Institution Year Database ERKUġ, A. & FINDIKLI, M. Article Istanbul Üniversitesi ĠĢletme Fakültesi Dergisi 2013 ULAKBIM
KALKAVAN, S. Doctorate Thesis Aydın Üniversitesi Sosyal Bilimler
Enstitüsü, ĠĢletme Ana Bilim Dalı 2014 National Thesis Center
KALE, E. Article International Journal of Economic
and Administrative Studies 2015 ULAKBIM
SÖKMEN, A. & METE S. E. Article Ġktisadi ve Ġdari Bilimler Fakültesi
12 2. Coding Procedures
Current thesis author and the advisor coded the studies that met the inclusion criteria. Pearson Correlation Coefficient (“r”) between job performance and job satisfaction was the main effect size measure. Rosenthal and Rosnow (2009) indicated that the “r” coefficient is ideal in the situations where researchers want to see direct relationship between two variables. In addition, they claimed that correlation coefficient is a statistical way to quantify the relationship between two variables; it is easy to work out, and to interpret.
The reported correlations and their levels (Table 3) were interpreted according to Cohen (1988)‟s criteria as reported by IĢık (2014).
Table 3
Pearson Correlation Coefficient “r” as Effect Size Index and its Interpretation (Cohen, 1988) Effect size r Very large .70 + Large .50 Medium .30 Small .10
Table is redesigned from IĢık (2014)‟s review.
3. Meta-Analytic Procedures
We used Comprehensive Meta-Analysis Software Program (v3) to calculate the combined correlations from the fourteen identified studies. This software both allows the estimation for amount of variation attributable to sampling error and artifacts such as untrustworthy data in both the predictor (job satisfaction) and criterion (job performance of employees) variables. It also presents the best estimates of correlations in the lack of measurement error (Wallace, Schmid, Lau, & Trikalnos, 2009).
Addressing statistical heterogeneity is one of the most troublesome aspects of many systematic reviews. The interpretative problems depend on how
13
substantial the heterogeneity is, since this determines the conclusions from
meta-analysis. The statistical values; Q-value and I-squared are used for determining
the statistical heterogeneity. Q-value concentrates on the dissimilarity between the individual studies‟ treatment effects and the common effect. I-squared is for measuring heterogeneity and investigates how much heterogeneity is present (Thompson, 1994). The range of I-squared is between 0% and 100% and it reveals the percentage of total variation across studies arising from heterogeneity (Israel & Richter, 2011). Some researchers suggested a distinction like 25% equals to low heterogeneity, 50% equals to medium heterogeneity, and 75% equals to high heterogeneity (Higgins, Thompson, Deeks, & Altman, 2003). In the case of heterogeneity, meta-analysis has to be based on random model instead of fixed model, which is most of the time the case for social science research where there is high variation across the reported relationships between two or more research construct. Therefore, in the present meta-analysis, level of heterogeneity among the reported correlation coefficients in 14 studies were first tested and the decision to either use fixed or random model based on this.
SECTION III – RESULTS
As the previous section summarized, the main purpose of the current study is to conduct a meta-analysis on the 14 studies that matched the inclusion criteria and to reach a conclusion about the overall relationship between job satisfaction and job performance. This section will summarize each study included in the analysis and will report the results of meta-analysis.
1. Sampling characteristics of the studies included in meta-analysis Table 4 comprises sample characteristics of the studies included in meta-analysis (k=14; N=4070).
14 Table 4
The Sample Characteristics of 14 Studies Included in the Meta-Analysis
Authors Year Sample Size Sector City Target Group
CEYLAN, A. &
ULUTURK, Y.H. 2006 151 Various sectors
Various cities in Turkey
Employees in private or public sector (no additional information about sample)
ALTAġ, A. &
ÇEKMECELIOĞLU, H.G.
2007 391 Automotive Sakarya &
Koçaeli
Employees from 16 middle and large scale manufacturing organization (sample has not been specified as white/blue collar)
GÜL, H. & OKTAY, E.
& GÖKÇE, H. 2008 120 Health services Tokat
State hospital healthcare employees in one public hospital
GÜL, H & OKTAY, E. 2009 116 Municipality Karaman Public (state) employees
KOÇ, H. &
YAZICIOĞLU, Ġ. & HATIPOĞLU, H.
2009 432 Education Ordu
Teachers in private or public sector (pre-school, elementary, high school, and public continuous education center teachers)
YAZICIOĞLU, Ġ. 2010 1042 Education Istanbul,
Ankara,& Ġzmir
Teachers in private or public sector (pre-school, elementary, high school, and public continuous education center teachers)
15 Table 4 (continued)
The Sample Characteristics of 14 Studies Included in the Meta-Analysis
Authors Year Sample Size Sector City Target Group
GÜRBÜZ, S. &
ERKUġ, A. & SIĞRI, Ü. 2010 112
Information
Technology (IT) Ankara
White collar employees in three IT companies AKKOÇ, Ġ. & ÇALIġKAN , A. & TURUNÇ, O. 2012 348 Software development Ankara
White collar employees in multiple software companies (number of companies are not reported)
CAPKULAÇ, O. 2013 178 Tourism/Hotel Antalya White collar managers
KAHYA, C. 2013 105 Education Bayburt &
Trabzon Academicians in the state universities ERKUġ, A. &
FINDIKLI, M.A. 2013 572 Various sectors
Various cities in Turkey
Police, doctors, nurses, academicians, teachers and laboratory employees
KALKAVAN, S. 2014 229 Insurance Various cities in
Turkey White collar employees
KALE, E. 2015 176 Tourism/Hotel Kapadokya &
Nevsehir White collar employees SÖKMEN, A. & METE
S. E. 2015 98 Health services Ankara
Healthcare and administrative employees in a private hospital
16
If we review Table 4 in a more systematic way, sample sizes range from minimum 98 to maximum 1042. Table 5, shows that the most frequent range is between 100 and 200 (n=7). Large sample studies with more than 400 are less frequent.
Table 5
Distribution of 14 Studies according to Their Sample Sizes Sample size ranges Frequency of the studies
98-105 2
112-229 7
348-391 3
432-572 1
1042 1
Most frequent sectors are education (n=3), health services, tourism/hotel, and the combination of various sectors (n=2 for each) (Table 6).
Table 6
Distribution of 14 studies according to Sectors of Their Samples
Sectors Frequency of the
studies Education 3 Health services 2 Tourism/Hotel 2 Various sectors 2 Automotive 1
Information Technology (IT) 1
Insurance 1
Municipality 1
Software development 1
As Table 7 shows studies most frequently are working with the white-collar employees (n=4). However, majority of the published journal articles do not elaborate the sample characteristics, which is a critical drawback to compare and
17 Table 7
Distribution of 14 Studies according to Their Targeted Samples
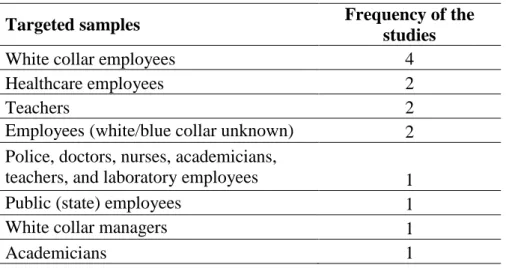
Table 8 elaborates the demographic characteristics of the samples in 14 studies included in the meta-analysis. As the Table 8 depicts the samples of 14 studies had the mean age of 33.3 (SD=5.96) ranging between 26 and 43 years. According to the samples‟ sex distribution, we see that mean ratio of males is 60.7% (SD=15.25; min.=35%, max.=81%) and ratio of females is 39.3% (SD=15.13; min.=19%, max.=65%). The coding procedure covered the proportion of participants who have university and higher education as the Table 8 shows. The distribution of participants with university and higher education had the range between 17% and 100% with the mean of 64.6% (SD=28.56). Of course, consistent with this, the proportion of participants with education lower than university degree ranges between 0% and 83% (M=35.4%; SD=28.56).
Targeted samples Frequency of the
studies
White collar employees 4
Healthcare employees 2
Teachers 2
Employees (white/blue collar unknown) 2 Police, doctors, nurses, academicians,
teachers, and laboratory employees 1
Public (state) employees 1
White collar managers 1
18 Table 8
Demographic Characteristics of the Samples in the 14 Studies Included in the Meta-Analysis
Authors Year Return rate (%) Mean Age
(SD) Sex (%) Education (%)
CEYLAN, A. &
ULUTURK, Y.H. 2006 98%
No information about mean age
No information about frequencies No information about frequencies ALTAġ, A. & ÇEKMECELIOĞLU, H.G. 2007 100% No information
about mean age
73% male- 58% university and higher education 27% female
GÜL, H. & OKTAY,
E.& GÖKÇE, H. 2008 68%
No information about mean age
No information about frequencies No information about frequencies GÜL, H & OKTAY, E. 2009 78% 43 (SD=.92)
74% male 38% university and higher education 26% female
KOÇ, H. & YAZICIOĞLU, Ġ &
HATIPOĞLU, H.
2009 74% 32 (SD=.56) 61% male 100% university and
higher education 39% female YAZICIOĞLU, Ġ 2010 92% 26 (SD= .89) 58% male 100% university and higher education 42% female GÜRBÜZ, S. & ERKUġ, A. & SIĞRI, Ü. 2010 No information about return rate
No information about mean age
81% male
41% university and higher education 19% female
AKKOÇ, Ġ., ÇALIġKAN , A., &
TURUNÇ, O.
2012 85% No information
about mean age
67% male 62% university and higher education 33% female
19 Table 8 (continued)
Demographic Characteristics of the Samples in the 14 Studies Included in the Meta-Analysis
Authors Year Return rate (%) Mean Age
(SD) Sex (%) Education (%) ÇAPKULAÇ, O. 2013 82% 34 (SD= 1.13) 70% male 64% university and higher education 30% female KAHYA, C. 2013 56% 29 (SD= .78) 68% male 100% university and higher education 32% female ERKUġ, A. & FINDIKLI,M.A. 2013
No information about return rate
No information about mean age
No information about frequencies No information about frequencies KALKAVAN, S. 2014 67% 32 (SD= 1.35)
46% male 66% university and higher education 54% female
KALE, E. 2015 72% No information
about mean age
65% male
17% university and higher education 35% female
SÖKMEN, A & METE S. E. 2015
No information
about return rate 27 (SD= .95) 43% male
No information about frequencies 57% female
20
2. Measurement tools used by the studies included in meta-analysis Table 9 summarizes the job satisfaction and job performance scales utilized as data collection tool and this section shortly describes them.
2.1. Job Satisfaction scales used by the fourteen studies of present meta-analysis
All of job satisfaction scales used by the studies included in the present meta-analysis was gathered by searching the papers cited them, and communicating with researchers who conducted these studies in Turkey. These tools in Turkish and English are available in Appendices.
2.1.1. Minnesota Job Satisfaction Scale by Weiss, Dawis, England, and Lofquist (1967)
Weiss, Dawis, England, and Lofquist (1967) created short and long form versions of Minnesota Job Satisfaction Scale (MSQ). Long form consists of 100 items and each item is related to a reinforcer in the work environment. On the other hand, short form consists of 20 items. Short version of this scale was translated to Turkish. English and Turkish versions of MSQ has five points scale and English version is categorized as „very satisfied, satisfied, neutral, dissatisfied and very dissatisfied‟. The items of scales are about participation to decision-making process, the chance to do things for other people, pay, the working conditions, the feeling of accomplishment, and company policies (Appendix A). Among the studies included in the present meta-analysis, Ceylan and Ulutürk (2006) and Gül, Oktay, and Gökçe (2008) used MSQ.
2.1.2. Index of Job Satisfaction by Brayfield, and Rothe (1951)
Brayfield and Rothe (1951) developed a global job satisfaction scale named as Index of Job Satisfaction. Purpose of this scale is providing global appraisal of job satisfaction, which is applicable to various occupations. This scale includes 18 items. Gürbüz, ErkuĢ, and Sığrı (2010), and Kahya (2013) used five items. The items of this scale are about working with enthusiasm and willingness,
getting tired of doing work, finding the job fun, and satisfying from job itself
(Appendix B). This scale was translated to Turkish by Gürbüz et al. (2010) and Kahya (2013).
21
2.1.3. Job Satisfaction scale by Bakan and Büyükbeşe (2004)
Bakan and BüyükbeĢe (2004) conducted a study that on relationship between organizational communication and job satisfaction among academicians. They developed their own scale to measure job satisfaction. This scale contains 23 items. English and Turkish versions have five points scale between strongly agree and strongly disagree. The items of this scale are about the issues as follow: communication of problems to management team; good communication between employee and peers; job fit to qualifications of employees; justice in respect of career upgrading and pay; and management support for employees‟ career path and personal development (Appendix C). Koç, Yazıcıoğlu, and Hatipoğlu (2009), and Yazıcıoğlu (2010) used this scale.
2.1.4. Job Satisfaction scale by Babin and Boles (1996)
Babin and Boles (1996) used a scale of nine items with English and Turkish version have five point scale; strongly agree, agree, neutral, disagree, and strongly disagree in their research on the relationship between supervisory support and job satisfaction of employees. The items of this scale are about whether the job is boring, unpleasant, uninteresting, and disappointing for employee. Majority of the items‟ discourse was more on dissatisfaction than satisfaction (Appendix D). ErkuĢ et al. (2013) used three items of this scale as Kale (2015) used six items. ErkuĢ et al. (2013) translated this scale to Turkish and Kale (2015) revised later.
2.1.5. Job Satisfaction scale by Hackman and Oldham (1974)
Hackman and Oldham (1974)‟s research was on the relationship between job redesign, job characteristics, and job satisfaction. This scale includes 14 items and Turkish version of this scale has five points scale. The original version of this scale has seven points scale; strongly agree, agree, slightly agree, neutral, slightly disagree, disagree, and strongly disagree. The items of this scale are about pay, career path in working life, personal development, harmony with peers in workplace, employee-employer relationship, future expectations, and attitude of managers (Appendix E). Gül et al. (2009) translated to Turkish and used this scale in their research.
22
2.1.6. Job Satisfaction scale by Arnett (1999) / Judge, Woolf, and Hurst (2009)
Arnett (1999) conducted a study on how stress affects job satisfaction among white-collar employees and developed a job satisfaction scale to reveal the relationship between stress and job satisfaction. Besides, Judge, Woolf, and Hurst (2009) evaluated and reshaped Arnett (1999)‟s scale and conducted a study relationship between emotional labor and job satisfaction. Scale of Judge et al. (2009) includes five items with five points scale; strongly agree, agree, neither, disagree, and strongly disagree. English and Turkish version have five-point scale. The items of this scale are about whether the job is satisfying, enthusiastic, or boring for employees (Appendix F). Akkoç, ÇalıĢkan, and Turunç (2012) translated this scale to Turkish and used two items out of five in their study.
2.1.7. Job Satisfaction scale by Lytle (1994) / Kim, Leong, and Lee (2005) Kim, Leong, and Lee (2005) conducted a study to reveal how service orientation affects job satisfaction, organizational commitment, and intention of leaving among waiters who works in restaurants. Kim et al. (2005) reshaped job satisfaction scale of Lytle (1994). Turkish version of this scale includes six items with five points scale. The items of this scale are about whether related job is pleasant and satisfying for employee (Appendix G). Çapkulaç (2013) translated to Turkish.
2.1.8. Job Satisfaction scale by Cammann, Fichman, Jenkin, and Klesh (1983)
Cammann, Fichman, Jenkin, and Klesh (1983) conducted a study on the relationship between organizational commitment and job satisfaction among medical doctors. This scale includes three items and English and Turkish version have five points scale. English version is categorized as strongly agree, agree, neither, disagree, and strongly disagree. The items of this scale are about whether related job is satisfying for employees and items investigate whether employees like their job (Appendix H). Kalkavan (2014) translated to Turkish and used this scale.
23
2.1.9. Job Satisfaction scale by Miller and Medalia (1955)
Miller and Medalia (1955)‟s research is related to the relationship between leadership and job satisfaction among military organizations. This scale includes five items and English and Turkish version have five points scale. English version is categorized as strongly agree, agree, neither, disagree, and strongly disagree. The items of this scale are about whether related job is beneficial for employee and whether related job is correct choice for career of employee (Appendix I). Sökmen et al. (2015) translated to Turkish and used this scale.
2.1.10. Job satisfaction scale by Rusbult, Farrell, Rogers, and Mainous (1988)
Rusbult, Farrell, Rogers, and Mainous (1988)‟s study is related to employee loyalty to organization and job satisfaction. This scale includes five items with five points scale; as strongly agree, agree, neither, disagree, and strongly disagree. The items of this scale are about whether wage is adequate and satisfactory (Appendix J).
3.1.Job Performance scales used by the fourteen studies of present meta-analysis
The job performance scales of fourteen studies of present meta-analysis, which were gathered by searching the literature and communicating with the researchers who conducted these studies in Turkey are summarized again in Table 9 and in the following sub-sections.
3.1.1. Job performance scale by Kirkman, and Rosen (1999) and Sigler, and Pearson (2000)
Kirkman et al. (1999) developed a job performance scale and Sigler et al. (2000) Redesigned. English version has seven items; strongly disagree, moderate disagree, slightly disagree, neutral, slightly agree, moderate agree, and strongly agree. Turkish version has five point scales. The items of this scale are about the general evaluation of completing the tasks on time, attaining the job related objectives and quality standards, solving problems quickly (Appendix K). This scale is the most frequently used job performance survey among the studies included in the current meta-analysis. Çöl (2008) translated Kirkman et al. (1999)
24
and Sigler et al. (2000)‟s job performance scale to Turkish. AltaĢ et al. (2007), Gül et al. (2008), Gül et al. (2009), Koç et al. (2009), Gürbüz et al. (2009), Yazıcıoğlu (2010), Akkoç et al. (2012), and Kahya (2013) which are among the studies included in the present meta-analysis used this scale to collect data on employee performance
3.1.2. Job performance scale by Gürkanlar (2010)
Gürkanlar (2010) searched the relationship between working hours, balance between job and family and the aspects of job performance among academicians and administrative employees in the universities. Gürkanlar (2010) developed 11 item surveys with five points scale ranging as inadequate, need to develop, adequate, good, and excellent. The items of this scale are about planning of job itself, performance of verbal and written communication, sustainability of job quality and quantity, and getting on well with other employees (Appendix L). Çapkulaç (2013) as one of the publication included in the present meta-analysis used this scale. .
3.1.3. Job performance scale by Porter, and Lawler (1968)
Porter and Lawler (1968) investigated the relation between organizational structure, job attitudes and job behavior. Porter et al. (1968)‟s job performance scale with five items with five points scale ranging from inadequate, need to develop, adequate, good, and to excellent are about getting on well with other people in workplace, ability to finish their work, and attaining job goals on time (Appendix M). Kalkavan (2014) translated this scale to Turkish.
3.1.4. Job performance scale by Bush, Ortinau, and Hair (1990)
Bush, Ortinau, and Hair (1990) evaluated retail salesperson‟s performance with three-item survey. Five point scale ranges from strongly agree to strongly disagree. The items of this scale are about completing the tasks in a short time and time management skills (Appendix N). This scale‟s translation to Turkish was done by ErkuĢ et. al. (2013).
3.1.5. Job Performance scale of Sökmen and Mete (2015)
Sökmen and Mete (2015)‟s research is about harassment, intention to leave, and job satisfaction. Sökmen et al. (2015) developed six item surveys with
25
five points scale ranging as strongly agree, agree, neutral, disagree, and strongly disagree. The items of this scale are about showing effort more than expected and learning and adaptation capability (Appendix O). Sökmen et al. (2015) from the present meta-analysis used this scale.
3.1.6. Job Performance scale of Choo (1986)
Choo (1986)‟s focus was on harassment, intention to leave, and job satisfaction. Choo (1986) developed nine items surveys with five points scale ranging as strongly agree, agree, neutral, disagree, and strongly disagree. The items of this scale are about quantity and quality of product or service, adaptation to new situations, professional capabilities, implementation and coordination abilities and ability to get on with other employees (Appendix P). We see this scale in Ceylan et al. (2006)‟s which is one of the publications in the present meta-analysis.
26 Table 9
Measurement Instruments, Tools, and Scales of the 14 Studies Included in the Meta-Analysis
Authors Year
SCALES
Job satisfaction measures and developers Job performance measures Job satisfaction measure' translation to Turkish Job performanace measures' translation to Turkish CEYLAN, A. & ULUTURK, Y.H. 2006
Minnesota Job Satisfaction
Scale by Weiss et al. (1967) Choo (1986) Turkish MSQ Form Ceylan et al. (2006) ALTAġ, A. &
ÇEKMECELIOĞLU, H.G.
2007 Rusbult,Farrell,Rogers & Mainous (1988)
Kirkman & Rosen (1999)
/ Sigler & Pearson (2000) Altas et al. (2007) Çöl (2008) GÜL, H. & OKTAY, E.
& GÖKÇE, H. 2008
Minnesota Job Satisfaction Scale by Weiss et al. (1967)
Kirkman & Rosen (1999)
/ Sigler & Pearson (2000) Turkish MSQ Form Çöl (2008)
GÜL, H. & OKTAY, E. 2009 Hackman & Oldham (1974) Kirkman & Rosen (1999)
/ Sigler & Pearson (2000) Gül et al. (2009) Çöl (2008) KOÇ, H. &
YAZICIOĞLU, Ġ. & HATIPOĞLU, H.
2009 Bakan & BüyükbeĢe (2004) Çöl (2008) Bakan & BüyükbeĢe
(2004) Çöl (2008)
YAZICIOĞLU, Ġ. 2010 Bakan & BüyükbeĢe (2004) Çöl (2008) Bakan & BüyükbeĢe
27 Table 9 (continued)
Measurement Instruments, Tools, and Scales of the 14 Studies Included in the Meta-Analysis
Authors Year
SCALES
Job satisfaction measures and
developers Job performance measures
Job satisfaction measures' translation to Turkish Job performanace measures' translation to Turkish GÜRBÜZ, S. & ERKUġ,
A. & SIĞRI, Ü. 2010 Brayfield & Rothe (1951)
Kirkman & Rosen (1999) /
Sigler & Pearson (2000) Gürbüz et al. (2010) Çöl (2008) AKKOÇ, Ġ. &
ÇALIġKAN , A. & TURUNÇ, O.
2012
Arnett (1999) / Judge, Woolf, & Hurst (2009) /Chen,Ku,Shyr, & Chou (2009)
Kirkman & Rosen (1999)
Akkoç et al. (2012) Çöl (2008) Sigler & Pearson (2000)
ÇAPKULAÇ, O. 2013 Lytle (1994) / Kim, Leong, and
Lee (2005) Gürkanlar (2010) Çapkulaç (2013) Gürkanlar (2010)
KAHYA, C. 2013 Brayfield & Rothe (1951) Kirkman & Rosen (1999) /
Sigler & Pearson (2004) Kahya (2013) Çöl (2008) ERKUġ, A & FINDIKLI,
M.A. 2013 Babin & Boles (1996) Bush, Ortinau & Hair (1990) ErkuĢ et al. (2013) ErkuĢ et al. (2013) KALKAVAN, S. 2014 Cammann, Fichman, Jenkin, &
Klesh, 1983) Porter –Lawler (1968) Kalkavan (2014) Kalkavan (2014)
EMINE, K. 2015 Babin & Boles (1996) Kirkman & Rosen (1999) /
Sigler & Pearson (2000) Kale (2015) Çöl (2008) SÖKMEN, A. & METE,
28
If we review Table 9 systematically, job satisfaction scale of Brayfield and Rothe (1951), Bakan and BüyükbeĢe (2004), and Minnesota Job Satisfaction scale by Weiss et al. (1967) were the most frequently used tools by the studies included in the present meta-analysis. Tablo 10 present the summary descriptives of job satisfaction tools.
Table 10
Distribution of 14 Studies according to Scales Used to Measure Job Satisfaction
Job Satisfaction Scales Frequency of the
studies Minnesota Job Satisfaction Scale by Weiss et
al. (1967) 2
Bakan & BüyükbeĢe (2004) 2
Babin & Boles (1996) 2
Brayfield & Rothe (1951) 2
Arnett (1999) / Judge, Woolf, & Hurst
(2009) /Chen, Ku, Shyr, & Chou (2009) 1 Lytle (1994) / Kim, Leong, & Lee (2005) 1 Cammann, Fichman, Jenkin, & Klesh (1983) 1
Miller & Medalia (1955) 1
Hackman & Oldham (1974) 1
Rusbult, Farrell, Rogers, & Mainous (1988) 1
Moreover, as Table 11 shows we see that job performance scale of Kirkman and Rosen (1999) was the most prevalently used tool (k=7 studies).
Table 11
Distribution of 14 Studies according to Scales Used to Measure Job Performance
Job Performance Scales Frequency of the
studies Kirkman & Rosen (1999) / Sigler &
Pearson (2000) 7 Çöl (2008) 3 Gürkanlar (2010) 1 Porter-Lawler (1968) 1 Sökmen et al. (2015) 1 Choo (1986) 1
29
4. Summary of the studies included in the meta-analysis
Studies in this meta-analysis can be categorized in terms of which organizational settings the data collection was realized in. During the process of meta-analysis, I have noticed that type of organizations as private vs. public was noticeable differentiation to categorize the designated studies of the current meta-analysis. In this section, 14 studies will be summarized by being grouped under these major categories.
4.1. Studies with the private sector employee samples
This section includes six studies which have samples of private sector employees. These studies are AltaĢ et al. (2007)‟s article and Gürbüz, ErkuĢ, and Sıgrı (2010)‟s article, Akkoç et al. (2012)‟s article, Çapkulaç (2013)‟s master thesis, Kalkavan (2014)‟s doctorate thesis, and Kale (2015)‟s article.
4.1.1. Altaş and Çekmecelioğlu (2007)’s research on relationship among job satisfaction, organizational commitment, and job performance
The sample included 391 white-collar employees who work in automotive industry located in Sakarya. Job satisfaction scale by Rusbult, Farrell, Rogers, and Mainous (1988) and job performance scale of Kirkman and Rosen (1999) was used in this study.
a) Major findings by Altaş et al. (2007)
Organizational commitment has statistically significant and strong positive correlation with job performance. In addition, there is significant correlation between organizational commitment and organizational citizenship behavior. There is statistically significant positive correlation between job satisfaction and job performance. The results further revealed that organizational citizenship behaviors mediate the effects of job satisfaction on job performance.
b) Result to be included in the current meta-analysis from Altaş et al. (2007)
The correlation between job satisfaction and job performance is .399 (p=.00). According to Cohen (1988), there is medium to large correlation between job performance and job satisfaction.