(2019) 43: 109 – 115 © TÜBİTAK
doi:10.3906/fiz-1809-25 h t t p : / / j o u r n a l s . t u b i t a k . g o v . t r / p h y s i c s /
Research Article
Effect of Al doping on the magnetic and elastic properties of Fe
65Ni
35Invar alloys
Aslı ÇAKIR∗,Department of Metallurgical and Materials Engineering, Faculty of Engineering, Muğla Sıtkı Koçman University, Muğla, Turkey
Received: 26.09.2018 • Accepted/Published Online: 24.01.2019 • Final Version: 22.02.2019
Abstract: Invar alloys have great importance due to their low thermal expansion coefficient. The effect of Al doping
on Fe65Ni35 Invar alloy was investigated by temperature-dependent magnetization and elastic modulus measurements.
First, 0.44 at% and 2.24 at% of Al were substituted for Ni. Then X-ray diffraction measurements, Rietveld refinements, and scanning electron microscopy studies were performed to understand the effect of Al-doping on the face-centered cubic structure. The elastic modulus of Fe65Ni35 and the Al-doped samples were measured in the temperature range
300 ≤ T ≤ 870 K using impulse excitation. The temperature dependence of magnetization and elastic modulus results
for the Al-doped Invar alloys were compared with those of nondoped Invar alloy. Al doping to Fe65Ni35 Invar alloy led
to volume shrinkage and decreasing Curie temperature as seen in the effect of hydrostatic pressure application.
Key words: Invar alloy, elastic modulus, magnetization, structural characterization
1. Introduction
Since its discovery in 1896 by Guillaume [1], the Invar effect has been investigated intensively due to the property of the almost vanishing thermal expansion coefficient. With this property, Invar alloys are utilized in areas where high dimensional stability and precise positioning are required [2]. The Invar anomaly, especially in fcc Fe–Ni alloys with a Ni concentration close to the martensitic transition line, is not only restricted to a low thermal expansion coefficient but is also experienced as other physical effects, such as positive or zero values of the temperature coefficients of elastic modulus, large positive spontaneous magnetostriction, and significant decrease in the temperature of magnetic ordering and magnetization under the action of pressure. The Invar effect can be understood in terms of spontaneous volume magnetostriction. Above the Curie temperature (Tc) , an Invar alloy behaves like a normal metallic material, while it shows the Invar anomaly starting at
temperatures somewhat above Tc down to low temperatures. The large negative volume magnetostriction below
Tc counteracts the normal thermal shrinkage, leading to low thermal expansion. The volume magnetostriction
in the Invar alloy is the result of the high-spin to low-spin transition. The low-spin state lies energetically lower and has a smaller equilibrium volume than the high-spin state. In a common material, the volume increases with increasing temperature. However, in an Invar alloy, the normal volume expansion on increasing temperature is counteracted by the volume contraction caused by the high-spin to low-spin transition and so the volume change is almost zero [3,4].
In addition to temperature-dependent features, the Invar effect can also be observed as features in pressure and composition dependencies [5–9]. Applying pressure up to a finite temperature to an Invar alloy also gives ∗Correspondence: [email protected]
109
rise to transition from the high-spin state to the low-spin state [8,10,11]. Similarly, varying the composition, such as by decreasing the Ni content, leads to a change in the HS/LS ground-state energy levels, so that after a critical Ni content the material exhibits anti-Invar properties [12,13]. The effect of doping some elements has also been investigated for Invar properties [14–16]. Our previous work on elastic modulus properties shows that doping the Invar alloy with Si leads to the occurrence of an additional hexagonal structure next to the face-centered cubic and a decrease in Tc [17]. Si doping to an Invar alloy has similarities to applying hydrostatic
pressure.
In this work, Al-doped Fe–Ni alloys were investigated for their structural, elastic, and magnetic properties. The magnetic properties of this mixed main group/transition element system are particularly investigated in relation to their systematic behavior with respect to the valence electron concentration e/a. The results are compared with those of the nondoped Fe65Ni35 and Si-doped Invar alloys. Al doping will provide the advantage of being a lightweight material and ductile, in addition to giving rise to high corrosion resistance and good electrical and thermal conductivity properties for application areas of Invar alloy within the form of Fe–Al intermetallic [18].
2. Experimental
We produced Fe65Ni35−xAlx alloys with x = 0, 0.44, and 2.24 at% in an arc furnace using high purity elements
(99.9%). The samples were homogenized under Ar at 1073 K in sealed quartz tubes for 5 days and were quenched in water. The homogeneity of the samples was checked with energy dispersive X-ray (EDX) analysis, and was found to be homogeneous within 0.05 at% for all samples (Table 1). X-ray diffraction (XRD) measurements were carried out in the 2θ range 20° ≤ 2θ ≤ 100° using a Cu Kα X-ray source with a PANalytical X’Pert Pro
diffractometer. Scanning electron microscopy (SEM) images were obtained on polished and etched surfaces. Magnetization measurements were made using a superconducting quantum interference device magnetometer equipped with an oven attachment. For the elastic modulus (E-mod) measurements, the impulse excitation technique (IET) was used [19]. IET uses the decay of the vibration amplitude of an impulse excited resonant frequency to determine the internal friction of the induced vibration signal, and gives the calculated damping, shear modulus, and E-mod of a sample.
Table 1. Compositions determined by EDX of the nominal Fe65Ni35−xAlx series with less than 0.1% EDX absolute
accuracy. Corresponding valence electron concentrations (e/a), average magnetic moment (µ), and Curie temperatures (Tc) .
Fe Ni Al (x) e/a µ Tc
(at%) (at%) (at%) - µB (K)
65 35 0 8.70 1.87 520
65 34.56 0.44 8.67 1.71 430 65 32.76 2.24 8.54 1.49 370
3. Results and discussion
Here we present the results and discussion on XRD, dependent magnetization M(T), and temperature-dependent elastic modulus E(T) measurements. Firstly, the results of XRD studies are introduced to understand the crystallographic structures of the samples. Room temperature XRD measurements are given in Figure 1
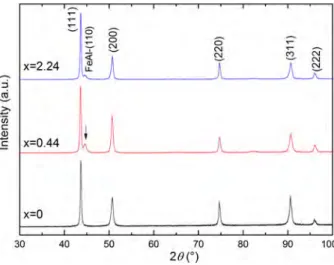
in the range 30° ≤ 2θ ≤ 100°. As seen from the x = 0 data, the nondoped Invar alloy exhibits characteristic peaks of the fcc structure with lattice constant a = 3.597 Å. However, Al doping leads to the appearance of a second crystallographic structure as seen in the data for x = 0.44 and x = 2.24.
Figure 1. X-ray diffraction patterns are shown in the range 30° ≤ 2θ ≤ 100°. Black, red, and blue data correspond to the samples with x = 0, 0.44 and 2.24 at%, respectively.
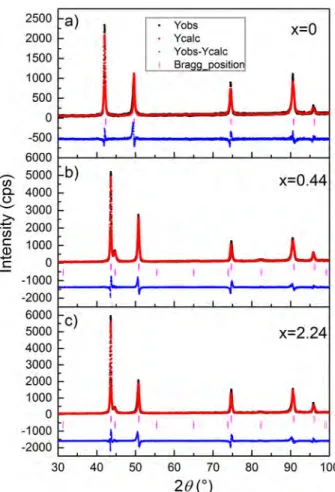
Rietveld refinements of the XRD data are given in Figures 2a–2c. The peaks of the second structure at 44.77° and 82.28° are observed in the two Al-doped samples (Figures 2b and 2c). According to Rietveld refinements, the additional peaks in the Al-doped alloys correspond to the B2 structured Fe–Al intermetallic alloy with Pm-3m space group and a = 2 .871 Å. There is a small decrease in the lattice parameter of the fcc structure with increasing Al content, and this gives rise to a contraction in the volume of the fcc structure (Table 2). This is in accordance with the deviation from Vegard’s law of Fe–Ni-based Invar alloys below about (e/a) = 8.75 [20].
Table 2. Lattice parameter, volume, and goodness of fit (GoF, (Rwp/Rexp)) obtained from Rietveld refinements. Fe65Ni35−xAlx a (Å) V (Å3) GoF
x = 0 3.6005 (2) 46.67 (5) 0.35 x = 0.44 3.5965 (3) 46.52 (4) 0.37 x = 2.24 3.5954 (5) 46.48 (2) 0.20
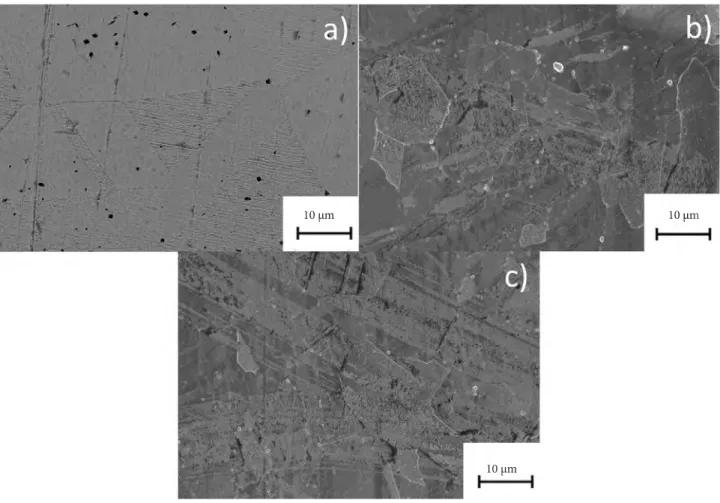
In Figures 3a–3c, SEM images of etched surfaces are seen. From the SEM image of Fe65Ni35 (Figure 3a) we can detect grains of the fcc structure. Images of Al-doped Invar alloys in Figures 3b and 3c show the fcc structure and precipitates corresponding to the second phase, which is in accordance with the XRD results. Due to the surface treatment, martensitic twins can be observed in all images since the compositions are very close to the austenite–martensite transition.
M(T) measurements at 5 T and 5 mT are given in Figures 4a and 4b, respectively. The saturation magnetization (Ms) values from the 5 T measurements are used to calculate the average magnetic moment
(µ). As seen from Table 1, the calculated µ values for all samples show a decrease with increasing Al content, and decreasing valence electron concentration. This is in accordance with the Slater–Pauling curve, where fcc
::, .!'?- 1:;-·u; C: x=2.24
*
x=0.44 x=O ~ ~ ~ oo ro oo oo 100 20(°)I
I
I I
Figure 2. Refinement results of XRD data (a) x = 0, (b) x = 0.44, and (c) x = 2.24 at%.
Fe–Ni alloys exhibit a deviation from the general trend so that µdecreases with decreasing valence electron concentration [21,22]. Here Al-doped Invar alloys show this deviation.
In Figure 4b, the Invar alloy x = 0 has Tc≈ 520 K. A small amount of Al addition leads to a decrease
in Tc, which is around 430 and 370 K for the samples x = 0.44 and 2.24 at%, respectively. M(T) decreases
faster than the Brillouin function up to Tc with increasing temperature. Al doping reduces Tc as well as the
magnetization by decreasing the electron concentration. The appearance of paramagnetic FeAl precipitates in the ferromagnetic fcc structure should have no substantial influence on the Invar effect [23]. Both the decrease in the average magnetic moment and the decrease in Tc with decreasing e/a indicate that Al partially forms
a random solid solution with the Fe–Ni matrix, with the remaining Al forming precipitates. Precipitates occur even in the lowest Al-doped alloy, implying that the solubility limit is lower than 0.44%.
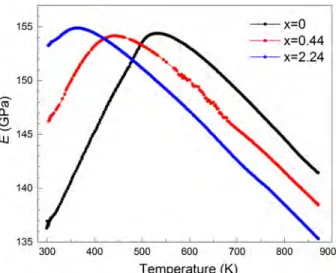
E-mod results of the alloys are given in Figure 5. E-mod of the Fe65Ni35 increases with increasing temperature and then starts to decrease, exhibiting a peak at 520 K, around magnetic transition temperature. The Al-doped x = 0.44 and 2.24 at% alloys exhibit similar behavior, with maximum values of 430 K and 370 K, respectively. The Invar anomalies are still observable in Al-doped alloys; hence, the E-mod results show a decrease below Tc. Softening in E-mod and decreasing Tc are an indication for the decreasing energy
difference between high-spin and low-spin states. Volume shrinkage and lowering Tc are also observed in
hydrostatic pressure and alloying studies [17,24-26]. Al doping to the Fe65Ni35 Invar alloy yields results similar to adding Si. Al and Si give rise to a volume contraction having a smaller radius than Ni. For this reason,
2500 a) Yobs x=O 2000 Ycalc 1500 I Yobs-Ycalc Bra 1000 500 0 -500 6000
<ii'
5000 b) x=0.44 a. 4000 ~ 3000 2=' 2000 "iii C: 1000 Q)-
C: 0 '1 I I 1' I N M -1000 -2000 6000 c) 5000 x=2.24 4000 3000 2000 1000 0 I II -1000 I -2000 30 40 50 60 70 80 90 10020 (
0 )Figure 3. Scanning electron microscopy images of the samples (a) x = 0, (b) x = 0.44, and (c) x = 2.24 at%.
Figure 4. M(T) measurements of the Fe65Ni35−xAlx Invar alloys (a) under 5 T (b) under 5 mT.
alloying with these elements acts like applying an internal chemical pressure and so it is similar to applying hydrostatic pressure. The volume shrinkage makes the transition from the high-spin to the low-spin state easier. Additionally, relative E-mod shift above Tc to lower values with increasing Al content is a result of the soft
and ductile character of Al.
10 i,un IOiun
I
I
200 a) b) 180 20 160 - s::: 0 ).
•
""'
140"
i:
\
5 mT 3,. ~ ;,:-~ 120 10 co ' 100\
\ ... 80 0 0 100 200 300 400 500 600 700 Temperature (K)Figure 5. E(T) measurements of the Fe65Ni35−xAlx Invar alloys. Black, red, and blue data correspond to the samples
with x = 0, 0.44, and 2.24 at%, respectively.
As a concluding remark, while Al doping increases the elasticity and corrosion resistance of the material, the alloys with x = 0.44 and 2.24 at% Al content still have the Invar property with a lowered Tc and a lowered
E-mod at room temperature. Acknowledgments
The author thanks M Acet for useful discussions and UC Özöğüt for assistance with the E-mod measurements. References
[1] Guillaume, C. E. Compt. Rend. Acad. Sci. 1897, 125, 235-238. [2] Shiga, M. Curr. Opin. Solid St. M. 1996, 1, 340-348.
[3] Wassermann, E. J. Magn. Magn. Mater. 1991, 100, 346-362.
[4] Pepperhoff, W.; Acet, M. Engineering Materials and Processes; Springer-Verlag: Berlin, Germany, 2001. [5] van Schilfgaarde, M.; Abrikosov, I. A.; Johanson, B. Nature 1999, 400, 46-49.
[6] Gorria, P.; Martinez-Blanco, D.; Blanco, J. A.; Smith, R. I. J. Alloy Compd. 2010, 495, 495-498.
[7] Matsushita, M.; Nakano, S.; Ohfuji, H.; Yamada, I.; Kikegawa, T. J. Magn. Magn. Mater. 2011, 323, 838-841. [8] Nataf, L.; Decremps, F.; Geuthier, M.; Canny, B. Phys. Rev. B 2006, 74, 184422.
[9] Abrikosov, I. A.; Kissavos, A. E.; Liot, F.; Alling, B.; Simak, S. I.; Peil, O.; Ruban, A. V. Phys. Rev. B 2007, 76, 0124434.
[10] Moruzzi, V. L. Phys. Rev. B 1990, 41, 6939-6946.
[11] Entel, P.; Hoffman, E.; Mohn, P.; Schwarz, K.; Moruzzi, V. L. Phys. Rev. B 1993, 47, 8706-8720.
[12] Acet, M.; Schneider, T.; Zahres, H.; Wassermann,E. F.; Pepperhoff, W. J. Appl. Phys. 1994, 75, 7015-7017. [13] Wassermann, E. F.; Acet, M. Magnetism and Structure in Functional Materials, Springer Series in Materials Science,
vol. 79; Springer: Berlin, Germany, 2005.
[14] Acet, M.; Zahres, H.; Wassermann, E. F.; Pepperhoff, W. Phys. Rev. B 1994, 49, 6012-6017.
155 150
rn
a.. Cli:u'
145 140 - x=O - x=0.44 - x=2.24 135 ...,__..___.__~_._~_..._~--'---'--..__~..__, 300 400 500 600 700 800 900 Temperature (K)[15] Nadutov, V. M.; Kosintsev, S. G.; Svystunov, Ye. O.; Garamus, V. M.; Willumeit, R.; Eckerlebe, H.; Ericsson, T.; Annersten, H. J. Magn. Magn. Mater. 2011, 323, 2786-2791.
[16] Ahmad, S.; Ziya, A. B.; Ashiq, M. N.; Ibrahim, A.; Atiq, S.; Ahmad, N.; Shakeel, M.; Khan, M. A. J. Magn. Magn. Mater. 2016, 419, 125-130.
[17] Özöğüt, U. C.; Çakır, A. J. Alloy Compd. 2017, 705, 126-130. [18] Zamanzade, M.; Barnoush, A.; Motz, C. Crystals 2016, 6, 10.
[19] Roebben, G.; Basu, B.; Vleugels, J.; Humbeeck, J. V.; der Biest, O. V. J. Alloy Compd. 2000, 310, 284-287. [20] Pearson, W. B. A Handbook of Lattice Spacings and Structures of Metals and Alloys, International Series of
Monographs on Metal Physics and Physical Metallurgy, Vol. 4, Pergamon: Oxford, UK, 1958. [21] Kakehashi, Y. J. Magn. Magn. Mater. 1983, 37, 189-205.
[22] Kakehashi, Y.; Hosohata, O. J. Phys. Colloq. 1988, 49, 73-74.
[23] Villars, P.; Calvert, L. Pearson’s Handbook of Crystallographic Data for Intermettalic Phases, 2nd ed., American Society for Metals: Materials Park, OH, USA, 1991.
[24] Gorria, P.; Martinez-Blanco, D.; Perez, M. J.; Blanco, J. A.; Hernando, A.; Laguna-Marco, M. A.; Haskel, D.; Souza-Neto, N.; Smith, R. I.;Marshall, W. G. et. al. Phys. Rev. B 2009, 80, 064421.
[25] Matsushita, M.; Endo, S.;Miura, K.; Ono, F. J. Magn. Magn. Mater. 2003, 265, 352-356.
[26] Nataf, L.; Decremps, F.; Chervin, J. C.; Mathon, O.; Pascarelli, S.; Baudelet, F.; Congeduti, A.; Itie, J. P. Phys. Rev. B 2009, 80, 134404.