Epilogue
Siibidey Togan
In this study, following the approaches adopted in the European Commissionl and the UK White Papers on competitiveness prepared by the Department of Trade and Industry (1995), we have defined competitiveness as the degree to which a country can, under free and fair market conditions, produce goods and services which meet the test of international markets, while simultane-ously maintaining and expanding the real incomes of its people over the long run.
The study has concentrated on three MENA countries, namely Egypt, Tunisia and Turkey. We have studied the market access conditions for MENA exports in major industrial countries in Chapter 2, and in Chapters 3—5 we tried to determine the openess of the MENA economies. We have
concentrat-ed in Chapters 6—8 on the analysis of labor market flexibility and in Chapter
12 on the determinants of labor productivity in MENA countries. We have studied the role of investment incentive schemes and taxation policies in determining the cost of capital and issues related with market structure in Chapters 9—1 1. Finally, issues related to macroeconomic stability were discussed in Chapter 12.
1. Market Access Conditions for MENA Exports
Consideration of the trade performance of Egypt, Tunisia and Turkey reveals that, although their exports have increased in absolute terms, the share of those exports in the world market has declined significantly. This decline has taken place along with some, initially positive developments. First, the export con-centration index of the three countries has improved, implying that exports have become more diversified. This factor, however, does not necessarily translate into the improved competitiveness of exports, since not all of the new products have experienced success in world markets. Second, the development of MENA countries’ exports has experienced a switch from raw materials to manufactured products. That, by definition, means that there is more added value in exports. Furthermore, many of their manufactured exports are con-sidered to be dynamic, meaning that they have recently enjoyed growth rates larger than the world average. The disturbing factor here is that these same products have been experiencing declining market shares on world markets.
Siibidey Togan
Since the major export markets for the three MENA countries examined here are industrial economies, with the EU being by far the largest market, followed by the US, the potential importance of changes in market access conditions in those economies is obvious. It should be noted that exports of Egypt, Tunisia and Turkey enjoy preferential access to the markets of the EU and the US under one scheme or another. Thus, one may argue that any progress at the multilateral level would necessarily imply an erosion in the margins of preferences the countries enjoy in the EU and US markets.
All three MENA countries qualify for preferential treatment in the EU and the US markets under the Generalised System of Preferences (GSP), which is a scheme under which all developing countries are supposedly eligible for trade preferences according to which preference-giving countries exempt imports from developing countries from MFN duties. In fact, MENA countries have a potentially larger share of GSP qualified exports than the average for the world. However, GSP has proven to have a low utility rate. In the case of the EU, this could be due to several potential factors. First, it could be that few exporters actually bother to benefit from GSP due to the cumbersome, arguably non-transparent procedures that are involved. Second, MENA countries are eligible for a more preferential treatment than that offered by the GSP under the various bilateral trade agreements with the EU. In the case of the US, exporters are eager to take advantage of the preferen-tial margins that the GSP offers. However, since a much smaller share of MENA exports actually qualifies for GSP treatment, the utility rate of the US GSP remains low.
Due to its non-reciprocal nature, GSP has naturally caused many dis-agreements between developed and developing countries. Under the scheme, beneficiaries do not have legally enforceable rights to these preferences. This,
in addition to the generally non-transparent nature of the mechanisms through
which the GSP schemes are implemented, allows the developed economies to use the GSP-related trade barrier concessions as leverage, potentially allow-ing them to exert political influence on developallow-ing countries. All thallow-ings considered, it becomes clear that GSP is indeed no alternative to multilateral trade negotiations, which have the potential to result in reciprocal and tangi-ble benefits.
In the context of EU-MENA relations, most industrial exports from the three MENA countries enjoy duty -free access to the EU market. Furthermore, quotas of textile and clothing imports into the EU from Tunisia have decreased, and the number of products subject to quota restrictions is being reduced with a view toward completely phasing them out by 2005.
There are also positive prospects for industrial exports of the three coun-tries in the multilateral context. The value of multilateral trade negotiations is such that each and every product group of current and potential export
Epilogue
interest to MENA exporters will experience a reduction in its tariff treatment once the obligations agreed during the Uruguay Round have been imple-mented in full. That means that MENA countries have indeed succeeded in negotiations, although there still is plenty of room for improvement. One of the main tasks for the MENA negotiating team would be to agree on elimination of non-tariff trade barriers, which prevent some goods, with regard to which the countries under review enjoy comparative advantage, from entering the markets of developed economies. Another important task would be to make the developed countries agree on a significant reduction of tariffs on manufactured goods, which currently are about eight times higher than tariffs on raw materials.
The situation for the agricultural exports of the three MENA countries is more complicated. Liberalization of this arguably most distorted sector is among the highest priorities of the WTO. With the Cairns Group arguing for the complete elimination of export subsidies on one side, and the EU and Japan arguing that the Doha Ministerial declaration does not call for the elimination of export subsidies on the other, the potential outcome of negotiations is unclear. The result of those negotiations, however, is of great concern to the economies under study, since the agricultural sector plays a significant role, both in terms of percentage of GDP, and in terms of the human capital that it engages.
Turkey seems to be in a relatively favourable position here. The EU-Turkey customs union implies that, once the agreement is fully implemented, about 90 percent of reciprocal trade in agricultural products would benefit from preferential treatment, and about 70 percent would be eligible for duty-free access. The other two MENA countries enjoy much less certainty about the future of their agricultural sector. It has been estimated that the liberalisa-tion of agricultural trade might result in higher world prices for food. Since Egypt and Tunisia are designated as net food importing countries, they could actually suffer significant economic losses.
2. Trade and the Foreign Exchange Regime
After pursuing inward-oriented development strategies for considerable peri-ods of time, Turkey switched to outward oriented policies in 1980, Egypt in 1991 and Tunisia in 1986. Turkey had signed the GATT in 1951, Egypt in 1970 and Tunisia in 1990. All three countries became members of the World Trade Organization (WTO) in 1995. Turkey joined the European Customs Union (CU) starting January 1, 1996. Egypt signed the EU-Egypt Association Agreement on June 25, 2001 and the EU-Tunisia Association Agreement came into force on March 1, 1998. Under these Association Agreements the parties commit themselves to create a free trade area amongst themselves by 2010.
Sz'ibidey Togan .3 23 Ea 2 23 83% v.3. fl: \ .3 3.: 39:6t $53 3m+m mam MEN 3 o.o €80 55350 550 8m-£-§-m ed Em gm 0.8 @356 g od 5 o? a? 85o mo
m2$w2$mm§ 53:5 “BEBE o.o 2 3: new
550 +RE+£$3$E mwhn+mmfih SH SH E o.o 388E 036583 +£W£EK SA 2m 3 o.o magi? Ea 5:282 13385 atbtfi 8&0 8:382 2; .E 305325 od 3 3: 3m £$£+£ b05522 od 3 mi we 30520-52 .550 E+fl+ fi 2w: sac; 935050 5:382 ed 3 3: 9: EoEnEcm tongs; «Em @3532 02 SN 3 od weaogszéom sec . 353.0 550 2§E£o 3 m3 3: 9%. mm+wm+mm+mm smousogfimi od o.o 3 m.-vm o.o 3 9m 32 xfia fio 2535 mm od 5 5.2 08 8:83
Main 2§E£o o.o E 92 Nam
2590 E EMBEOLU . 3A 2: 3: od 3o Ea 8: S moh=uuau==az . . 3m 0.2 2 Qo 2908 gouaeoz we 225 o.o S Z 3:
m 85 23 5&0 292:2 o.o No or now
mafia 9:52 32695 EN 3N mo MS 2E2“: Em 5330:? 3532 MEN 3N EN EN 25 ~N+vi+o .a..=:=u_._w< $933.:— DEC?» 35550 2:; am 3:255 Eu; am 952%.: 88.335 Gozwszc @3336 £53.50
ohm £5. “ESP Esp crab
:32 E32 :32 :32 3:54 3:54 332 333 «SEE. mow—ha.
having
US“
«3.58
5
83%
559895
35584
3.2
Bank
428Epilogue
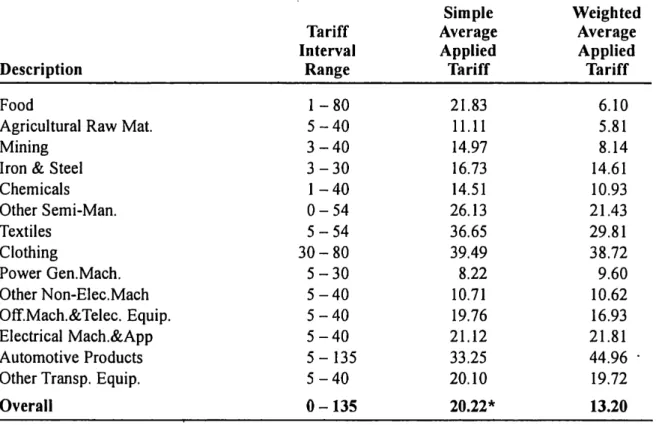
Table 13.1 shows the nominal protection rates in Tunisia and Turkey. The table reveals that tariff rates are relatively high in Tunisia. The tariff rates applicable on Tunisian imports of industrial goods from the EU will decrease to zero by 2010, but by that time the tariff rates applicable on Tunisian imports from third countries will be high enough to cause trade diversion effect. This will lead to welfare losses unless Tunisia will reduce the tariff rates substan-tially, as in the case of Turkey. Similar considerations apply for Egyptian tar-iff rates shown in Table 13.2.
Table 13.2: Nominal Protection Rates in Egypt
Simple Weighted
Tariff Average Average
Interval Applied Applied
Description Range Tariff Tariff
Food 1—80 21.83 6.10
Agricultural Raw Mat. 5 — 40 11.11 5.81
Mining 3 — 40 14.97 8.14
Iron & Steel 3 — 30 16.73 14.61
Chemicals 1 - 40 14.51 10.93 Other Semi-Man. 0 — 54 26.13 21.43 Textiles 5 — 54 36.65 29.81 Clothing 30 — 80 39.49 38.72 Power Gen.Mach. 5 — 30 8.22 9.60 Other Non-Elec.Mach 5 — 40 10.71 10.62 Ofi‘.Mach.&Telec. Equip. 5 — 40 19.76 16.93 Electrical Mach.&App 5 — 40 21.12 21.81 Automotive Products 5 — 135 33.25 44.96 '
Other Transp. Equip. 5 — 40 20.10 19.72
Overall 0 — 135 20.22* 13.20
In Egypt, Tunisia, and Turkey liberalization of trade has been restricted to industrial goods until recently. Since agriculture formed 14.] percent and ser-vices 64.3 percent of GDP in Turkey during 1999, 17 percent and 51 percent respectively of GDP in Egypt, and 12 percent and 59 percent of GDP in Tunisia, it can be stated that liberalization of trade until recently has not cov-ered 78 percent of Turkish GDP, 68 percent of Egyptian GDP, and 71 percent of Tunisian GDP. The challenge for Turkey, Egypt, and Tunisia is to liberalize their trade in agricultural commodities and services. In this respect, Turkey has taken major steps towards liberalizing its trade in agriculture and services with the EU. The same cannot be said of Egypt or Tunisia.
To exploit their comparative advantages more fully, Turkey, Egypt, and Tunisia will have to create a better climate for foreign direct investment. At present, FDI is hampered by economic and political uncertainty, government
Sabidey Togan
intervention, bloated bureaucracy, and complicated rules. Countries in Eastern Europe have been exploiting their comparative advantage by inviting foreign direct investment from Western Europe, combining the technical, managerial
and marketing assets of Western firms with a generally well-educated and
skilled labor force willing to work for low wages. Turkey, Egypt, and Tunisia have a long way to go before they can hope to attract foreign direct investment
to the same extent as some of the more successful countries in Eastern Europe.
For example, Turkey, Egypt and Tunisia attracted $15, $19 and $81
respec-tively in foreign direct investment per capita in 2000, compared to $256 in Poland, the most-successful of the Eastern European countries. Turkey also attained an exremely low rating for its investment climate in the UN’s Direct Investment Index.
The case of Turkey is quite different from those of Egypt and Tunisia, as Turkey expects to acceed to the EU. At the Helsinki European Council held on December 10—11, 1999, Turkey was officially recognized as a candidate state on an equal footing with other candidate states. The Helsinki Council empha-sized that compliance with the Copenhagen criteria is the basis for accession to the Union. After the approval of the Accession Partnership by the Council and the adoption of the Framework Regulation on February 26, 2001, the Turkish Government announced its own National Program for the Adoption of the Acquis Communautaire on March 19, 2001. With accession, Turkey will liberalize its trade with EU in agricultural commodities and services, and it will be part of the European single market. Furthermore, joining the EU will require‘ Turkey to adopt and implement the whole body of EU legislation and standards—the Acquis Communautaire—and also eventually participat in European Monetary Union (EMU).
Concentrating on the welfare effects of the Turkish accession to the EU, we
note that the impact of the customs union in industrial goods on Turkish
wel-fare has been estimated by Harrison et al. (1997). The authors considered the effects of tariff reductions, improved access to EU markets due to elimination of voluntary export restraints, and harmonization of product quality standards improvements in testing laboratories in Turkey, and reduced costs of trading due to the reduction in border costs. They estimate that the gains to Turkey will amount to 1.1 percent of its GDP per year.
If liberalizing trade in industrial goods can affect GDP, then there should be comparable gains from liberalizing agriculture as well as services that are becoming increasingly tradable. Trade liberalization in agriculture will lead to efficiency gains. On the other hand, an efficient and well regulated financial sector leads to an efficient transformation of savings to investment, and bene-fits also arise from increased financial product variety and better risk sharing in the economy. In the case of telecommunications, improved efficiency gen-erates economy-wide benefits since telecommunications are a vital
intermedi-Epilogue
ate input and are also crucial to the dissemination and diffusion of knowledge, Similar considerations apply to the electricity sector as energy is an indispens-able input into production and inefficient production of energy acts as a tax on production. Following Ritson and Harvey (1997) and Deardorff (2001), one then argue that Turkey will derive considerable gains from eliminating barri-ers to trade in services.
The above considerations suggests that integration should remove the dis-tortions in the price system, which in turn will boost the allocative efficiency in the economy. As a side effect, this heightened efficiency will make the coun-try more attractive to investors. Thus the allocative efficiency gains from integration will be boosted by induced capital formation. As investment increases above its normal level the Turkish economy will experience a growth effect. All this means improved material well-being for Turkish people in the long term.2
Finally, within a few years of EU accession Turkey will abondon its nation-al currency and adopt the euro. As stressed by Mundell (1961), currency union will reduce the costs of international transactions and promote trade and open-ness. Frankel and Rose (2002) note that belonging to a currency union tripples trade with other currency union members, that there is no evidence of trade diversion, and that every percent increase in the country’s overall trade relative to GDP raises income per capita by at least one third of a percent.
Consideration of the effects of membership on the pattern of trade between the EU-15 and Turkey reveals that the trade pattern in industrial goods will not be effected significantly, since the customs union was already established in 1996. Trade in agricultural goods will be effected. Turkey’s comparative advantage will be in low-skilled, low-wage activities in manufacturing for
some decades to come. Although the pattern of Turkish—EU trade is not
expected to change substantially as a result of full membership, there is con-siderable potential for an increase in the volume of trade. The recent experi-ence of the Central and Eastern European countries shows that trade volumes
have increased substantially as a result of large investments by firms from
Western Europe and elsewhere, which combine their technical, managerial and marketing assets with a generally well educated and skilled labor force at low wages. Turkey has a long way to go before it can hope to attract foreign direct investment to the same extent as some of the more successfull countries in Central and Eastern Europe. Membership and adoption of the Acquis will go some way towards establishing a better investment climate, which in turn should lead to higher volumes of trade.
We have forecasted the volume of trade between Turkey and the EU-15 under the assumption that it will reach the same level of intensity as trade between the EU member states at present. The forecast is based on estimation of a gravity function for trade within the EU-15. The gravity function has been
Sfibidey Togan
used to explain the volume of bilateral international trade since the 19603 and has proven to be remarkably successful. It postulates that the volume of trade between a pair of countries is a function of the size of the trade partners (mea-sured by GDP, population, or geographic area), their income level or capital abundance, (measured by GDP per capita), and trade costs (measured by a variety of factors, such as tariffs and other administratively-imposed trade bar-riers, geographic distance, common borders, common language, or common legal systems).3 In the following we have estimated the standard version of the gravity equation:
ln [(exports from country i to country j + exports from country j to country
i)/2] = constant + ,B. In (GDP of country i x GDP of countryj) + B2 In (GDP per
capita in country ix GDP per capita in country j) + [3, ln geographical distance + error term
The dependent variable in the gravity equation is the logarithmic average of bilateral exports. It is explained by the logarithmic product of GDP; the volume of trade is simply assumed to rise in proportion to the combined economic size of the trade partners. GDP per capita can be thought of as a measure of product differentiation and specialization. The higher the per capita income is, the more differentiatied is taste and production, and the larger is the volume of trade based on product differentiation and increasing returns to scale. A high per capita income is also an indication of an abundance of physical and human capital relative to manual labor. Thus, the per capita variable should serve to capture both intra—industry trade caused by product differentiation and increas-ing returns to scale, and inter-industry trade caused by differences in factor endowments. Trade costs are controlled by the inclusion of geographical distance as an indicator of transportation costs, but also the costs of cultural dif-ferences which tend to increase with geographic distance.
The estimates of the gravity equation are presented in Table 13.3. The grav-ity equation explains more than 90 per cent of the variation in the data. All coefficients are estimated with a very high level of statistical significance (less than 1 percent) and have the expected sign, with one exception. The product of real per capita GDP is found to have an unexpected, negative effect on the volume of trade. The estimate of the gravity equation is then used to make forecasts of bilateral trade for Turkey with the EU-15. The results are present-ed in Table 13.4. As can be seen, the forecastpresent-ed value of Turkish—EU-l 5 trade is 25.75 billion dollars in 2000, which is almost 25.2 per cent higher than the actual average value of$18.547 billion for the period of 1999—2001.
Next, we assume that Turkey eventually will have a share of EU trade to total trade that is equal to that of the four large EU countries, namely 58 per-cent. Then total trade of Turkey can be shown to increase to $44.4 billion. When we divide this value by the average value of GDP for 1999—2001 we
\ Epilogue
arrive at a ratio between the average of exports and imports to GDP of 25.2 percent. The actual value of total trade to GDP over the 1999—2001 period, on the other hand is 20.67 percent. Noting from Frankel and Rose (2002) that every percent increase in the country’s overall trade relative to GDP raises income per capita by at least one third of a percent, we can state that income per capita in Turkey will increase by about 1.5 percent with EU accession .
Table 13.3: Gravity Estimates for Intra-EU-IS Trade
Constant -3.884l33
(-3. 193833)
Ln real product GDP 0.815026
52.1816
Ln real product GDP per capita -0. 145238
(-2.705978)
Ln distance -0.901144
(-21.50092)
R-squared 0.622767
Table 13.4: Forecast of Turkish Trade with EU-15
Average Average
Turkish Turkish Forecasted
Export to Imports from Average Average
the EU the EU Trade Trade
1999—2001 1999—2001 1999—2001 2000
(Million USS) (Million USS) (Million USS) (Million USS)
14,992 22,102 18,547 25,747
3. Labor Market Flexibility
Studies reveal that the Turkish and Egyptian populations are increasing on average at one million persons per year, whereas population in Tunisia is increasing at about 150,000 persons per year. This means that over time Turkey, Egypt, and Tunisia will have to continuously create new jobs for the growing population. Until now those countries have successfully solved their unemployment problems through the existence of large informal sectors. The three countries have been characterized by lax enforcement of tax, social security and labor laws. In the three countries labor markets have been
relatively flexible. But this flexibility of labor markets has been achieved at
some costs, associated with the lax enforcement of the laws and regulations. The economic units have begun to take it for granted that they can avoid the rule of law.
Sz‘ibidey Togcm
With increasing globalization the MENA countries will start to feel the international pressure to change their institutions, regulations, and legisla-tion protecting workers in the formal sector. The current system of formal and informal sectors with the informal sector accounting for a large per-centage of total employment does not seem to be sustainable in the long run. In particular we may expect the EU and other industrial countries’ firms to complain about unfair trade practices by Turkey, Egypt, and Tunisia. Turkey will be the first country to feel this pressure since it is aiming for the EU accession. In this context the European Union may ask Turkey to enforce its own labor laws, laws on the social security system and tax laws uniformly in the country. When this process starts, the informal sector in Turkey will experience a rise in labor costs leading to a decrease in the demand for labor and hence an increase in unemployment. In order to minimize the problems of unemployment the policy makers must modify current job security legis-lation in order to reduce the firing costs, decrease the high social insurance contributions and tax rates and eliminate whenever possible other payments. In short, the measures should be designed to reduce the difference between the labor cost to producers and the amount received by labor after taxes and related charges. A system in which even a minimum wage worker receives only 58.4 percent of the amount paid as labor cost by the producer as in Turkey is not sustainable. It should be emphasized that Turkish policy mak-ers when implementing comprehensive labor market reforms, will have to
consider the goals of attaining increased labor market flexibility, avoiding a
potential increase in unemployment,uniformaly enforcing the tax, social security and labor laws throughout the country, decreasing the share of the informal sector in total employment, and any possible trade-offs between these goals.
Table 13.5a summarizes personal average tax rates defined as income tax plus employee social security contributions as a percentage of gross wage earnings. The table reveals that personal average tax rates has amount-ed to 29 percent in Turkey, whereas it was only three percent in Mexico, nine percent in Korea, and 18 percent in Portugal. Table 13.5b shows the income tax and employee and social security contributions as a percent of
the labor costs. It follows that income tax and social security
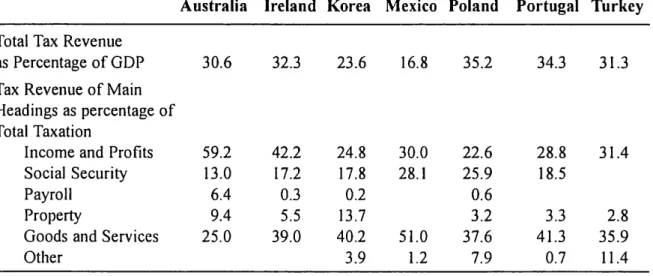
contri-butions formed 40 percent of the labor cost in Turkey, whereas they were only 15 percent in Mexico, 17 percent in Korea, and 23 percent in Australia. The tables reveal that the tax burden varies greatly among countries. The variations in tax burdens reflect, in part differences in overall ratio of aggre-gate tax revenues to gross domestic product, and the share of personal income tax and social security contributions in national tax mixes, as shown in Table 13.6.
Epilogue
Table 13.5: Income Tax plus Employee Social Security
Contributions, 2000
Table 13.5a: As percent of Gross Wage, 2000
Social
Income Security Total
Tax Contributions Payment
Australia 23 0 23 Ireland 15 5 20 Korea 2 7 9 Mexico 1 2 3 Poland 7 25 31 Portugal 7 11 18 Turkey 15 14 29
Table 13.5b: As percent of Labor Costs
Income Social Security Contributions
Tax Employee Employer Total
Australia 23 0 0 23 Ireland 14 5 11 29 Korea 2 6 8 17 Mexico 1 1 13 15 Poland 5 21 17 43 Portugal 5 9 19 34 Turkey 12 12 16 40 Source: OECD, (2001).
Table 13.6: Tax Revenue in Selected Countries, 1999
Australia Ireland Korea Mexico Poland Portugal Turkey
Total Tax Revenue as Percentage of GDP
Tax Revenue of Main
Headings as percentage of Total Taxation
Income and Profits Social Security Payroll
Property
Goods and Services Other
30.6
32.3
59.2
42.2
13.0
17.2
6.4
0.3
9.4
5.5
25.0
39.0
23.6 24.8 17.8 0.2 13.7 40.2 3.9 16.8 35.2 30.0 22.6 28.1 25.9 0.6 3.2 51.0 37.6 1.2 7.9 34.3 31.3 28.8 31.4 18.5 3.3 2.8 41.3 35.9 0.7 11.4 Source: ()ECD. (200]).Siibidey Togan
The large wedge between labor costs and workers’ disposable income in MENA countries is due to high labor taxes. Such a high tax wedge raises labor costs, discourages work in the official economy, contributes to high non-employment in the working age population, and decreases the competitive-ness of the country's exports. The challenge facing the MENA countries is to reduce the high labor taxes without causing increases in fiscal deficits. The countries have to introduce tax reforms which will especially focus on lowering the personal income and social security taxes while broadening the tax bases. Such reforms have been successfully introduced in Korea, Poland and Mexico. Furthermore, eligibility criteria for early pensions, disability benefits and sickness allowances have been tightened in those countries which reduced spending and enabled lower social security contributions. After implementing the tax reforms and tightening the eligibility criteria the MENA countries should work on strengthening tax administration in order to bring an end to lax enforcement of the rules, and also in order to boost
revenue.
3. Investment Incentives and Conditions of Competition
Consideration of the investment incentive system and corporate tax structure in Turkey, Egypt, and Tunisia reveals that the three countries have used the incentive and tax system as one of the main tools of industrial policy. The ultimate purpose of the scheme has been to increase investment and overcome the barriers to entry into industry imposed by capital market imperfections. Yet investment incentives and tax systems in Turkey, Egypt, and Tunisia have
been a barrier to competition. Via the incentive system, established firms
obtained cost advantages which have helped them to consolidate their market positions.
Entrants, competing for scarce fiscal resources, have been at a
disadvan-tage relative to well-informed incumbents. The credit incentives, that were supposed to promote entry, have often turned into instruments that reinforced
the position of large incumbents. Established firms benefit from the
investment incentive schemes such as investment allowances, whereas the new entrants do not, since the latter have to show in their income statements positive profits first before benefiting from investment allowances.
Furthermore the governments asks the firms applying for investment
incentives to provide all financial information about the project. Firms in the
informal sector prefer not to make use of any investment incentives rather than provide the required information to the government. Finally, it should be
emphasised that SMES, in particular finance a large part of their investment
expenditures from their own sources. the use of bank credit is rather limited for investment purposes.
EpI'IOgue
When discussing competitiveness the concept was narrowed to countries’ ability to sell their products in world markets and competitiveness was expressed quantitatively by the real exchange rate, given by:
Ep‘_C‘E (1+,1‘)
p
C(1+/'l)
where C = (w / (y/L)) denotes the unit labor cost in the home country expressed in domestic currency units, C. = (w. / (y. /L')) the unit labor cost in the foreign coun-try expressed in foreign currency units, A is the profit margin in the home councoun-try, X the profit margin in the rest of the world and E denotes the exchange rate.
Concentrating on the profit margin we used the relation: _ (Value Added — Labor Cost)
— Labor Cost
A
for the determination of the profit margin. When considering profit margins in Turkey, Egypt, and Tunisia we compare them with those in relatively open economies.
Table 13.7 shows the profit margins and relative profit margin ratios [(1+7t)/(1+?t’)], where A denotes the profit margin of Turkey (Tunisia) and N is the profit margin of Belgium, for the 3-digit ISIC sectors. The table reveals that on average the profit margins in Turkey and Tunisia are much higher than the profit margins in Belgium. In the case of Turkey, the profit margins exceeds those in Belgium in all sectors under consideration. The relative profit margin ratio is highest in the sectors of petroleum refineries (ISIC 353), footwear (ISIC 324) and leather products except footwear (ISIC 323). In the case of Tunisia, the profit margins exceed those in Belgium for all industries except furniture, miscellaneous products of petroleum, scientific measuring equipment, machin-ery except electrical machinmachin-ery, paper, printing, and food. The relative profit margin ratio is highest in the sectors of footwear (ISIC 324), leather products except footwear (ISIC 323), and apparel (ISIC 322).
Table 13.8 shows the profit margins in the two digit ISIC sectors for Turkey, Egypt, Germany, Belgium and Korea.5 The table reveals that in all sectors, the profit margins in Turkey and Egypt exceed those in Germany, Belgium and Korea. We note that the relative profit margin ratio [(1+}»)/(1+7\’)], where A denotes the profit margin of Turkey and 7V is the profit margin of Germany, is highest in the sectors of chemicals (ISIC 35), manufacture of fabricated metal products (ISIC 38), and manufacture of paper, and paper products (ISIC 34). Similarly the relative profit margin ratio [(1+ 2t)/(1+?t’)], where 2» now denotes the profit margin of Egypt and N the profit margin of Germany, shown iniTable 13.9, is highest in the sectors of basic metal industries (ISIC 37), textiles, ppar-el and leather industries (ISIC 32), and manufacture of fabricated metal products
Siibidey Togcm NE; wind $.50 05 2.2m Bosvoi 3.30 can 3&0 mom mm»; omzu $6..” N2 3.3m H““2555m can .230 .botom Gm 28052 22802-52 cm mom.“ $2” oo.mm_ m $4.”? $2605 0:35 0mm QR.— wmod 5.9“ mi oodmm 32605 535% mmm 093 wm nmd: Vmsnm Goo can 852953 mo 388$ 0&2 m 3m; nmmhm mods o fi omdixv moroccom 852053 mmm bwoN 85m 9% a :2 vmwmm 82 .3032; E2830 Xmmm mhmgm 3—.m min fl mg 93? 3&0602 Ea mmEQ mo 838352 mmmm mom.m omim at? am: onfimm £26o 33830 350 Nmm wand Nomgm 3.2V mom aqmnm flmomEocu 35:9; Sm 92605 32820 mm mend mm: _N._m oodmo mEfim—nnm ES wEEtm Nvm mm; Sta 3.? 2.m 326o 59$ 25 59$ :Vm 32605 Baum um woman in ommd coo; ww.mom $63 88m can Sagan Nmm vow; mmmé afiwm-omhom EBWEE E85 .Bosuoi x80 too? 28 woo? Em $26o @003 mm wnobm wwmw ES-mmm mm.:N 82505 vmm 08.3 mvmd mmdm-mmo $23 EQEoom 3086 “5584 no 32605 ES 5584 mmm
53
£3
8.:
3%
£68
5238m
38%
.3593
mmm
mom; mmod 3.3 m2 vo. Gm 85o Sum 5584 Q 622:5 £2:o mm cam; wmmN wmén o: 3.2m 0838. Km mm: 83 m _.ow mwv mm._ m» 8:332: owegom m _ m nwnd omm; omat m: modmm coon N; Z” 0838. d momfigom voom Tm «GE—F main—H EEw—om «EEG; hat—d.«35F
6:.“
NAB—.58
E
2:33:
“EBA
95.39%
6.5
ownuo><
”Em“
22.?
438Epilogue .EQEE‘GBU M Loizwx 6.950% Sim 3m.m moo; m3; 3.0.0 N # o.m Gmd v._ :NN mwN.m 50; N56 Ema Nvoé mvm.m whoa Smog.” omnd mmmé mmfim $82 025 #02 NWNN mugs 2.2 $6 26m mN.mm owN am mime Nw NE om Nmm of mm mom $6; ovfimm and; mhfiom 5.3m cadmm omdom omdmm _N.mvm om. :& ~95s wntaoflsg fi m moEmsuE wagofl sgfi 550 mm $358352 550 mm 3059:v 9:205:00 can ma fia—$02 oEEoBm .Ecommmomoi mwm EoEmEcm ”command! vwm @8382 3.585 as Nwm b05532 3088 30585 32605 302 Rumor—Dam Sm E82 woumomfimm mm 853?: 2m 332 wsoboméoz mum #53:: 23m 3o can no: flhm £302 ommmm mm 32605 22252 05802-82 550 com 439
Silbidey Togan 62023330 M 3&q 69.50% ems? mmsm mod? nmwov $.03 Fmsufi wagofl ngz m owNo NVSm _ mn fiw modem ovsmm muEmsuE wagofi nfifi 550
mm toamcmb @553c 95 ammmomoa oEEomom ES max—05:8 E08353 3.o Edwm a am. omdm fi ood
£08993 98 50:58:" £2605 308 Buotpfl .«o 058352 mm mmdom 3.9 omdm 3.25 E. 3% mow—E65 :32: 06mm hm wndo 3.3 2.8 mmfiov hmdvv :80 can 6:20o mo $2605 go 3083 £2605 BEES 02508-8: mo 833%:v cm 3.2: 6.3 8.2 32 :V E; 3885
0:33 “mfiom $325306o .68 manna can
fioao mo 0589252 mm 8.: 8.9” 8% 2.m $6? @223a 25 museum .3885 59a coma Mo 238:3: 3 2.50 mimw wmgv 2.0M: $.v BEE $622: .30:o @003 can @003 mo 238.352 mm 3.05 modm no.3 oo.# G mimom moEms 5:32 9E 65%? 85o mm $.m bmdm a wbhfl mmd? wodmm 0839 ES “muwfio fip “woo.“.«o 838352 7c. «98M Eiw—om mix—:00 «Enum— 52.5?
«Enum—
EE
>325
E
2:332
595
owauoifi
"wda
Bank
440
\ Epilogue .HEDCUNEUNBU M kbfiuSV ..NUL:QM. oEN RNA momfi viN mmmd owed bums—Vi matsuoflsc m 3:. Smd ooma owed $3 83 8.532: wctsuofls fiE 550 am oofim mmmM wood mood mum...” mood E08353 mcfiobcoo can $.55m Ecoum floa can .EoEaEco toamcab .EoEaa Ea buEna £2605 ESE uofiotp fl mo 228.“?v mm mmm.m mmv.w moms mm: bmwd Rmd 333?: :22: 28m mm womd 12mm Sod SEN 059m Ema 38 c5 8:20o .«o 326o .«o 383 $2605 EBEE 05805-3: mo oBHoflscmE om NE: coma nmwd mam omwd mNfim $2605 ”Ema—a can .5a 480 .m_8_Eonu-oboa images“. mo EauofiscmE mm 23 83 $2 33 $2 5% @2233 2a weaca “3885 :38 59a mo Eggs“: 3,. En; com; #moN mm_.m Ema.— oomd MEEEQ @6205 .9268.“ @003 cam coo? no 838352 mm once E} Sod R: 33 2mm 8.583 5:32 Ba 33%“ £5o mm oil emo.m Sad mwmg 8w; omod 0839 was 39333 608 .«o 228%:a _m «23* Eiw—om b.2590 3.5V— EEw—om azuELoD 25;?» 33m 39.?» 33m— 323 Hamm— msmho.» mow—SH mar—o.» hut—F use? hug—Eh
322
53.2:
#33
gun—om
5.2
Saab
441
Sfibidey Togan
On the other hand the lowest average profit margins in Turkey relative to those in Germany, [(1+}t)/(l+?»’)], occur in the sectors of food (ISIC 31), other manufacturing industries (ISIC 39), and manufacture of woOd products (ISIC 33). The lowest average profit margins in Egypt relative to those in Germany, [(1+}\.)/(1+}\.,)], occurs in the sectors of wood products (ISIC 31), other manufacturing industries (ISIC 39), and manufacture of wood products (ISIC 33). The results are striking, as the average profit margins in Turkey and Egypt are much higher than profit margins in Germany, Belgium, and Korea. The above considerations show the lack of competition in the Turkish, Tunisian and Egyptian manufacturing sectors. Each of the three countries must find ways of decreasing the profit margins to the levels prevailing in the com-petitor countries if it wants to increase the competitiveness of its products. This can only be achieved through increasing the level of competition in the coun-tries concerned.
To promote competition, Turkey has eliminated quantitative restrictions in foreign trade and substantially decreased the level of nominal and effective protection rates during the 19803. Yet as stated above, liberalization of trade has until recently been restricted to industrial goods only. Similar considera-tions apply to Tunisia and Egypt. These countries have also used the policy regarding state economic enterprises (SEE) as a tool of industrial policy. Recognizing that free and undistorted competition is the best way to ensure efficient allocation of resources in the economy Turkey has recently tried to privatize the SEES, but privatization has not gained momentum.
In addition Turkey, introduced the competition law in order to increase competition. Yet the Turkish Competition Law is silent with regard to public undertakings. It does not contain a clause like Article 86 (formally Article 90)
of the EEC Treaty, which explicitly brings public undertakings within the
scope of competition policy. Turkey realizes that it will have to stop subsidiz-ing the public enterprises at the prevailsubsidiz-ing rates and that it must apply the same
competition policies to all firms, whether private or public. Similar
considera-tions apply for Egypt and Tunisia.
The above considerations reveal that trade liberalization alone does not lead to increased competition. It has to be complemented with privatization and the adoption of competition policies. In addition, the country has to termi-nate excessively generous investment incentive schemes. Finally, the country has to create a market-friendly economic environment.
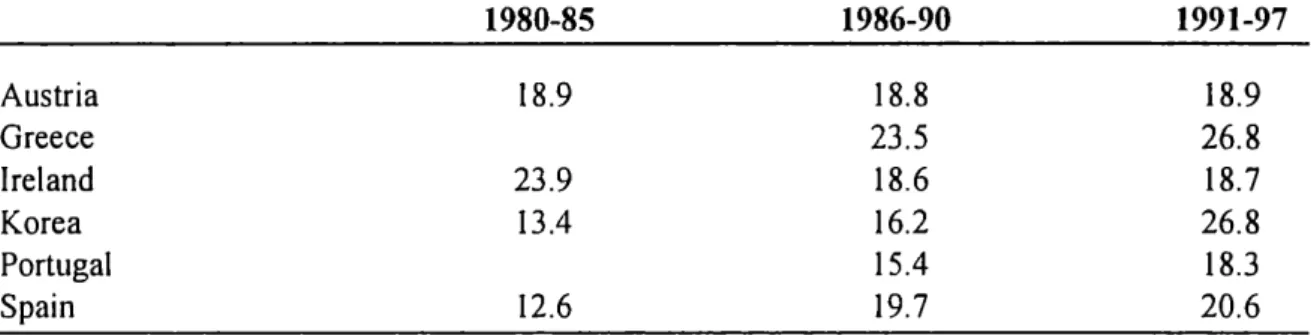
Table 13.10 shows the average effective tax rates (AETR) on capital for Austria, Greece, Ireland, Korea, Portugal, and Spain as estimated by Carey and Tchilinguirian (2000). The authors note that capital pays a number of taxes including corporate profits taxes, taxes on household capital income and various property taxes. The formula used by the authors for the AETR on
\ Epilogue
capital is given as:
T = [1..(OSP1JE + PEI WSE 2300 02400) + 1200 + 4000] / (OS WSE
-2300)
where
OSPUE denotes unincorporated business net income (including imputed rentals on owner-occupied housing)
PEI includes interest, dividends and investment receipts
WSE = ES * ((W - 2100) / EE) where ES denotes number of self-employed, W the wages of dependent employment, and EE refers to the dependent employment
1200 equals taxes on income, profit and capital gains of corporations 2100 equals employees social security contributions
2300 equals social security contributions of the self-employed
2400 equals social security contributions that cannot be allocated to employ-ees, employers or the self-employed
4000 equals taxes on property
4400 equals taxes on financial and capital transactions
In indicates the average effective tax rate on household income B is the share of capital income in household income
OS net operating surplus of the overall economy
Table 13.10: Average Effective Tax Rates on Capital
1980-85 1986-90 1991-97 Austria 18.9 18.8 18.9 Greece 23.5 26.8 Ireland 23.9 18.6 18.7 Korea 13.4 16.2 26.8 Portugal 15.4 18.3 Spain 12.6 19.7 20.6
Source: Camy and Tchilinguirian (2000).
The table reveals that average effective tax rates on capital during 1991-1997 has amounted to 18.3 percent in Portugal , 18.7 percent in Ireland and 18.9 percent in Austria. Thus, the MENA countries by decreasing the corpo-rate profits taxes, taxes on household capital income and various property taxes can induce more competition in the economy by creating a market friendly economic environment.
4. Productivity
Analysis of the productivity trends and the determinants of productivity growth in MENA countries has shown that the productivity levels in those
Stibidey' Togan
countries are generally low relative to the productivity levels in OECD and East Asian countries, the productivity growth rates are generally low relative to the growth rates achieved in OECD and East Asian countries, and that the percent-age contributions to growth of GDP by TFP in MENA countries are also lower than those in OECD and East Asian countries. In order to increase their com-petitiveness through increases in productivity the MENA countries have to increase the growth in the amount of capital per worker (capital deepening), improve labor quality, and increase total factor productivity (TFP) growth. The study revealed that in order to accelerate the productivity growth the MENA countries have to increase not only their investment ratios but also their domes-tic savings rates, as too much reliance on foreign savings over long periods of time may not be sustainable. In addition, in order to accelerate productivity growth MENA countries have to increase considerably the investment in human capital formation. These countries must increase not only the proportion of the adult population with primary, secondary, and higher education, but also the quality of education at each of these levels. Finally, the MENA countries must increase TFP growth. Since the sources for TFP growth include better technology, better organization, specialization, and innovations on the shop floor, the countries should increase channels of knowledge acquisition, and also increase competitive pressure in the economies under consideration.
The level and quality of patent protection in MENA countries influences both the FDI and direct technology transfer through licensing agreements and vertical integration of multilateral firms. It has been shown that the MENA countries have not provided strong patent rights protection until recently. After signing the TRIPS Agreement these countries are expected to increase their pro-tection level over time. Aside from creating the knowledge themselves, the MENA countries can also adopt the knowledge created by others. Here the channels are mainly international trade, FDI, and licensing. It has been shown that trade liberalization effects the productivity change positively. Furthermore, TFP growth depends, on the macroeconomic policies followed by the counties under consideration. Empirical analysis reveals that openness, sustainable fis-cal policy and low inflation are all conducive to higher growth and hence to growth of TF P.
The information revolution and new technologies have made it possible to divide the industry’s value chain into smaller functions that can be contracted out to independent supplier. That this fragmentation of production offers MENA countries an opportunity to move from servicing small local markets to
supplying large firms abroad and, indirectly, their customers all over the world.
Yet to take advantage of this fragmentation of production MENA countries, must increase the quantity and quality of their infrastructure.
Improved efficiency in telecommunications generates economy-wide bene-fits as telecommunications are a vital intermediate input and are crucial to the
\ Epilogue
dissemination and diffusion of knowledge. Similarly, transport services
con-tribute to the ef
ficient distribution of goods within a country and a country's
ability to participate in global trade, thus helping realize the benefits of globalization. Similar considerations apply to the electricity and natural gas sectors, as energy is an important intermediate input of agriculture, industry and services.
6. Macroeconomic Stability
According to UNICE (1997) a country is competitive if it concurrently increases its productivity at a rate which is similar to or higher than that of its major partners, maintains external equilibrium in the context of an open free-market economy, and realizes a high level of employment. Thus, full employ-ment of labor, achieveemploy-ment of which requires the flexibility of labor markets, is a desired feature of competitiveness. In addition the country must avoid
balance of payments crises as well as financial crises associated with the
non-sustainability offiscal policies.
Consideration of the case of Turkey reveals that GDP growth over the last five decades has been characterized by booms and busts. Although the average rate of growth has been 4.86 percent, Turkish GDP has fluctuated considerably due to several balance of payments crises. Concentrating on the latest but the severest of all the crisis, we note that during 2001 GNP contracted by 9.4 per-cent and the loss of employment was put at more than 1.4 million. The main
reasons for the crisis included the deterioration of fiscal balances, banking
problems and mismanagement of the real exchange rates. Turkey could have avoided these problems, in particular the rise in unemployment, by following
prudent macroeconomic policies that would emphasize the sustainability of
fis-cal policy and balance of payments.
Notes
1 Commission ofthe European Communities (1994a).
2 The process described above summarizes briefly the impact of EU membership on
Spain, Portugal and Ireland.
3 Note that standard versions of the gravity equation can be derived from all three
basic trade models, the Ricardian, Heckscher—Ohlin, and increasing returns to scale models, as well as from other models, as demonstrated by Anderson (1979), Bergstrand (1990), Deardorff ( 1998), and Helpman ( 1998). Recent research has sought to ascertain to what extent the various models contribute to the empirical success of the gravity equation seeking to thereby evaluate their empirical rele-vance. See Feenstra, Markusen and Rose (1999) and Evenett and Keller (2002). A tentative conclusion is that models based on increasing returns and product differentiation are more successful in explaining intra-industry trade, while trade in homogeneous goods is better explained by factor endowment differences or
Sz'lbidey Togan
differentiation of goods by country of origin (the Armington assumption).
4 In the cases of Egypt and Tunisia the same approach cannot be applied. These
tries do not aim for accession to the EU. As a result we do not expect these coun-tries to liberalize their trade in agriculture and services, harmonize product quality standards, improve testing laboratories, or adopt the EURO in the near future.
5 For Egypt, the data has been provided by H. Cottenet. See also Cottenet (2000).
Data for Belgium, Germany and Korea have been obtained from OECD STAN Database.