i
ELECTROSTATIC EFFECTS ON THE SELF-ASSEMBLY
MECHANISM OF PEPTIDE AMPHIPHILES
A THESIS
SUBMITTED TO THE MATERIALS SCIENCE AND NANOTECHNOLOGY PROGRAM OF THE INSTITUTE OF ENGINEERING AND SCIENCES
OF BILKENT UNIVERSITY
IN PARTIAL FULFILLMENT OF THE REQUIREMENTS FOR THE DEGREE OF
MASTER OF SCIENCE
By SILA TOKSÖZ
ii
I certify that I have read this thesis and that in my opinion it is fully adequate, in scope and in quality, as a thesis of the degree of Master of Science.
Prof. Dr. Salim Çıracı (Advisor)
I certify that I have read this thesis and that in my opinion it is fully adequate, in scope and in quality, as a thesis of the degree of Master of Science.
……….
Res. Assist. Prof. Dr. Mustafa Özgür Güler (Co-Advisor)
I certify that I have read this thesis and that in my opinion it is fully adequate, in scope and in quality, as a thesis of the degree of Master of Science.
………. Prof. Dr. Engin U. Akkaya
I certify that I have read this thesis and that in my opinion it is fully adequate, in scope and in quality, as a thesis of the degree of Master of Science.
………. Prof. Dr. Tayfun Özçelik
Approved for the Institute of Engineering and Science: ……….
Prof. Dr. Levent Onural
iii
ABSTRACT
ELECTROSTATIC EFFECTS ON THE SELF-ASSEMBLY
MECHANISM OF PEPTIDE AMPHIPHILES
Sıla Toksöz
M.S. in Materials Science and Nanotechnology Thesis Advisor: Assist. Prof. Dr. Mustafa O. Guler
July 2010
Self-assembling peptide amphiphiles, synthesized through solid phase peptide synthesis – a bottom-up approach, have been used with various tissue engineering purposes. Peptide amphiphile molecules self-assemble into nanofibers, which form three dimensional networks mimicking the extracellular matrix. Electrostatic interactions affect the formation of nanofibers. The effect of charged groups on the peptides on nanofiber formation were studied in this work. Neutralization of the charged groups by pH change, electrolyte addition or addition of oppositely charged biomacromolecules triggered the aggregation of the peptides. To understand the controlled formation of the gels composed of peptide nanofibers better can help the researchers develop bioactive collagen mimetic nanofibers for tissue engineering studies and use them in angiogenesis. Results obtained by Fourier Transform Infrared Spectroscopy (FT-IR), Circular Dichroism (CD), Rheology, pH titration, Atomic Force Microscopy (AFM),
iv
Scanning Electron Microscopy (SEM) and Transmission Electron Microscopy (TEM); as well as the potential of using the peptide amphiphile molecules to promote angiogenesis, are described.
Keywords: Self-Assembly, Nanofiber, Peptide, Gel, Peptide Amphiphile, Angiogenesis
v
ÖZET
PEPTĠT AMFĠFĠLLERĠN KENDĠLĠĞĠNDEN
DÜZENLENMESĠNDE ELEKTROSTATĠK ETKĠLEġĠMLERĠN
ETKĠLERĠ
Sıla Toksöz
Malzeme Bilimi ve Nanoteknoloji Programı, Yüksek Lisans Tez Yöneticisi: Yard. Doç. Dr. Mustafa Özgür Güler
Temmuz 2010
Katı hal peptit sentezi yöntemi ile üretilmiĢ kendiliğinden düzenlenen peptit amfifiller, doku mühendisliği çalıĢmaları için kullanılmaktadır. Peptit amfifil molekülleri nanofiber olarak düzenlenir, bu nanofiberler de ekstraselüler matriks benzeri üç boyutlu ağlar oluĢtururlar. Elektrostatik etkileĢimler nanofiber oluĢumu üzerinde etkilidirler. Peptit üzerindeki yüklerin nanofiber oluĢumundaki etkileri bu araĢtırmada çalıĢılmıĢtır. pH değiĢikliği, ya da zır yüklü elektrolit ve biyomakromoleküllerin eklenmesiyle, yüklü grupların nötralizasyonu ve peptit agregasyonunu sağlanmıĢtır. Peptit nanofiber jellerinin kontrollü oluĢumunu anlamak, kolajen benzeri biyoaktif yapılar üretilip bunların doku mühendisliği ve anjiyojenez çalıĢmalarında kullanılmalarını mümkün
vi
kılacaktır. Fourier Transform Kızılötesi Spektroskopisi (FT-IR), Circular Dichroism (CD), Reoloji, pH titrasyonu, Atomik Kuvvet Mikroskopu (AFM), Taramalı Elektron Mikroskopu (SEM), Geçirmeli Elektron Mikroskopu (TEM) sonuçları ve peptit amfifil moleküllerinin anjiyojenez amaçlı kullanım olasılıkları anlatılmaktadır.
Anahtar Kelimeler: Kendiliğinden düzenlenme, Nanofiber, Peptit, Jel, Peptit amfifil, Anjiyojenez
vii
ACKNOWLEDGEMENT
I would like to express my thanks to my supervisor Assist. Prof. Dr. Mustafa Özgür Güler for his guidance and support during the course of this research. I am also grateful to him for teaching us how to become a good scientist.
I would like to thank to Rashad Mammadov for his partnership in this research, and for having taken SEM and AFM images.
I would like to express my special thanks to Assist. Prof. Dr. AyĢe B. Tekinay for her support and sharing her knowledge.
I want to thank to my group members Handan Acar, Selim Sülek, Ruslan Garifullin, Selma Bulut, BüĢra Mammadov, Yavuz Selim DağdaĢ and Hakan Ceylan. It was wonderful to work with them.
I would like to thank to UNAM (National Nanotechnology Research Center) and TÜBĠTAK (The Scientific and Technological Research Council of Turkey) for financial support.
Finally, I want to express my gratitude to Can Ataca and my family for their love, support, and understanding. I owe them a lot.
viii
LIST OF ABBREVIATIONS
PA: Peptide Amphiphile
ECM: Extracellular Matrix
FMOC: 9-Fluorenylmethoxycarbonyl
BOC: ter. Butoxycarbonyl
MTT: 4-Methyltrityl HBTU: 2-(1H-Benzotriazol-1-yl)-1,1,3,3-tetramethyluronium hexafluorophosphate DIEA: N, N-Diisopropylethylamine DMF: Dimethylformamide THF: Tetrahydrofuran
TFA: Trifluoroacetic Acid
LC-MS: Liquid Chromatography-Mass Spectrometry
AFM: Atomic Force Microscopy
TEM: Transmission Electron Microscopy
FT-IR: Fourier Transform Infrared Spectroscopy
ix CD: Circular Dichroism
x
TABLE OF CONTENTS
ABSTRACT ACKNOWLEDGEMENTS TABLE OF CONTENTS LIST OF FIGURES LIST OF TABLES INTRODUCTION ... 1 1.1 Introduction ... 11.2 Solid Phase Peptide Synthesis ... 4
1.3 Self-Assembly of Peptide Amphiphiles ... 6
1.4 Effects of Electrostatic Interactions on Self-Assembly of Peptide Amphiphiles ... 9
1.5 Peptide Amphiphiles for Angiogenesis... 11
EXPERIMENTAL SECTION ... 13
2.1 General Methods ... 13
2.2 Materials ... 13
2.3 Synthesis of Peptide Amphiphiles ... 14
xi Circular Dichroism (CD)
Fourier-Transform Infrared Spectroscopy (FT-IR)
pH Titration
Zeta Potential
Atomic Force Microscopy (AFM)
Scanning Electron Microscopy (SEM)
Transmission Electron Microscopy (TEM)
RESULTS AND DISCUSSIONS ... 18
3.1 Electrostatic Effects on Self-Assembly ... 15
3.2 Self-Assembling PA molecules in Angiogenesis ... 43
CONCLUSION ... 56
REFERENCES ... 58
xii LIST OF FIGURES
Figure 1. Solid Phase Peptide Synthesis Diagram ... 8
Figure 2. The chemical representation of PAs for the study of electrostatics effects ... 19
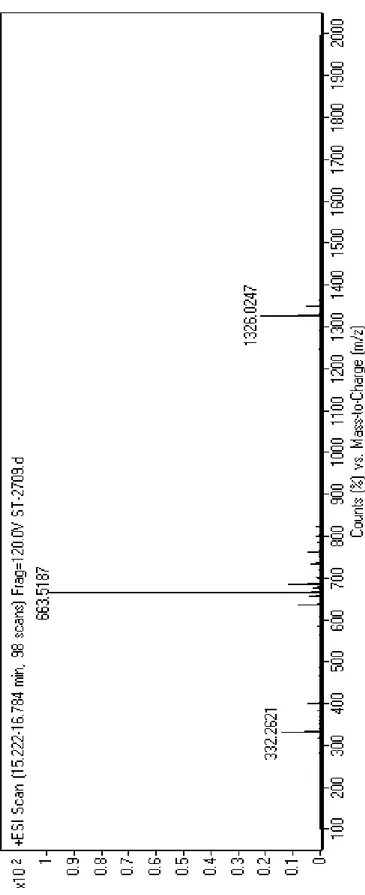
Figure 3. Mass spectrometry of the Lys-PA ... 21
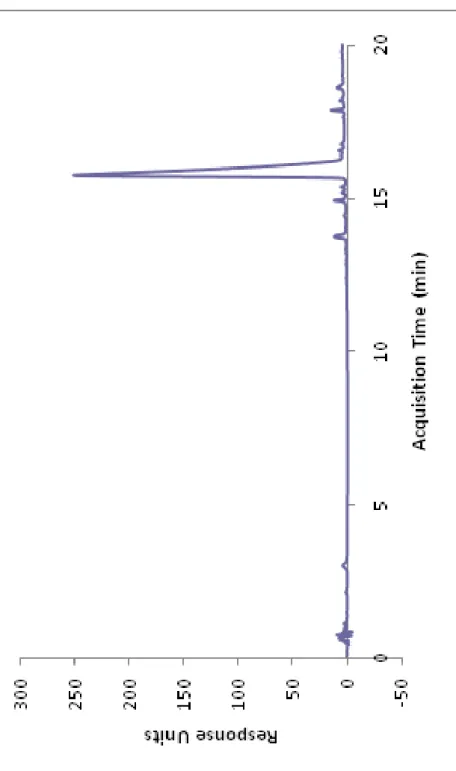
Figure 4. RP-HPLC chromatogram of the Lys-PA. ... 22
Figure 5. Mass spectrometry of the His-PA. ... 23
Figure 6. RP-HPLC chromatogram of the His-PA. ... 24
Figure 7. Mass spectrometry of the Asp-PA. ... 25
Figure 8. RP-HPLC chromatogram of the Asp-PA. ... 26
Figure 9. pH dependent Zeta Potential measurements ... 29
Figure 10. pH titration curves of PAs ... 30
Figure 11. SEM, TEM and AFM images of Asp-PA with Ca++. ... 31
Figure 12. SEM, TEM and AFM images of Asp-PA a,t pH 2 ... 32
Figure 13. SEM, TEM and AFM images of His-PA at pH 7 ... 33
Figure 14. SEM, TEM and AFM images of Lys-PA at pH 10 ... 34
xiii
Figure 16. SEM, TEM and AFM images of Lys-PA with DNA. ... 36
Figure 17. SEM, TEM and AFM images of Lys-PA with Asp-PA ... 37
Figure 18. FT-IR spectra of lyophilized PA gels ... 39
Figure 19. CD spectra of PA solutions ... 40
Figure 20. Oscillatory rheology measurements of the PA gels ... 42
Figure 21. The chemical representation of PAs ... 44
Figure 22. Mass spectrometry of the Sulfo-PA ... 45
Figure 23. RP-HPLC chromatogram of the Sulfo-PA. ... 46
Figure 24. CD spectra of PA solutions ... 47
Figure 25. Oscillatory rheology measurements of the PA gels ... 48
Figure 26. Isothermal titration calorimetry measuring the binding of VEGF to heparin ... 50
Figure 27. Isothermal titration calorimetry measuring the binding of VEGF to Asp-PA ... 51
Figure 28. Isothermal titration calorimetry measuring the binding of VEGF to Asp-PA & Ca++. ... 52
Figure 29. Isothermal titration calorimetry measuring the binding of VEGF to Lys-PA. ... 53
xiv
Figure 30. Isothermal titration calorimetry measuring the binding of VEGF to Sulfo-PA. ... 54
Figure 31. Isothermal titration calorimetry measuring the binding of VEGF to Asp-PA&Lys-PA. ... 55
xv LIST OF TABLES
1
CHAPTER 1
INTRODUCTION
1.1
Introduction
With the increasing life span thanks to the advances in the medical field, the incidence of age-related illnesses has largely increased in the late 20th and early 21st centuries. The organs and tissues, after serving for a specific time, do fail. Genetics and environmental effects have a role in this process but the main causes are still unknown. To change the non-functional parts of the body with functional ones in large scale has been the dream of humanity, and we are close to it than ever. However, the number of people who need transplants is far greater than available organs and tissues. Therefore, some other methods to fill the gap between patients and available transplants have been proposed, such as producing organs in laboratory or making the body cure itself by the aid of synthetic and natural materials. Tissue engineering allows scientists to produce scaffolds from synthetic or natural materials and use them for the growth and differentiation of the cells into desired tissues.
Complex biological processes like development, immune response, wound healing are controlled by the adhesion of cells to extracellular matrix proteins, effecting through dynamic and specific regulation of cellular
2
behavior1. To have control over cell attachment, proliferation and differentiation, scaffolds used in tissue engineering should mimic the extracellular matrix. Extracellular matrix, which consists of proteins and proteoglycans, is an elastic network surrounding and supporting cells, as well as providing adhesion sites for cells. A widely mimicked component of the matrix is collagen2. Collagen has been employed in various applications ranging from biocompatible coatings3 to tissue engineering4 and drug delivery5. It serves as a structural and organizational framework for many types of tissues including cartilage, bone, tendon, blood vessels, skin, and fascia; collagen is the main structural part of the connective tissue6. It promotes adhesion of cells and mediates intracellular signals critical to tissue functioning7-8. There are many natural and synthetic polymers which are used as biomaterials; however, the characteristics of collagen as a biomaterial are different compared to those polymers, mainly in its mode of interaction in the body9. Collagen has a better biocompatibility and biodegradability rate, and a lower antigenicity10 compared to other polymers such as albumin and gelatin. The health concerns related to the source of natural collagen, and the desire to enhance the biological functions of collagen, have resulted in studies where the researchers try to generate scaffolds and biomaterials mimicking natural collagen11-12.
When wounds have formed as a result of surgical application of biomaterials as tissue replacement or some other reason, angiogenesis might contribute in faster healing. Wound healing is a very complex process of
3
different stages, one stage being angiogenesis.
Scaffolds based on collagen mimicking materials are promising candidates to promote angiogenesis13-14. Vascular endothelial growth factor (VEGF) plays a central role in the angiogenesis process associated with cancer. Endothelial cell migration and proliferation are usually observed in the extracellular matrix during this process. VEGF and its mimicks have been used as inducers of angiogenesis in numerous studies15-17, and VEGF antagonists have been shown to inhibit angiogenesis18-19.
Heparin and heparan sulfate belong to heparin/heparan sulfate-like glycosaminoglycans (HSGAGs), which are known to interact with VEGF in the angiogenesis process. The sulfate and acetyl groups are known to participate in the binding; however, electrostatic interactions might also contribute to interactions, as in the case of IdoA residues of heparin and heparan sulfate20.
Designing structures, which bear sulfate groups and are able to take part in electrostatic interactions, will aid researchers develop heparin-mimicking structures to be used as angiogenesis promoters by bringing the target proteins already found in the tissue to local sites, which is advantageous over the direct use of proteins by means of price and availability.
4
1.2
Self-Assembly Mechanism
In “top-down” approaches, bulk materials are processed to form nanostructures. Lithography, a top-down approach, can be used to produce patterns to promote cell growth; etching techniques can be employed to roughen metallic implants. These methods have some limitations in the processing of the starting materials and in the size of features.
Bottom-up approaches, on the other hand, offer many features of different sizes and shapes. Self-assembly, an example of bottom-up methods, is the ordering of small molecules into larger molecules through non-covalent interactions. Theoretical understanding of the self-assembly principles in living organisms has contributed to the opportunities self-assembling materials offer for the design of new materials, in fields such as regenerative medicine21-23, electronics24-26 and optics27.
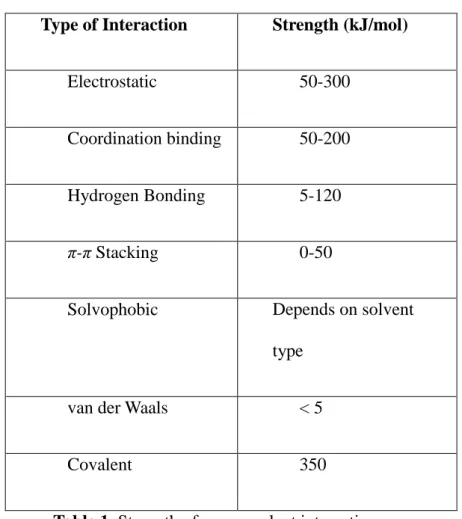
Examples of self-assembly can be observed in nature, where complex structures such as folded proteins, double helices of DNA and lipid membranes form without chemical reactions. The non-covalent forces acting in the self-assembly are hydrogen bonding, hydrophobic effects, electrostatic effects, and van der Waals forces that are employed by nature to form biological objects in nanoscale constituting from as few as two molecules to thousands of molecules. These interactions are very dynamic and usually delicate because of their relatively weak nature, the strength of the forces varies from less than 5 kJ mol−1 for van der Waals interactions to up to 120 kJ mol−1 for hydrogen bonding, much less than the covalent bonds
5
which can have energies up to 400 kJ mol−1 28. Nevertheless, a number of these weak interactions are strong enough to hold the molecules together and yield a stable assembly. Interactions between molecules and cells, to name a few ligand-receptor, cell-surface, and protein-protein interactions, occur in nanoscale and it is this ability and knowledge the tissue engineers would like to acquire and simulate in laboratory.
Type of Interaction Strength (kJ/mol)
Electrostatic 50-300
Coordination binding 50-200
Hydrogen Bonding 5-120
π-π Stacking 0-50
Solvophobic Depends on solvent type
van der Waals < 5
Covalent 350
Table 1. Strength of non-covalent interactions
So far, the use of a broad range of nanostructures including peptide nanofibers29, carbon nanotubes30-31, inorganic nanoparticles32, and
6
dendrimers33-34 in areas like disease diagnostics, drug delivery and regenerative therapy has been investigated.
Peptides provide a unique and tailorable platform for designing self-assembling nanostructures. The selection of the amino acids determines the final secondary, tertiary and quaternary structures through folding and hydrogen bonding. Peptides are also attractive due to their biocompatibility and biodegradability.
The synthesis of peptides had been done by solution-phase synthesis for a long time. With the invention of solid phase peptide synthesis (SPPS), the use of solution-phase synthesis diminished, although it is still used for large-scale industrial production of peptides. For incorporation of unnatural amino acids into the sequence, modification of the peptide backbone, synthesis of D-peptides, and synthesis of the peptides which are difficult to express in bacteria, solid phase peptide synthesis method is widely employed.
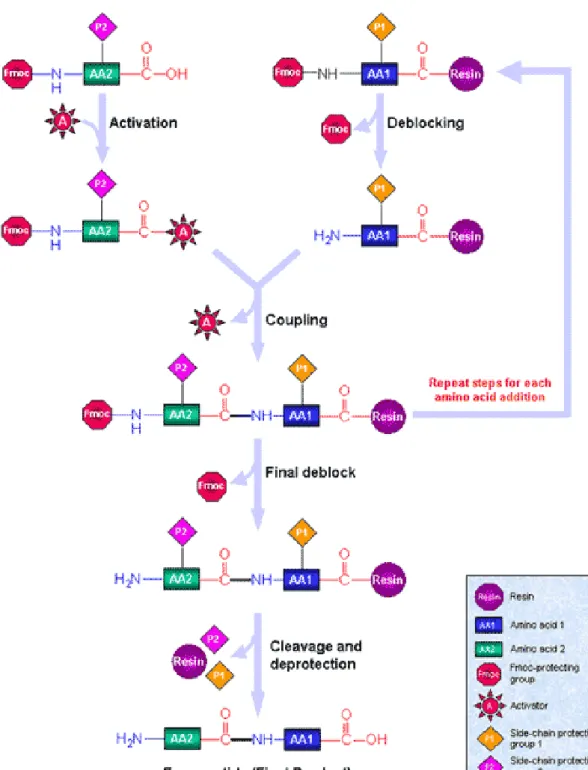
1.3 Solid Phase Peptide Synthesis
R. B. Merrifield, nearly a half century ago, proposed the so-called “Solid Phase Peptide Synthesis” method to prepare a tetrapeptide via one-by-one addition of benzyloxycarbonyl amino acids to a polystyrene resin35. He also synthesized amino acids protected with t-butoxycarbonyl groups. This method is inexpensive, rapid and simple. With time, the method has been improved by using different types of solvents, reagents and protecting
7
groups. 9-fluorenylmethoxycarbonyl (Fmoc) is one of the protecting groups, and it has been employed in this study to protect the N-terminus.
First, the insoluble resin is deprotected from the Fmoc group, which is base-labile, usually piperidine is used for this purpose. Afterwards, the first amino acid is attached to the resin. Deprotecting the Fmoc group from the first amino acid, the second amino acid is added and this procedure repeats until a desired number of amino acids is obtained. After each coupling, the resin is washed with acetic anhydride to get rid of excess reagents and improve the purity. In the final step, the peptide is deprotected and TFA cleavage is done to detach the peptide from the support resin.
The peptides in this study have been constructed from enantiomerically pure amino acids with differing chirality via solid phase synthetis technique. Constructing peptides on an insoluble solid support has made the separation of the peptide from soluble reagents and the removal of excess reagents easier, minimized material loss and maximized yield.
The polymerization approach has been used widely, however it has some disadvantages such as lacking control over the molecular weight of the final product and sequence diversity. The development of solid phase synthesis contributed to the production of collagen mimetic materials. Peptides having differing chain lengths and sequences can be synthesized by this synthesis method.
8
Figure 1. Solid Phase Synthesis Diagram. Reproduced with permission from Sigma-Aldrich.
9
1.4
Effects of Electrostatic Interactions on Self-assembly
of Peptide Amphiphiles
Peptides present a unique platform for self-assembling nanostructures.
β-sheet forming ones attract particularly interest by their ability to use hydrogen bonding to form one-dimensional nanostructures36.
Peptide amphiphile molecules are an example of peptides, which through
β-sheet formation, self-assemble into fibrillar structures and form self-supporting three dimensional networks which can mimic the extracellular matrix. The conical shape of the molecule is suggested to contribute to the formation of a fibrillar structure instead of a micellar one. Hydrophilic peptide portion of the molecule presents itself on the outside of the fiber in water, hydrophobic carbon tail position ns inside the fiber; forming nanofibers around 8-10 nm in diameter and up to a few micrometers in length. (Figure) The driving force is based on intermolecular hydrogen bonding and hydrophobic collapse of the alkyl tail. In physiological media, charged groups in the sequence become neutralized by electrolytes, so the electrostatic repulsion decreases; then, the hydrophobic collapse makes the alkyl tails aggregate to protect themselves from the aqueous environment, and parallel to the long axis of the fibers, hydrogen bonding occurs37.
During the design of the peptides, biological signaling sequences can be incorporated in the sequence to obtain biological activity. Another way of
10
obtaining biological activity can be achieved though pH- and salt-responsive design.
pH- and salt-responsive design ability enables the use of the peptide amphiphile molecules in minimally invasive therapies, where encountering electrolytes and biomolecules such as lipids, carbohydrates and nucleic acids in the tissue can induce self-assembly of the nanofibers and formation of three dimensional networks which contain preferred loads. This strategy is useful for functionally mimicking biomacromolecules.
Interactions between headgroups have been computationally simulated to show that electrostatic interactions prevail the hydrophobic interactions between alkyl tails and determine the final cylindrical structure38. As opposed to electrostatic interactions in conventional micelles, the interactions are attractive between hydrophilic groups of peptide amphiphiles. In the same study, the effects of low and high pH have also been studied.
Understanding the effects of electrostatic interactions on the self-assembly of peptide amphiphiles will help us to generate more efficient networks and scaffolds for a variety of applications. In this study, we aim to see the electrostatic and charge screening effects on peptide amphiphile self-assembly experimentally, which is induced by salt ions, macromolecules and pH change.
11
1.5
Peptide Amphiphiles for Angiogenesis
Wound healing comprises several overlapping phases, which involve different cells and growth factors. The first phase, named as inflammatory phase, includes haemostasis and inflammation39. Haemostasis is maintained by vasoconstriction, platelet plug formation, and blood coagulation. Vasoconstriction occurs immediately after the injury to prevent blood loss. Fibrin clot, which serves as a shield against bacteria and a scaffold for infiltrating cells until the healing occurs, is formed afterwards. Formation of fibrin clot is induced by mediators such as prostaglandins and thromboxanes released from ruptured cell membranes40. At the same time, platelets come to the wound and form platelet plugs, again to prevent blood loss39. Platelets release several chemotactic molecules and growth factors attracting the circulating immune cells such as neutrophils and macrophages to the wound. Neutrophils eliminate foreign bodies, dead tissue and damaged ECM by phagocytosis and release of proteases41. After 2 days, blood and tissue monocytes differentiate into wound macrophages. Macrophages take part in the removal of bacteria, bacteria-containing neutrophils, damaged cells and matrix. They also release growth factors that induce fibroplasia and angiogenesis. Macrophage appearance at the wound site indicates the end of the inflammatory phase and the start of the proliferative phase. During this phase, re-epitheliazation occurs by migration of the keratinocytes from the dermal layer.
Angiogenesis, formation of new blood vessels, is another important step for the formation of new tissues. VEGF-A and FGF-2 induce angiogenesis39.
12
Fibroblasts migrate from wound edges and some of them differentiate into myofibroblasts. Myofibroblasts are contractile, so bring the edges of the wound together to minimize the required amount of the matrix for the healing process. Fibroblasts and myofibroblasts interact and induce the formation of the ECM by collagen production. In the last phase, tissue remodeling, all processes slow down and cells undergo apoptosis. Collagen matrix is remodeled from type I to type III, and collagen fibrils form bundles giving rise to stronger tissues.
The enhancement of angiogenesis is promising for the treatment of ischaemic diseases of the heart, peripheral vasculature, and chronic wounds42. HSGAGs are negatively charged, polydisperse molecules consisting of dimeric repeats of glucosamine and uronic acid residues with varying sulfation degress43. They are known to interact with proteins in physiological processes, including angiogenesis. Two types of HSGAGs are heparin and heparan sulfate. They are structurally similar but different in their sulfation degree. Heparin hs more sulfates compared to heparan43. Both molecules activate angiogenic growth factors. To learn more about the nature of the interaction between HSGAGs and proteins will allow the researchers develop successfully functioning mimicks for tissue engineering. We designed heparin-mimicking molecules to capture many potent signaling proteins, of which VEGF is an example, to promote angiogenesis.
13
CHAPTER 2
EXPERIMENTAL SECTION
2.1 General Methods
Peptide amphiphiles were characterized by liquid chromatography-mass spectrometry (LC-MS). Mass spectrum was obtained with Agilent LC-QTOF-MS equipped with Agilent Zorbax Extend-C18 2.1 x 50 mm column for negative molecules and Zorbax SB-C8 4.6 mm x 100 mm column for positive molecules. A gradient of (a) water (0.1% formic acid or 0.1% NH4OH) and (b) acetonitrile (0.1% formic acid or 0.1% NH4OH) was used. For purification of the molecules, reverse-phase HPLC system with Zorbax Extend-C18 21.2 x 150 mm column for negative molecules and Zorbax SB-C8 21.2 x 150 mm column for positive molecules was employed. A gradient of (a) water (0.1% TFA or 0.1% NH4OH) and (b) acetonitrile (0.1% TFA or 0.1% NH4OH) was used.
2.2 Materials
9-Fluorenylmethoxycarbonyl (Fmoc) and ter. Butoxycarbonyl (Boc) protected amino acids, Rink Amide MBHA resin and 2-(1H-Benzotriazol-1-yl)-1,1,3,3-tetramethyluronium hexafluorophosphate (HBTU) were purchased from
14
NovaBiochem and ABCR. Heparin was purchased from Sigma-Aldrich. Sheared Salmon Sperm DNA was purchased from Ambiogen. The other chemicals were purchased from Fisher, Merck, Alfa Aesar or Aldrich. All chemicals were used as provided.
2.3 Synthesis of Peptides
Peptides were constructed on Rink Amide MBHA resin. Amino acid couplings were done with 2 equivalents of Fmoc protected amino acid, 1.95 equivalents HBTU and 3 equivalents of N,N-Diisopropylethylamine (DIEA) for 2 hours. Fmoc deprotections were performed with 20% Piperidine/DMF (Dimethylformamide) solution for 20 min. Cleavage of the peptides from the resin was carried out with a mixture of TFA:TIS:H2O in ratio of 95:2.5:2.5 for 2 hours. Excess TFA was removed by rotary evaporation. The remaining viscous peptide solution was triturated with ice-cold ether and the resulting white product was dried under vacuum.
2.4 Characterization of Peptide Amphiphiles
Oscillatory Rheology
Oscillatory rheology measurements were performed with Anton Paar Physica RM301 Rheometer operating with a 25 mm parallel plate configuration at 25 °C. Each sample of 100 uL total volume with a final peptide concentration
15
of 1 wt % was carefully loaded on the center of the lower plate and waited for 15 min before measuring. After equilibration, the upper plate was lowered to a gap distance of 0.5 mm. Storage moduli (G′) and loss moduli (G″) values were scanned from 100 rad/s to 0.1 rad/s of angular frequency, with a 0.5% shear strain.
Circular Dichroism
JASCO J815 CD spectrapolarimeter was used at room temperature. 2x10⁻⁴ M samples were measured from 300 nm to 190 nm, data interval and data pitch being 0.1 nm, scanning speed being 100 nm/min, all measurements with three accumulations. D.I.T. was selected as 1 sec, band width as 1 nm, and the sensitivity was standard.
FT-IR
1 mg of 1 wt % lyophilized PA gel was grinded with 99 mg KBr until very fine powders were obtained. The finely ground mixtures were sandwiched between two stainless steel disks and hydraulic press was applied up to 7 atm. The FT-IR measurement was performed with Bruker Tenson 27 FT-IR spectrometer at the transmittance mode. The background spectrum was subtracted from the original spectrum.
Zeta Potential and pH Titration
Zeta potential measurements were performed with Malvern Nano-ZS zetasizer equipped with a titrator and pH meter for 0.06 wt % peptide amphiphile solutions. Smoluchovski approach was used to calculate the Zeta
16
Potential values. pH titration was done by adding 0.1 M HCl or NaOH to the appropriate solutions.
Atomic Force Microscopy (AFM)
The AFM samples were prepared by mixing 25 µL of PA solution of 0.025 or 0.075 wt % final concentration with oppositely charged peptides, biomacromolecules or cations on a silicon wafer that had been cleaned by ethanol and dried at room temperature. DNA and heparin were mixed with PAs in a 1:3 ratio (0.025% DNA/Heparin with 0.075% PA). Asp-PA (0.025 wt %) and Lys-PA (0.025 wt %) were mixed in a 1:2 molar ratio. Asp-PA was mixed with calcium ions (CaCl2) in a 1:2 molar ratio. Sample solutions were dropped on the silicon wafer surface and mixed by pipetting up and down. After 30 seconds, solvent on the wafer was removed by using dust-free paper towel and the rest was air-dried. Contact mode atomic force microscopy (AFM) was performed by using model MFP-30 from Asylum Research. All images were taken with 0.5 Hz scan rate. Tips with resonance frequency of 13 kHz and spring constant of 0.2 N/m were used in all experiments.
Scanning Electron Microscopy (SEM)
100 μl of PA gels with a final concentration of 1 wt% were placed on a metal mesh, dried at critical point (1072 Psi, 31 ºC) with Tousimis Autosamdri-815 B, Series C critical point dryer and coated with 6 nm Au-Pd. SEM imaging was performed with FEI Quanta 200 FEG, using the ETD detector at high vacuum mode with 30 keV beam energy.
17 Transmission Electron Microscopy (TEM)
TEM was performed with FEI Tecnai G2 F30. Diluted samples were placed on a Lacey mesh ultrathin carbon coated copper grid. 2 wt % uranyl acetate solution or phosphotungstic acid solutions were used for positive and negative staining, respectively. The grid was put onto 1 wt % PA gel upside down for 1 min. Then, the grid was washed to remove excess coating and was put over the staining solution for 15 min. After the staining, the grids were dried in the fume hood at room temperature overnight.
Isothermal Titration Calorimetry (ITC)
Isothermal titration calorimetry was performed with MicroCal Auto-ITC200 device, having 4.4x10⁻⁸ M of VEGF in the syringe and 2.2x10⁻⁹ M of heparin or sample in the cell, both in water. Raw data of heat released vs. molar ratio were obtained, and were integrated after background correction and fit to a curve for a single type of binding site to obtain a binding constant.
18
CHAPTER 3
RESULTS AND DISCUSSIONS
3.1. Electrostatic Effects on Self-Assembly
In order to better understand the self-assembly mechanism, three peptide amphiphiles (PA) were designed and synthesized by solid phase peptide synthesis method and mixed with various molecules of opposite charge to explore the effect of electrostatic interactions on the nanofiber formation (Figure 1). The lauric acid adds hydrophobic character to peptide amphiphiles, contributing to the hydrophobic driving force of the self-assembly. The peptide part consists of four nonpolar amino acid residues, forming the β-sheet module; and a charged amino acid for solubility and charge control. Lys-PA (Lauryl-VVAGK-Am) was designed to have a lysine residue at its N-terminus; as it was positively charged at acidic conditions, it formed gels upon increasing the pH and mixing with both negatively charged macromolecules (e.g. heparin and DNA), and by addition og Asp-PA (Lauryl-VVAGD), a negatively charged PA at neutral conditions, and by making the pH basic. His-PA (Lauryl-VVAGH-Am) was designed with a histidine residue making it soluble in acidic solutions and gel above pH 6.5. Asp-PA (Lauryl-VVAGD) is a negatively charged PA at
19
20
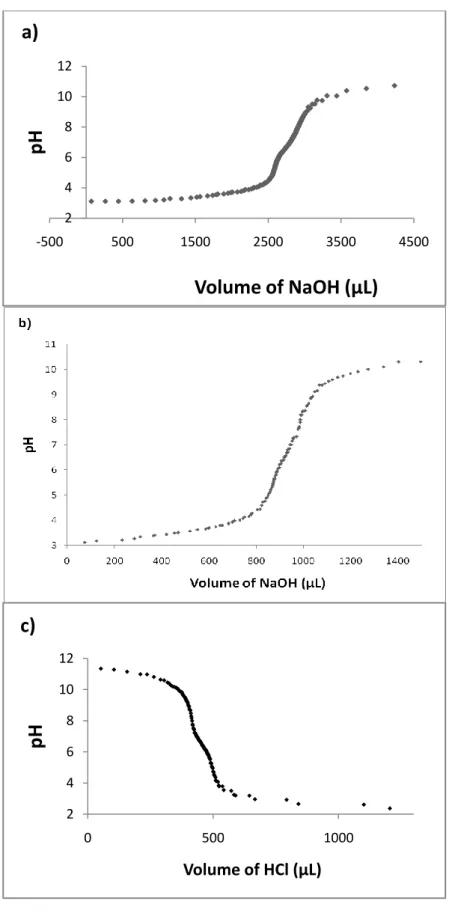
basic conditions and formed gels in the presence of calcium ions and positively charged molecules at neutral pH, as well as at low pH conditions. The mass spectrometry and the HPLC chromatgorams can be seen in Figures 3-8. The self-assembly of the PA molecules was studied by zeta potential measurements to determine the charges over peptides (Figure 9) and titration curves to determine the pKa transitions of ionizable groups at self-assembly conditions (Figure 10). The ionizable groups for Lys-PA are amine groups, the ε-amine of lysine, reported to have a pKa of 10.5. The pKa from the titration curve can be inferred as pH 6.0 - 6.5; it belongs to the ε-amine of lysine in the peptide backbone and is shifted downwards. The titration curves for L-Lysine and poly-L-Lysine are shown to be horizontal at pH values above 844. There is an ionizable imidazole side chain on the His-PA and its neutralization was observed around pH 6.5 (Figure 10b). The Asp-PA has two carboxylic acid groups at the C-terminal and the side chain. The pKa transition values of aspartic acid are 3.9 and 9.8, for the C-terminal and side chain respectively; the value of one of the carboxyl groups is shifted as can be seen from the graphic. In the literature, such shifts have been seen in other peptide amphiphiles as well45-46. The shifts can be explained by aggregation of the molecules, which changes the apparent pKa values of the acid and amine groups45. The protonation/deprotonation of ionizable groups must have occurred slowly, as can be understood from the curves with transitions over wide ranges. The Lys-PA and His-PA are positively charged charged at pH lower than 5, whereas Asp-PA is negatively charged
21
22
23
24
25
26
27
at pH over 5. Zeta potential measurement demonstrated the charge of the solutions, as well as their stability. High positive or negative zeta potential makes the molecules repel each other so they don’t coagulate. If the zeta potential is low, then there will be no force to prevent the flocculation of molecules. Values above +30 mV or below -30 mV are considered to represent sufficient repulsion between molecules to ensure physical stability. The Lys-PA solution becomes more negative with increasing pH by adding alkali solution. It doesn’t start to coagulate until a pH close to 10 is reached as the charges are not fully neutralized. The Asp-PA solution is unstable below pH 4, as there are not sufficient negative charges present. The His-PA solution reveals a different profile; it normally gelates around pH 6.5, and the system starts to lose stability after pH 7; however, it is not until pH 9 that its zeta potential becomes lower than 30 mV. These results are consistent with the gelation behaviors of the PA molecules.
The self-assembly of the PA molecules was characterized by various microscopy imaging techniques. The charged residues of PAs interact with oppositely charged ions and molecules, and the PAs assemble into nanofibers with diameters about 8 nm and lengths up to a few microns as revealed by TEM and AFM. For Lys-PA samples, the charge screening of the amine group by hydronium ions (Figure 12b and 12c), heparin (Figure 13b and 13c), DNA (Figure 14b and 14c) or the aspartate moiety of the Asp-PA (Figure 15b and 15c) resulted in aggregation of the molecules, and formation of nanofibers. The screening of the charges on the carboxyl groups of the Asp-PA by calcium ions (Figure 11b and 11c) or hydronium
28
ions (Figure 16b and 16c) minimized the electrostatic repulsion among the headgroups of the peptides, and made them come together and form fibers as well. The imidazole side-chain of histidine on the His-PA carries a positive charge at low pH but is neutralized at neutral and high pH and self-assemble into fibrillar structures (Figure 17). In some TEM images (Figure 17), plaque structures below fibers were observed. The samples for imaging were prepared by dehydrating and drying in air, this might have resulted in the fusion of nanofibers47 and as a result, in the formation of sheet-like structures.
AFM imaging revealed the formation of PA nanofibers depending on pH change (pH 2 for Asp-PA, pH 7 for His-PA and pH 10 for Lys-PA) or mixing with charged macromolecules (DNA, heparin with Lys-PA) and cations (Ca2+ with Asp-PA). Asp-PA with Ca2⁺ formed longer fibrils (Figure 11) compared to other peptide amphiphiles (Figures 12-17). Calcium presumably acts as a connector between the carboxyl groups of the aspartate residues, as proposed in another study.48 This might aid in the self-assembly process to produce stronger bonds and hence, a longer fibril (Figure 11b). Three-dimensional network of the nanofibers were observed by SEM (Figures 11a-17a).
29
Figure 9. pH dependent Zeta Potential measurements of a) Lys-PA titrated with 0.1 M NaOH, b) His-PA titrated with 0.1 M NaOH, and c) Asp-PA titrated with 0.1 M HCl.
-10 0 10 20 30 40 50 60 3 5 7 9 11 Ze ta Pot e n tial ( m V) pH
a)
-35 -15 5 25 45 3 5 7 9 11 Ze ta Pot e n tial ( m V) pHb)
-42 -32 -22 -12 -2 8 1 3 5 7 9 11 Ze ta Pot e n tial ( m V) pHc)
30
Figure 10. pH titration curves of PAs. a) Lys-PA titrated with 0.1 M NaOH, b) His-PA titrated with 0.1 M NaOH, c) Asp-PA titrated with 0.1 M HCl.
2 4 6 8 10 12 -500 500 1500 2500 3500 4500
pH
Volume of NaOH (µL)
a)
2 4 6 8 10 12 0 500 1000pH
Volume of HCl (µL)c)
31
32
33
34
35
36
37
38
FT-IR was used to analyze characteristic bands for hydrogen bonding belonging to peptides (Figure 18). The amide A band around 3300-3500 cm -1
and amide B band around 3100 cm-1are due to a Fermi resonance of the NH stretching vibration and the first overtone of the amide II. Amide I band, observed between 1600-1700 cm-1, is associated with the carbonyl stretching vibrations of the peptide backbone. Amide II results from the C-N stretching vibrations and NH deformation vibrations. Amide II band might have changing frequencies depending on the peptide conformation. Amide III vibration is conformationally highly sensitive. Amide III and Amide IV are often not used to gather information as they are very complex bands dependent on many factors. Amide V, amide VI and amide VIII modes are out-of-plane bending vibrations. The peaks around 1650 cm-1and 1693 cm-1can be attributed to parallel and antiparallel β -sheets, respectively. There are peaks around 1730 cm-1
in Asp-PA at pH 2, Asp-PA with Ca2⁺, and Lys-PA with Asp-PA with the strongest peak being observed at pH 2 sample, the carbonyl stretching vibration of aspartate side chain is known to generate a peak around those values49. Lysine side chain gives weak bands in infrared in neutralized state, making the bands difficult to assign. At 1228 cm-1, the asymmetric stretching of sulfate belonging to heparin is observed. No α-helical structures were observed in the FT-IR.
39
40
41
To understand the secondary structures and conformations of the PAs, circular dichroism (CD) spectroscopy was employed (Figure 19). When the structure of a molecule is chiral, there is a difference in the absorbance of right-handed polarized light versus left-right-handed polarized light. CD measures these absorbance differences, where the amide group forming the peptide backbone in regular environment acts as the chromophore in the far-UV region. The β-sheets display negative minimum at 218 nm and positive ellipticity at 195 nm.50 The Lys-PA at pH 7 with DNA and heparin contains predominantly β-sheet structure. At pH 10, Lys-PA displays a predominant β-sheet as well; similar to those of Asp-PA at pH 2 and Asp-PA/Ca2+. The His-PA at pH 7 has n→π* transition around 220 nm, indicating the presence of the β-sheet structure.
42
43
Mixing the PAs with oppositely charged ions and molecules, gel formation could be seen by the naked eye. The gel formation was characterized by oscillatory rheology measurements (Figure 20). The gelation point is the defining characteristic between a gel and a viscous liquid; at that point the storage modulus (G′) is higher than the loss modulus (G′). The storage moduli of all samples were significantly higher than their loss moduli, proving the gel formation. Three-dimensional scaffolds for tissue engineering should have adequate mechanical strength, which has been shown to affect the growth, differentiation and migration of cells51. Tissue elastic moduli start from 0.1 kPa for soft tissues and can reach up to GPas for hard tissues52. The Young’s moduli of the PA gels are within the range of moduli of elasticity of living tissues.
3.2. Self-assembling PA molecules in angiogenesis
We designed a heparin-mimicking peptide amphiphile (Sulfo-PA: C12 -VVAGEK-pbenzosulfonate) bearing a sulfate group to promote angiogenesis in the body. A heparin-mimicking structure can capture many signaling proteins taking part in angiogenesis. Two dumb peptides (Lys-PA and Asp-PA) containing no sulfate groups were used for see the effects of the sulfate group on binding. (Figure 21) Rheology was done to assess the mechanical strength of the structures. CD measurement showed us the secondary structures, and ITC measurements were done to determine whether the PA binds to VEGF specifically, and how strong the binding is. Mass spectrometry and RP-HPLC chromatograms can be observed in Figures 22-23.
44
45
46
47
48
49
Circular dichroism (CD) spectroscopy was employed to observe the secondary structures of peptide amphiphiles (Figure 24). All molecules exhibit a n→π* transition around 220 nm, so they have β-sheet structures.
PAs formed gels upon mixing with oppositely charged ions and molecules. The gel formation was characterized by oscillatory rheology measurements (Figure 25). The storage moduli of all samples were significantly higher than their loss moduli, indicating gel formation.
To verify the PA-VEGF binding affinity, isothermal titration calorimetry (ITC) was employed. Increments of VEGF in solution were titrated into heparin or PA in solution, and the released heat due to binding was measured. The data was integrated and fitted to obtain the association constants; then, plotted against the molar ratio of the molecules (Figures 26-31). The association constant indicates how strong the binding is, and can be compared to the values obtained from heparin-VEGF binding and the binding of other synthetic VEGF-binding peptides to VEGF. Comparing the results, all molecules seem to have similar association constants, which are close to the heparin-VEGF association constant. The strong binding of PAs not containing any sulfate group might be explained by the self-assembly of PA monomers at van der Waals density on the aggregates’ surfaces53
. ITC can also used to characterize the binding event, by
the values obtained like the Gibbs free energy change (ΔG), the enthalpy change
(ΔH) and entropy change of the interaction (ΔS)54
. As the enthalpy change is higher than the entropy change, we might conclude electrostatic interactions overcome the hydrophobic ones.
50
Figure 26. Isothermal titration calorimetry measuring the binding of VEGF to heparin.
51
Figure 27. Isothermal titration calorimetry measuring the binding of VEGF to Asp-PA.
52
Figure 28. Isothermal titration calorimetry measuring the binding of VEGF to Asp-Pa with Ca2+.
53
Figure 29. Isothermal titration calorimetry measuring the binding of VEGF to Lys-PA.
54
Figure 30. Isothermal titration calorimetry measuring the binding of VEGF to Sulfo-PA.
55
Figure 31. Isothermal titration calorimetry measuring the binding of VEGF to Asp-PA with Lys-PA.
56
CHAPTER 4
CONCLUSION
The peptide amphiphiles molecules were designed and synthesized to study the effects of charge screening in their self-assembly by various characterization methods. Peptide amphiphiles self-assemble into nanofibers, which provide useful three-dimensional scaffolds in their gelled form for tissue engineering. Rheology measurements show that the formed gels have enough strength to support some kind of soft tissue. Secondary structures of the peptides were investigated as well. By zeta potential measurements, the peptides have been shown to aggregate upon neutralization of the charged residues by mixing with ions or oppositely charged molecules; and the molecules were imaged with TEM, SEM and AFM to determine their diameter, length, density and other properties.
Electrostatic control of the molecules is very important in the development of minimally invasive injections with maximal functionality, where the PA molecules can be designed to have biologically active sequences and to self-assemble into nanofibers in the body upon encountering ions and molecules of opposite charge, or can be combined with bioactive molecules like DNA, glycosaminoglycans, and growth factors for self-assembling into biodegradable networks. Such systems will change the future of medicine by allowing to inject the PAs into the tissue and to induce self-assembly of functional peptide
57
sequences in situ to form versatile gelled networks which can encapsulate molecules and cells for various medical applications.
Peptide amphiphiles are promising candidates for mimicking various processes taking place in the body, such as angiogenesis. Vascular endothelial growth factor promotes angiogenesis by binding heparin like sequences. We designed heparin-mimicks which contain sulfate groups in their structure. This approach allows us to use peptides to induce angiogenesis by capturing the proteins to sites where they are needed, instead of applying them from outside, which might be very expensive. in vitro and in vivo experiments of angiogenesis and wound healing applications are continuing.
58
REFERENCES
(1) Hynes, R. O. Cell 1992, 69, 11.
(2) Pires, M. M.; Chmielewski, J. Journal of the American Chemical Society 2009, 131, 2706.
(3) Rammelt, S.; Illert, T.; Bierbaum, S.; Scharnweber, D.; Zwipp, H.; Schneiders, W. Biomaterials 2006, 27, 5561.
(4) CEN, L.; LIU, W.; CUI, L.; ZHANG, W.; CAO, Y. Pediatric Research 2008, 63, 492.
(5) Olsen, D.; Yang, C.; Bodo, M.; Chang, R.; Leigh, S.; Baez, J.; Carmichael, D.; Perälä, M.; Hämäläinen, E.-R.; Jarvinen, M.; Polarek, J. Advanced Drug Delivery Reviews 2003, 55, 1547.
(6) Reyes, C. D.; García, A. J. Journal of Biomedical Materials Research Part A 2003, 65A, 511.
(7) Heino, J. Matrix Biology 2000, 19, 319.
(8) McCarthy, J. B.; Vachhani, B.; Iida, J. Peptide Science 1996, 40, 371. (9) McPherson, J. M.; Sawamura, S.; Armstrong, R. Journal of Biomedical Materials Research 1986, 20, 93.
(10) Maeda, M.; Tani, S.; Sano, A.; Fujioka, K. Journal of Controlled Release 1999, 62, 313.
(11) Kar, K.; Amin, P.; Bryan, M. A.; Persikov, A. V.; Mohs, A.; Wang, Y.-H.; Brodsky, B. Journal of Biological Chemistry 2006, 281, 33283.
(12) Koide, T. Philosophical Transactions of the Royal Society B: Biological Sciences 2007, 362, 1281.
(13) Twardowski, T.; Fertala, A.; Orgel, J. P. R. O.; San Antonio, J. D. Current Pharmaceutical Design 2007, 13, 3608.
(14) Pieper, J. S.; Hafmans, T.; Wachem, P. B. v.; Luyn, M. J. A. v.; Brouwer, L. A.; Veerkamp, J. H.; Kuppevelt, T. H. v. Journal of Biomedical Materials Research 2002, 62, 185.
(15) Claffey, K. P.; Brown, L. F.; del Aguila, L. F.; Tognazzi, K.; Yeo, K.-T.; Manseau, E. J.; Dvorak, H. F. Cancer Research 1996, 56, 172.
(16) Wilting, J.; Christ, B.; Weich, H. A. Anatomy and Embryology 1992, 186, 251.
(17) Dvorak, H.; Brown, L.; Detmar, M.; Dvorak, A. Am J Pathol 1995, 146, 1029.
(18) Kim, K. J.; Li, B.; Winer, J.; Armanini, M.; Gillett, N.; Phillips, H. S.; Ferrara, N. Nature 1993, 362, 841.
(19) Aiello, L. P.; Pierce, E. A.; Foley, E. D.; Takagi, H.; Chen, H.; Riddle, L.; Ferrara, N.; King, G. L.; Smith, L. E. Proceedings of the National Academy of Sciences of the United States of America 1995, 92, 10457.
(20) Coombe, D. R.; Kett, W. C. Cellular and Molecular Life Sciences 2005, 62, 410.
(21) Hwang, J. J.; Iyer, S. N.; Li, L.-S.; Claussen, R.; Harrington, D. A.; Stupp, S. I. Proceedings of the National Academy of Sciences of the United States of America 2002, 99, 9662.
59
(22) Metzke, M.; O'Connor, N.; Maiti, S.; Nelson, E.; Guan, Z. Angewandte Chemie International Edition 2005, 44, 6529.
(23) Silva, G. A.; Czeisler, C.; Niece, K. L.; Beniash, E.; Harrington, D. A.; Kessler, J. A.; Stupp, S. I. Science 2004, 303, 1352.
(24) Forrest, S. R. Nature 2004, 428, 911.
(25) Jin, Y.; Friedman, N.; Sheves, M.; He, T.; Cahen, D. Proceedings of the National Academy of Sciences 2006, 103, 8601.
(26) Nguyen, S. T.; Gin, D. L.; Hupp, J. T.; Zhang, X. Proceedings of the National Academy of Sciences of the United States of America 2001, 98, 11849.
(27) Sanchez, C.; Arribart, H.; Giraud Guille, M. M. Nat Mater 2005, 4, 277. (28) Steed, J. W., Atwood, J.L.; Wiley: Chichester, 2000.
(29) Hartgerink, J. D.; Beniash, E.; Stupp, S. I. Science 2001, 294, 1684. (30) Harrison, B. S.; Atala, A. Biomaterials 2007, 28, 344.
(31) Tran, P. A.; Zhang, L.; Webster, T. J. Advanced Drug Delivery Reviews 2009, 61, 1097.
(32) Jamieson, T.; Bakhshi, R.; Petrova, D.; Pocock, R.; Imani, M.; Seifalian, A. M. Biomaterials 2007, 28, 4717.
(33) Gillies, E. R.; Fréchet, J. M. J. Drug Discovery Today 2005, 10, 35. (34) Lee, C. C.; MacKay, J. A.; Frechet, J. M. J.; Szoka, F. C. Nat Biotech 2005, 23, 1517.
(35) Merrifield, R. B. Journal of the American Chemical Society 1963, 85, 2149.
(36) Hartgerink, J. D.; Zubarev, E. R.; Stupp, S. I. Current Opinion in Solid State and Materials Science 2001, 5, 355.
(37) Velichko, Y. S.; Stupp, S. I.; de la Cruz, M. O. The Journal of Physical Chemistry B 2008, 112, 2326.
(38) Tsonchev, S.; Schatz, G. C.; Ratner, M. A. The Journal of Physical Chemistry B 2004, 108, 8817.
(39) Gurtner, G. C.; Werner, S.; Barrandon, Y.; Longaker, M. T. Nature 2008, 453, 314.
(40) Stadelmann, W. K.; Digenis, A. G.; Tobin, G. R. The American Journal of Surgery 1998, 176, 26S.
(41) Martin, P. Science 1997, 276, 75.
(42) Folkman, J.; Klagsbrun, M. Science 1987, 235, 442.
(43) Varki, A., Cummings, R., Esko, J., Freeze, H., Hart, G., Marth, J.; Cold Spring Harbor Laboratory Press: Plainview, New York, 1999.
(44) Ohsaki, M.; Okuda, T.; Wada, A.; Hirayama, T.; Niidome, T.; Aoyagi, H. Bioconjugate Chemistry 2002, 13, 510.
(45) Behanna, H. A.; Donners, J. J. J. M.; Gordon, A. C.; Stupp, S. I. Journal of the American Chemical Society 2005, 127, 1193.
(46) Tang, C.; Smith, A. M.; Collins, R. F.; Ulijn, R. V.; Saiani, A. Langmuir 2009, 25, 9447.
(47) Zhang, S.; Greenfield, M. A.; Mata, A.; Palmer, L. C.; Bitton, R.; Mantei, J. R.; Aparicio, C.; de la Cruz, M. O.; Stupp, S. I. Nat Mater 2010, 9, 594.
(48) Graveland-Bikker, J. F.; Ipsen, R.; Otte, J.; de Kruif, C. G. Langmuir 2004, 20, 6841.
(49) Barth, A. Progress in Biophysics and Molecular Biology 2000, 74, 141. (50) Greenfield, N. J. TrAC Trends in Analytical Chemistry 1999, 18, 236.
60
(51) Ingber, D. E.; Dike, L.; Hansen, L.; Karp, S.; Liley, H.; Maniotis, A.; McNamee, H.; Mooney, D.; Plopper, G.; Sims, J.; Wang, N. In International Review of Cytology; Richard, G., Ed.; Academic Press: 1994; Vol. Volume 150, p 173.
(52) Engler, A. J.; Griffin, M. A.; Sen, S.; Bönnemann, C. G.; Sweeney, H. L.; Discher, D. E. The Journal of Cell Biology 2004, 166, 877.
(53) Rajangam, K.; Arnold, M. S.; Rocco, M. A.; Stupp, S. I. Biomaterials 2008, 29, 3298.