PROCEEDINGS OF SPIE
SPIEDigitalLibrary.org/conference-proceedings-of-spiePlasma-enhanced chemical vapor
deposition of low- loss as-grown
germanosilicate layers for optical
waveguides
Feridun Ay
Sedat Agan
Atilla Aydinli
Plasma enhanced chemical vapor deposition of low loss
as-grown germanosilicate layers for optical waveguides
Feridun Aya, Sedat Aganb, Atilla Aydinhia
aDepartmeflt of Physics, Bilkent University, 06800 Ankara, Turkey;
bDepartment of Physics, Kirikkale University, 71450 Kirikkale, Turkey
ABSTRACT
We report on systematic growth and characterization of low-loss germanosilicate layers for use in optical waveg-uides. Plasma enhanced chemical vapor deposition (PECVD) technique was used to grow the films using silane, germane and nitrous oxide as precursor gases. Chemical composition was monitored by Fourier transform
in-frared (FTIR) spectroscopy. N—H bond concentration of the films decreased from 0.43 x 10²²
cm3
down to belowO.06x 1022
cm3,
by a factor of seven as the GeH4 flow rate increased from 0 to 70 sccm. A simultaneous decrease of 0—H related bonds was also observed by a factor of 10 in the same germane flow range. The measured TE loss rates at )=632.8 nm were found to increase from are 0.20 0.02 to 6.46 0.04 dB/cm as the germane flow rate increased from 5 to 50 sccm, respectively. In contrast, the propagation loss values for TE polarization at A=1550 nm were found to decrease from 0.32 0.03 down to 0.14 0.06 dB/cm for the same samples leading to the lowest values reported so far in the literature, eliminating the need for high temperature annealing as is usually done for these materials to be used in waveguide devices.Keywords: PECVD, germanosilicate, FTIR, optical loss, prism coupling, optical waveguides
1. INTRODUCTION
Silicon based dielectric materials have attracted a lot of attention in recent years for applications integrated optics. Among them germanosilicate films (Si0:Ge or (Si02):(Ge02)i) attract special interest due to their
excellent compatibility with single mode fibers.' Planar waveguides using germane as the core dopant and silica as substrate ensure excellent compatibility with the existing fiber technology. Furthermore, second-harmonic generation and2 and significant UV photosensitivity3 have already been shown in germanosilicate waveguides, providing great potential for optical applications.4
Among the methods conventionally used for growth of planar germanosilicate layers are; sol-gel methods,' RF sputtering,2 powder
56
andplasma enhanced chemical vapor deposition (PECVD) techniques.4As-deposited Si0 Ge optical waveguides grown with these methods all share the shortcoming of having relatively large propagation losses at wavelengths of 632.8 nm and 1.55 jim. In particular, loss at A=1.55 jim is known to be caused mainly by N—H and 0—H bonds incorporated into the film matrix while loss at 632.8 nm is mainly due to scattering mechanisms.7 The reported values for propagation losses range between 3.5-10
at
A=632.8 nm and are larger than 2 dB/cm at ,\=1.55 ,am,8 although not being analyzed systematically. To
reduce the mentioned loss values, it is common practice to anneal the as-grown layers at temperatures as high as 1 100 °C for prolonged times .' Recently, Zhang et al.9 reported chemical vapor deposition (CVD) grown germanosilicate planar waveguides with propagation losses of about 2 and 1 dB/cm at wavelengths of 632.8 and
1550 nm, respectively. However, due to low index contrast, almost half of the mode power in those waveguides propagates in the cladding material the effect of which is not taken into account in the reported loss values.
This report concentrates on systematic growth and characterization of as-grown germanosilicate planar
waveg-uides. The layers were grown by standard PECVD technique by using silane, germane and nitrous oxide as
precursor gases. As a result of the analysis we were able to identify that increasing the germane flow rate leads to decreasing of the hydrogen related bonds and thus to decreasing of the propagation loss at \ =1.55,um, with
the lowest reported values.
Further author information: (Send correspondence to A.A.) A.A.: E-mail: aydinli©fen.bilkent.edu.tr, Telephone: +90 312 290 1579, web-site: http://www.fen.bi1kent.edu.tr/-'iogroup/
2. EXPERIMENTAL
Parallel-plate type Plasmalab 8510C PECVD reactor was used for the growth of germanosilicate layers. The
samples were grown at 350 °C, in a pressure of 1 torr and RF power of 10 W at a frequency of 13.56 MHz,
applied to plates with a diameter of 24 cm. Silané (2% SiH4/N2) and nitrous oxide (N20) gas flow rates were
kept constant at 180 and 225 sccm, while that of germane (2% GeH4/He) has been varied between 0 and 70
sccm. The films used for FTIR characterization were grown on high resistivity silicon wafers with both sides polished and thicknesses between 1.5 and 2.5 tim. The compositional analysis of the germanosilicate films were done by making use of Bomem H&B Series Fourier transform infrared (FTIR) spectrometer. The spectra were obtained in the 5500—250 cm1 range with 8 cm1 resolution. The refractive index of the films were measured
by prism coupling technique'° at )=632.8 nm and 1550 nm and the film thicknesses were determined by the
same method and by stylus profilometry.
3. RESULTS AND DISCUSSIONS
3.1. Compositional Analysis
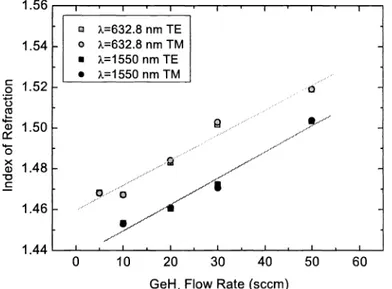
As the GeH4 flow rate was increased from 5 to 50 sccm, the refractive index of the layers was measured to vary between 1.4683 and 1.5189 (±0.0002) for TE and between 1.4681 and 1.5191 for TM polarized light at )=632.8 nm (see Fig. 1). At )=1550 nm the corresponding refractive indices were measured to vary between 1.4530— 1.5033 and 1.4527—1.5032 for TE and TM polarizations, respectively. The growth rate of the films increased gradually from 370 to 440 A/mm with increasing GeH4 flow rate.
Eight samples sO—s7 with corresponding GeH4 flow rates of 0 (i.e. SiO), 5, 10, 20, 30, 50, 60, and 70 sccm were used for compositional characterization. Normalized absorbance spectra of the samples in 250—1500 cm1
range are shown in Fig. 2. All the samples show a dominant absorption feature around 1050 cm1 which can
be resolved into Si—O symmetric and asymmetric stretching and Ge—O stretching vibrations" 12 at frequencies
of about 1065, 1150 and 980 cm1, respectively. Si—U rocking and bending vibrations were identified at r450
and '820 cm1 ,
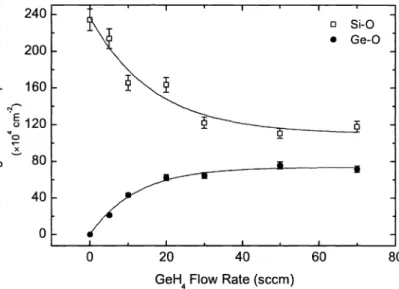
whileGe—U and Ge—H bending vibrations were observed at '420 and r650 cm1 ,respectively.Analysis of the oxygen bond concentration was performed by integrating over the relevant bands. The bands were decomposed using nonlinear curve fitting, assuming that the peaks are in the form of symmetric Gaussians. The results of this analysis are plotted in Fig. 3. The normalized integrated absorption (fband a(w)dw)) of the
Figure 1. Variation of the index of refraction for germanosilicate layers with GeH4 flow rate at A=632.8 and 1550 nm for both TE and TM polarizations.
1.56 1.54 1.52 1.50 1.48 ci X632.8 nm TE o X632.8 nm TM • XI55OnmTE • X=l55OnmTM 0 0 C.) cci
0
U) c..' 1.46 1.44 0 10 20 30 40 50 60GeH4Flow Rate (sccm)
CD CD 0 0 C/)
0
a) CD D) a) -D a) N CD E 0z
500 750 1000 1250 CD a) C-) C CD0
0 C/) 250 1500 Wavenumber (cni1)Figure2. FTIR absorption spectra of the samples at 250—1550 cm1 range with the the following GeH4 flow rates; sO:0,
sl:5, s2:10, s3:20, s4:30, s5:50, s6:60 and s7:70 sccm.
Si—O bonds exhibited a gradual decrease while that of Ge—U bonds showed a steady increase as a function of germane flow rate. Both reached saturation at a GeH4 flow rate of about 50 sccm. Assuming that the infrared
absorption cross section for the bonds of interest are similar, it can be stated that Si and Ge are incorporated
into the film matrix at nearly equal concentrations for GeH4 flow rate of 50 sccm and larger.
The most striking result of the FTIR analysis was that the observed amount of both N—H and 0—H bonds decreased with increasing GeH4 flow rate (see Fig. 4). The N—H stretching vibrations were observed at 3380 cm1, GeO—H stretching vibrations at -3470 and -3515 cm1, and finally SiO—H stretching vibrations at '--'3600
240 200 160 120
0
x 80 40 0Figure 3. Variation of normalized absorption band area for Si—U and Ge—U related bonds with increasing GeH4 flow rate.
C U) 0 U). .Q 0. 0 C/) 0.025 0.020 0.015 0.010 0.005 0.000 Wavenumber (cni1)
Figure 4. FTIR absorption coefficient (a) vs wavenumber for the germanosilicate samples in the N—H and 0—H absorption
band region.
and '-'3665 cm1 6 As the GeH4 flow rate in the grown samples increased, the N—H stretching vibrational frequency shifted about 30 cm1 towards lower frequencies, while that of GeO—H and SiO—H remained constant. The N—H and 0—H bond concentrations were calculated for all the grown layers by using the method of Lanford
and Rand •13 ForN—H bonds, the absorption cross section value of NH =5.3X1O_18 cm2was used throughout the calculations. The corresponding value for 0—H bonds, was UOH =1.5x 1O21 cm2 , obtainedby Rostaing
et al. .
14 j
spite of the relatively large uncertainty for the 0—H bond absorption cross section, we believe thatthe results obtained can be safely used in the comparison of 0—H bond concentrations of the samples. For other quantities such as peak wavenumber (w), full width at half maximum (FWHM), and normalized absorption band area (f adw) ,
of
each absorption band we estimate typical uncertainty values of 5 cm5 cm and
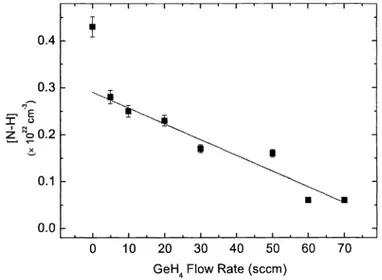
4 %, respectively. The results of the calculations are plotted in Fig.5. As seen from the figure, the N—H bond0.4 0.3
Z o0.2
0.1 0.0 U I . I . I . I I I I . I 010 20 30
40 50 60 70GeH4Flow Rate (sccm)
Figure5. Variation of calculated N—H bond concentrations for germanosilicate samples with increasing GeH4 flow rate.
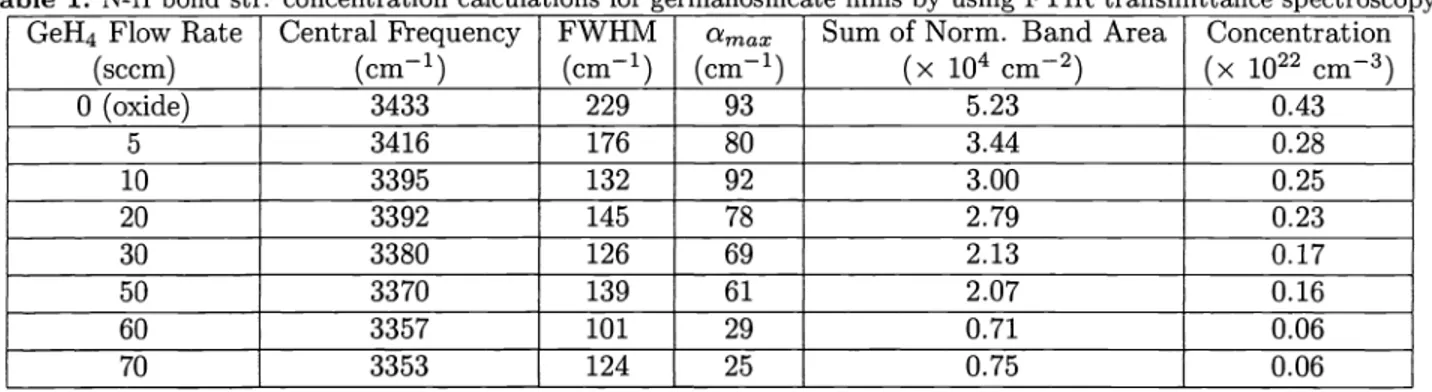
Table 1. N-H bond str.concentration calculations for germanosilicate films b using FTIR transmittance spectroscopy.
GeH4 Flow Rate
(sccm) Central Frequency
(cm')
FWHM(cm1)
amax(cm')
Sum of Norm. Band Area
(x iO cm2)
Concentration (x 1022 cm3) 0 (oxide) 3433 229 93 5.23 0.43 5 3416 176 80 3.44 0.28 10 3395 132 92 3.00 0.25 20 3392 145 78 2.79 0.23 30 3380 126 69 2.13 0.17 50 3370 139 61 2.07 0.16 60 3357 101 29 0.71 0.06 70 3353 124 25 0.75 0.06concentration has decreased from 0.43x 1022 cm3 down below our detection limit of 0.06 x 1022 cm3, by a
factor of seven as the GeH4 flow rate increased from 0 (silicon oxide) to 70 sccm. The details of the analysis are summarized in Table 1.
As for the 0—H bonds, their concentration showed a sharp decrease, as well from about 2.27x 1022 cm3 down to 0.23x 1022 cm3, by a factor of ten in the same germane flow range. The observed decrease of these bonds has an important impact on propagation losses at ..\=1.55 m of the waveguides grown using germanosilicate films.
3.2. Loss Analysis
The waveguide propagation losses at A= 632.8 and 1550 nm were measured by using prism coupling technique.'5 The germanosilicate core layers were grown on oxidized silicon wafers with Si02 thickness of 9.8 ,am, serving as
lower cladding. Core layer thicknesses were varied between 4—6 jtm, by using the same parameters as the samples
used in FTIR characterization. At .A=1.55 am the moving prism method was used, in which light was coupled into the waveguide at different lengths and the output power was monitored at the end of the slab waveguide. At A=632.8 nm the method of Ramponi et al.'6 was employed, in which a single prism and measurement of reflected and transmitted light are used to determine the propagation losses. In order to compare the propagation losses of our films, care must be taken to take the confinement factor of each waveguide into account. Depending on the index contrast and thicknesses of the layers, some fraction of the total time averaged power travels in the core layer of the waveguide and the remaining power propagates in the cladding layer.
This issue can be overcome by normalizing the measured loss to identical predetermined fraction of the total power propagating in the core layer. With this approach, loss values of germanosilicate planar waveguides with
different index contrast and thicknesses can be compared to each other. In this work, the fraction of power
travelling in the guiding layer was chosen to be same as in the waveguides studied by Zhang et al. . The results of the loss analysis for three representative waveguides grown with different germane flow rates are summarized in Table 2.
For purpose of completeness, raw values of the measured loss rates for TE polarization at ..\=1.55 um are 0.55
0.37 and 0.27 dB/cm for the samples si, s2 and s5, respectively. The measured propagation
Table 2. Propagation loss variation with GeH4 flow rate for three representative germanosilicate waveguides at A=632.8
and 1550 nm.
—
GeH4 flowrate
Propagation loss (dB/cm) 632.8 nm 1550 nm
-i-
5 sccm 0.200.02 0.11
0.11 0.32
0.03 0.22
0.04—-
10 sccm 0.340.17 0.26
0.15 0.22
0.06 0.18
0.02ii
50 sccm 6.460.04 6.47
0.04 0.14
0.06 0.18
0.07loss values at A=632.8 nm for the same samples at TE polarization are 0.20 0.34 and 6.46 dB/cm, respectively. The observed trend of propagation loss increase at )=632.8 nm is similar with the results available in the literature. Specifically, as the Ge content of the layers increase the propagation loss increases as well due mainly to scattering mechanisms.3' 17 As for the propagation loss values at ,\=1.55 m, they are in agreement with our expectations based on FTIR analysis. The normalized propagation loss rates showed a
decrease by a factor of two, while approaching our measurement limit, and following the decreasing N-H bond concentration.
4. CONCLUSIONS
We have grown germanosilicate layers using the PECVD technique. Compositional analysis using FTIR
spec-troscopy showed that the amount of N-H and 0-H related bonds exhibited a drastic decrease with increasing
GeH4 flow rate. Planar waveguides fabricated with germanosilicate core layers showed the lowest propagation loss values reported so far both for as deposited and annealed layers at A=1.55 ,um,9' 18eliminatingthe need for costly and cumbersome annealing process.
ACKNOWLEDGMENTS
The authors acknowledge the support of Bilkent University (Research Fund Code: Phys-03-02).
REFERENCES
1. D. G. Chen, B. G. Potter, J. H. Simmons, "Ge02—5i02 thin films for planar waveguide applications," J. Non-Cryst. Solids 178, pp.l35—l4'7, 1994.
2. 0. Sugihara, M. Nakanishi, H. Fujimura, C. Egami, N. Okamoto, "Thermally poled silicate thin films with large second-harmonic generation," J. Opt. Soc. Am. B 15,pp.421—425, 1998.
3. D. C. M. P. D. G. K. S. Potter, B. G. Potter, "Novel process for the production of large, stable photosensi-tivity in glass films," Appi. Phys. Lett. 68, pp. 2011—2013, 1996.
4. R.A. Jarvis, J.D. Love, A. Durandet, G.D. Conway, R.W. Boswell, "UV-induced index change in
hydrogen-free germano-silicate waveguides," Electron. Lett. 32, pp. 550—552, 1996.
5. Q. Zeng, J.F. Stebbins, A.D. Heaney, T. Erdogan, "Hydrogen speciation in hydrogen-loaded, germania-doped silica glass: a combined NMR and FTIR study of the effects of UV irradiation and heat treatment,"
J. Non-Cryst. Solids 258, pp. 78—91, 1999.
6. V.G. Plotnichenko, V.0. Sokolov, E.M. Dianov, "Hydroxyl groups in germanosilicate glasses," J. Non-Cryst.
Solids 278, pp. 85—98, 2000.
7. B. S. Sahu, 0. P. Agnihotri, S. C. Jam, R. Mertens, I. Kato, "Influence of hydrogen on losses in silicon
oxynitride planar optical waveguides," Semicond. Sci. Tech. 15, pp. L11—L14, 2000.
8. D. Moss, J. Canning, M. Bazylenko, "Bragg gratings in hollow-cathode PECVD germanosilica planar
waveg-uides ," Conference on Lasers and Electro-Optics Technical Digest, p. 245, OSA, Washington DC, 1998.
9. Q.Y. Zhang, K. Pita, C. K. F. Ho, N. Q.Ngo, L. P. Zuo, S. Takahashi, "Low optical loss germanosilicate
planar waveguides by low-pressure inductively coupled plasma-enhanced chemical vapor deposition," Chem.
Phys. Lett. 368, pp. 183—188, 2003.
10. P. K. Tien, "Light waves in thin films and integrated optics," Appl. Optics 10, pp. 2395—2313, 1971. 11. Y. P. Chou and S. C. Lee, "Structural, optical, and electrical properties of hydrogenated amorphous silicon
germanium alloys," J. Appl. Phys. 83, pp. 4111—4123, 1998.
12. G. Lucovsky, S. S. Chao, J. Yang, J. E. Tyler, R. C. Ross, W. Czubatyj, "Chemical bonding of hydrogen and
oxygen in glow-discharge -deposited thin films of a-Ge:H and a-Ge:(H,0)," Phys. Rev. B 31, pp. 2190—2197,
1985.
13. W. A. Lanford and M. J. Rand, "The hydrogen content of plasma-deposited silicon nitride," J. Appl. Phys.
49, pp. 2473—2477, 1978.
14. J. C. Rostaing, Y. Cross, S. C. Gujrathi, S. Poulain, "Quantitative infrared characterization of plasma
enhanced CVD silicon oxynitride films," J. Non-Cryst. Solids 97-98, pp. 1051—1054, 1987.
15. S. Agan, F. Ay, A. Aydinli, "Stress effects in prism coupling measurements of thin polymer films," Appi. Phys. A: Materials Science €4 Processing, accepted for publication, 2004.
16. R. Ramponi, R. Osellame, M. Marangoni, "Two straightforward methods for the measurement of optical losses in planar waveguides," Rev. Sci. Instrum. 73, pp. 1117—1120, 2002.
17. T. Kominato, Y. Ohmori, N. Takato, H. Okazaki, M. Yasu, "Ring resonators composed of Ge02—doped
silica waveguides ,"J. Lightwave Technol. 10,pp. 1781—1788, 1992.
18. F. Ay, A. Aydinli, S. Agan, "Low—loss as—grown germanosilicate layers for optical waveguides," Appi. Phys. Lett. 83, pp. 4743—4746, 2003.