Response
of
Acoustic Imaging Systems Using
Convergent Leaky Waves to
Cylindrical Flaws
NILGUN GUNALP A N D ABDULLAH ATALAR, MEMBER ~ E E E
Abstract-Characterization of near-surface properties of materials by acoustic means is most convenientl) done by surface-acoustic-a.aves
(SAW) that are spatially confined to the surface. There are several techniques available to excite focused S.4H"s on the surfaces of non- piezoelectric materials for imaging purposes. A conventional acoustic
microscope lens excites focused SA\l"s on the ohject surface, hut with a low efficiency. SAW can he excited with a high efficiency using conical
wavefronts as obtained from a conical axicon. Such methods ran be used in a scanning arrangement to generate images of surface inho- mogeneities. In this paper, an analysis of imaging systems making use of convergent SAW's is given using angular spectrum approach and T-
matrix formulation. Inhomogeneities on the ohject surface are as-
sumed to be circular cylinders whose axes are perpendicular to the surface. The response of imaging systems to such defects is found as a function of defect position with respect to the focus point. 'Theoretical and experimental results are compared and are found t o he in good agreement.
I. INTRODUCTION
N
EAR SURFACE PROPERTIES o f materials are im- portant for their structural integrity. Nondestructive evaluation of these properties is usually carried out using acoustic techniques. Bulk waves fail to detect near surface faults due to the large reflection signal at the boundary. Surface acoustic waves (SAW) are frequently used for near surface evaluation of materials, because they are very sensitive to surface inhomogeneities like surface breaking cracks [ l ] . If the characterization is of primary concern rather than just detection of faults, an imaging system may be utilized. There are several imaging techniques avail- able for this purpose. The scanning acoustic microscope (SAM) has been used successfully, because of its ability to excite surface waves [ 2 ] - [ 5 ] . The SAM excites otherwave modes like generalized Lamb waves. which may be more sensitive for certain kind of defects [ 61. The disad- vantage of SAM is that all such modes are excited simul- taneously and each with a low efficiency. The efficiency can be increased by use of other configurations. Smith et al. [7] proposed to use a semicircular disk transducer with
Manuscript received July 1 , 1988; r w i d N o ~ e m h r r 2 1 . 1988: ac-
N. Giinalp is with the Electrical and Elecrronlci E n g ~ n e e r i n g Depan- A . Atalar I S w i t h the Electrlcal and Electronics Engineering Depan- IEEE Log Number 8927861.
cepted December 5 , 1988.
ment, Middle East Technical University, Ankara. Turkey 06531
ment, Bilkent University, Ankara. Turkey 0 6 5 7 2 .
dition to excite focused SAW's. Nongaillard et al. [8]
used a tilted cylindrical lens to excite focused SAW. Jen rt u1. [9], Cielo er (11. [ l o ] , [ l 13 and Maldague et al. [l21
used a focused optical ring to generate SAW on the test sample. Kiiymen and Atalar introduced a method of fo-
cusing SAW'S on the surface of nonpiezoelectric mate- rials by using a new type of conical axicon [13]. Ayter
[ 141 achieved the same result, using a conical transducer. Robbins et al. [ 151 proposed to use the scanning laser
acoustic microscope with SAW's for thin-film character- ization. Such systems allow one to scan the surface by a diffraction limited spot and thus to image the surface properties of the materials.
The purpose of this paper is to present a theoretical study of the imaging systems utilizing focused leaky
SAW, and their response to certain kind of defects. In particular, circular cylindrical inhomogeneities axes per- pendicular to the surface are considered. Scattering of acoustic plane waves from cylinders has been investigated extensively [16], [17], but, there are very few studies on scattering of a bounded acoustic beam by a cylinder [ 181. In this paper the scattering of the SAW from this cylinder is formulated with some approximations. The surface wave incident upon the inhomogeneity is initially found as an angular spectrum of plane waves. But, for the ap- plication of the boundary conditions at the cylindrical sur- face, the incident field has to be transformed into a form of superposition of cylindrical waves. Similarly, the scat- tered field, which is found in the form of outgoing cylin- drical SAW's, is converted back to a plane wave spectrum in order to complete the formulation. These transforma- tions between the angular spectrum of plane waves and the cylindrical wave expansions constitute the crucial
point of the formulation. At the end, a formula is obtained for the transducer output voltage in terms of the position and the radius of the cylinder, and it is suitable for com- puter evaluation. By considering various locations for the cylinder, the sensitivity of the system around the focal
point is studied. Also, by comparing the output voltages for cylinders of different radii, sensitivity of the system to the size of the inhomogeneity is examined. The nu- merical results are found to be in agreement with the ex- perimental observations.
508 IEEE TRAKSACTIONS ON ULTRASONICS. FERROELECTRICS. A N D FREQUENCY CONTROL. VOL 36. NO 5 , SEPTEMBER 1989
11. DESCRIPTION O F T H E IMAGING SYSTEM
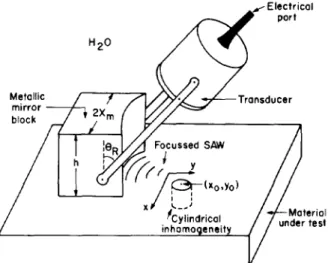
As a representative of SAW imaging systems, we con- sider the conical axicon focusing system [ 131. This con- figuration is simple to fabricate, and a high bulk-to-SAW conversion efficiency can be obtained. Here, we give a brief review of the principle of operation of this imaging system. As shown in Fig. l , an acoustic beam generated by the piston transducer is obliquely incident on the con- cave parabolic cylindrical surface of the mirror. If the in- cidence angle is high enough, all of the incident power
will be reflected, and no bulk wave will be excited in the solid mirror block. The wavefronts of the reflected wave are conical [19], and the axis of the cones coincides with the focal line of the parabolic cylinder that is perpendic- ular to the object surface under test. The intersection of the conical wavefronts with the surface of the material is always circular. Since the mirror has finite aperture, the reflected wavefront will be a section of the conical sur- face, and hence the intersection with the material surface will be a circular arc rather than a complete circle.
The incidence angle of the beam created by the trans- ducer is adjusted such that the reflected wave is incident on the material surface at the Rayleigh critical angle. By this process all the energy in a conical wavefront is con- verted to a single circularly converging wavefront of the surface wave. This surface wave will start to leak into the liquid medium as a bulk wave, but almost none of the incident power will return to the transducer if the material surface is flawless. However, when there is a surface wave reflector at the focal spot, the transducer will receive an appreciable power: the scattered surface waves will be circularly divergent and they will leak into the liquid me- dium to reconstruct the conical wavefronts that originally created the surface wave. This backward conical wave- front will get collimated in the transducer direction after being reflected from the parabolic mirror. If the inhomo- geneity is not exactly at the surface wave focus, the trans- ducer output voltage will be reduced.
111. FORMULATION
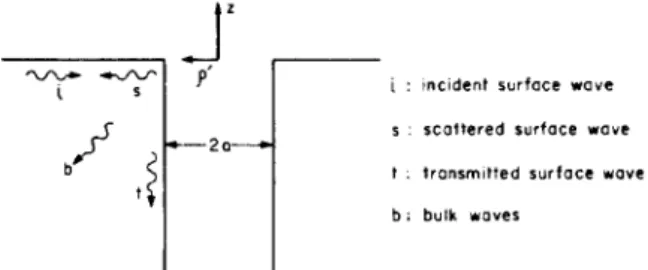
Consider the geometry shown in Fig. 2 . The ( r , S, t ) coordinate system will be used to represent the bulk waves transmitted and received by the transducer, and ( x , y ,
z )
coordinates will be used for the surface waves in the solid. The origin of the ( x , y ,z )
coordinate system is chosen at the focal point. Inside the solid a circular cylindrical in- homogeneity is considered. This cylinder extends up to the interface and it is centered at (xo, y o ) with yo>
0 as demonstrated in Fig. 1.The formulation presented below employs two-dimen- sional potentials U +(x, y ) and U -(.x, y ) to represent the incident and scattered surface waves. It is shown in the Appendix that such two-dimensional potentials (either in the form of angular spectrum of plane waves or in the form of cylindrical wave expansions) are sufficient to rep- resent completely the three-dimensional characteristics of SAW'S by suitably multiplying the depth variation (z-de-
x
kylindricol Materiol
inhomogeneity
Fig. 1 . Conical awicon geometry to obtain convergent S A W ,
/
/
/
l h = f c o t BR I Liquld Lf-T SohdFig. 2 . Description of coordinates used in formulation.
pendence). A time dependence of exp ( - j w t ) is assumed in the formulation.
Surface Wave Field at the Focus
Let the velocity potential associated with the incident bulk wave be represented by U; ( r , S ) at the r - S plane.
Since the parabolic mirror acts like a Fourier transform operator in one direction [ 2 0 ] , and the bulk to surface wave conversion phenomenon acts as an integrator in the other dimension [21], the surface wave field along x-axis and propagating in the
+y
direction, U; (x), can be writ- ten as [ 2 2 ]ub+(r, S ) P ( r , J ) ds
1
.
exp[
- j ( k R / f ) rx] dr ( 1 ) where kR = 2 x / h R is the real part of the leaky Rayleigh wave number,f
is the focal length, and P ( r , S ) is thepupil function due to finite size of the parabolic mirror.
P ( r , S ) is obtained from a projection of the mirror surface
onto the
r
- S plane: a rectangle of width 2x, and heightf c o t 1 9 ~ , where O R is the Rayleigh angle. The pupil func- tion given below also includes the phase and attenuation
GUNALP AND ATALAR: RESPONSE OF ACOUSTIC IMAGING SYSTEMS 509
factors that arise as the wave travels from the mirror sur- face up to the focal point. We have
P ( r , S)
=[
exp[
- a T ( f for - x, - S< r
tan<
e,)]
X’,,, exp 0<
( j k R s cot S< f cot
OR),
0, 0, otherwise,( 2 ) where aT = aD
+
a L ; aD and aYt are the dissipation and leak rates, respectively, of the surface wave.Field Incident Upon the Cylinder
By using the angular spectrum approach [23], the field in the region y
>
0 can be completely determined by the field distribution at y = 0, i.e., along x-axis. For this pur- pose, we first define the angular spectrum, U; ( k , ) , of the surface wave field, u ; ( x ) , byU f ’ ( k , ) = 3 ( u f ( x )
]
=SI,”
U; ( x ) exp ( -jk,x) dx( 3 ) where 3 is the Fourier transform operator. Then the an- gular spectrum at a position y
>
0 can be found fromU+(k,, Y ) = U; ( k s ) exp ( j k ? . Y )
This equation describes the propagation of the angular
spectrum in the + y direction. Since u ‘(x, y ) and U’( k,, y ) form a Fourier transform pair, the field U +(x, y) for y
>
0 can then be expressed asP + W U+(& y ) = 1/(2n) U + ( k , ,
Y)
exp ( $ , x ) dk,, - m y r o or + m u + ( x ,Y )
= 1 / ( 2 n ) U + ( k , ) - m exp[
j ( k , x+
k , y ) ] dk,, y 2o
(4)
where k, and k , are related by k.:
+
k:
= k’, and k is the complex wave~number, k = kR+
j a i . We can express k , as ky = ( k 2 - k;)’’’ with Zm { k , }>
0.One can directly combine (1) -and (3), and obtain the following expression for U; ( k , ) in terms of an arbitrary incident field ub+ ( r , S) as
n + W
Field Scattered by the Cylinder
To formulate the scattering, we first introduce a primed coordinate system ( X ’ , y’ ) with the origin at the center of
the cylinder, i.e.,
x ‘ = x - xo, y’ = y - yo ( 6 ) as shown in Fig. 3. To simplify the notation, we also in- troduce the vectors r = ( x , y ) , r‘ = ( X ’ , y ‘ ) , ro = ( x o , y o ) , k = (k.x, k , ) . Then the field incident upon the cylin- der can be written as
+ m u + ( r ’ ) = 1 / ( 2 a )
j
U / ’ ( k , ) exp ($%) - W exp ( j k o r ’ ) dk, or P + m u + ( r ’ ) = 1 / ( 2 a )1
~ ( k , ) exp (jk.t-1) dk,, - W Y’ 2 -Yo ( 7 ) where A ( k , ) = Uf’ ( k , ) exp ( j k o r , ) . ( 8 )Let u - ( r ’ ) denote the field scattered by the cylinder. Then, the total field outside the cylinder must be given by
u ( r ’ ) = u - ( r ’ )
+
U - ( r ’ ) .In order to relate the incident and the reflected fields by the boundary conditions on a cylindrical surface p ‘ = a , it is necessary to express these fields in terms of cylindri- cal wave functions. The incident field that will be evalu- ated at p ’ = a can be expressed in terms of regular cylin-
drical wave functions as + m
u f ( r ’ ) =
c
K,, exp(j.4’)
J , , ( k p ’ ) ( 9 )n = - m
and the scattered field can be expanded in terms of out- going cylindrical wave functions as
p’ I a . (10)
The relationship between { K,, } of (9) and A ( k , ) of (7) can be established by substituting the following transfor- mation formula [24] into ( 7 ) :
+ W
This yields
S 10 IEEE TRANSACTIONS ON ULTRASONICS. FERROELECTRICS. 9 N D FREQl1ENC.Y CONTROL. VOL. 36. NO. S . SEPTEMBER 1989
Fig. 3. Top view depicting primed coordinate 5ystern
1‘
-1
-p’
1-
i : Incldent surface waveS . scattered surface wave t . transmltted surface wave b ; bulk waves
Fig. 4 . Various wave components i n SAW scattering problem
The next step in the formulation is to express { B, } , the expansion coefficients of the scattered wave, in terms of
{ K ,
}.
It is well-known that [ 2 5 ] when a surface wave is incident upon a scatterer, in general, a scattered surface wave, a transmitted surface wave and reflected bulk waves will be excited as demonstrated in Fig. 4.We would like to consider a cylindrical cavity as the inhomogeneity, because the experimental results are ob- tained easily with cavities. Although only the scattered
surface wave, ( S ) , will induce an output voltage at the
transducer, for an exact solution of the problem all pos- sible field components should be taken into account. Such an exact formulation is quite complicated [ 2 6 ] - [ 3 1 ] , therefore a simple approximate method will be applied: Since the finite value of c44 makes the surface of the cyl- inder a relatively hard boundary in the radial direction, the total surface wave along the interface ( i
+
S ) will beforced to satisfy the rigid-boundary condition ( u p , = 0 at
p’ = a ) . Use of the free-boundary condition is not appro- priate here, it approximates a cavity in a liquid medium where q 4 is zero. Even though the inhomogeneity is a cavity, it is better approximated in the scalar approxima- tion by a rigid cylinder. In other words the reflection
problem we are considering is the rigid cylinder case. But we will use the theoretical results to compare with exper- imental observations obtained with cavities. This is a good approximation for small size cylinders. This approximate formulation does not give the actual “ratio” of the scat- tered surface wave to the incident (for an infinite edge
reflector it estimates a total reflection). However, it can quite satisfactorily be used to compare the scattered fields (or transducer output voltages) due to various cylinders of different locations and sizes. When the boundary condi- tion
a
aP’ p ’ = u
- ( U + ( f )
+
LL-(r~)}l = 0is applied with U ‘ ( r ’ ) and U - ( r f ) as given by (9) and
(lo), respectively, one obtains B, = ( 1 2 ) T , K , where
T,, = -j,
( h )
/kL’
( h )
.
( 1 3 ) Note that this procedure is a standard T-matrix formula- tion [ 3 2 ] .The scattered surface wave, which was expressed in cy- lindrical form in ( l o ) , must now be written as
+m
U-(& Y ) = 1 / ( 2 K )
j
U+,) - m* exp
[
j ( k , x - j k y ~ p ) ] dk, (14)for points y I yo. Note that U; ( k , ) corresponds to the
returning angular spectrum at y = 0. To obtain such a representation, the following transformation formula [ 3 3 ] will be used: exp ( j n $ ’ ) H ; ” ( k p ’ ) - - exp ( - j n a / 2 ) (kx
;
jky> K * exp[
j ( k x x ’-
k , Y ’ ) l / k , dkx ( 1 5 ) for y f I 0. Substitution of (15) into (lo), and use of ( 6 )yield
* exp
[
-j(k,xo-
k y y o ) ] . ( 1 6 )Transducer Output Voltage
The scattered surface wave U -(.x, y ) travels in the
backward direction and leaks into the liquid. This leak
field gets collimated in the transducer direction after being reflected from the mirror. The field incident upon the transducer, U ; ( r , S), can be obtained by [ 2 2 ]
+ m
ub-(r, S) = a L P ( r ,
5
u J ( x ) exp (-jf kR r x ) d x- m
( 1 7 ) where u s ( x ) = U - ( x , 0 ) is the scattered surface wave field along the x-axis. Equation (17) “transforms” U; ( x ) to ub- ( r , S ) correctly, since P ( r , S) includes the phase
shift and the attenuation experienced by the wave as it travels from the focal spot to the mirror surface; it also
G U N A L P AND ATALAR: RESPONSE OF ACOUSTIC IMAGING SYSTEMS 51 I
limits the beam in both directions and the integral in (17)
represents the Fourier transforming action of the cylin-
drical mirror. When combined with UT ( k , ) = 5 { UJ ( x ) }
as in (3), (17) yields
Finally, since u h ( r , S ) is to be received by the same
transducer as generated the incident field, U: ( r , S ) , the
output voltage of the transducer can be expressed [34] ap-
proximately as
p f m p c m
By combining (19), (18), (16), (12), ( l l ) , (8), (5) and
(2), the transducer output voltage can be expressed, after
some manipulations, in the following compact form:
.
(
q)n
dkx.
(!!y
dk,/k, where fcot ox =lo
U b + ( f k x l k R , S > exp ( a T s tan.
exp (jkRS Cot 6,) dS ( 2 3 )and k, = ( k 2 - k : ) ’ / 2 , k = kR
+
j a , and T,, is as givenby (13). Note that, (20), (21) and (22) can be used to calculate the response of the system under any excitation by the transducer, by merely substituting U:( r , S ) into
the g ( k , ) expression given by (23).
A Special Case
As the incident bulk wave transmitted by the trans- ducer, assume a unity amplitude uniform plane wave with no r-dependence. In this case, the field distribution at the
r
-
S plane can be expressed asU : ( r , S ) = eXp
[
-JkRS cote,]
(24)since there is an angle between the r - S plane and the
plane wavefront. One can directly substitute (24) into (23)
and evaluate g ( k,) as
g ( k x ) = [exp ( a T f ) - l ] / a T h n OR
which is a constant. Thus the expression for the output voltage is considerably simplified. Several observations can be made by considering some of the intermediate steps of the formulation for this special case of plane wave in- cidence. For example, when U ; ( r , s ) is multiplied by
P(
r , S ) , the linear phase factors cancel, indicating that allthe rays reach the focal point in phase. Substitution of (2)
and (24) into ( l ) result in the following focal field distri- bution:
This expression shows that the lateral dependence of the focal field is a “sinc” function.
The corresponding angular spectrum of surface waves at y = 0 is then found as
i
f A R [-
exp ( - a T f ) ] / ( a T tan O R ) 9UJWJ =
I
k x \ x m k R / f.
( 2 6 )0, otherwise.
Note that the angular spectrum at the focal line has a con- stant value.
The transducer output voltage under plane wave inson- ification can be written, by introducing a suitable nor-
malization voltage, in the following form: +m
.
(
y)fl
dkXVedge corresponds to the transducer output voltage when
there is an infinitely long edge (plane reflector) along the x-axis. Vedge is calculated below and it can be used as a normalization factor, i.e., numerical calculations can be done for V / Vedge.
To find the output voltage corresponding to a perfect SAW reflector we assume that the incident and scattered fields given by (4) and (14) satisfy the same type of rigid
S12 IEEE TRANSACTIONS ON ULTRASONICS, FERROELECTRICS. AND FREQlltNC'Y COYTKOI.. V O L 36. NO 5 . SFPTkhlRER IYXO
This directly gives U; ( k , ) =
c;'(
k r ) , which means a total reflection. In this case one findsThis expression shows the factors affecting the output voltage with a perfect SAW reflector at the focal line.
IV. NUMERICAL RESULTS
For numerical calculations, we will assume a uniform plane wave incidence. For this case, ( 2 7 ) gives the trans- ducer output voltage in terms of the center ro = (xo, y o ) and the radius, a , of the scattering cylinder. The integrals P, and Q,, given by (28) and (29) depend only on the po-
sition of the cylinder, whereas the coefficient T,, depends only on the radius. This situation is quite advantageous during the numerical calculations. Because, these inte-
grals, once evaluated at a certain ( x o , y o ) position, can be stored and be used subsequently for cylinders of different radii centered at the same point. We put the integrals P,, and Q, into a form more suitable for numerical integration by using a simple change of variables:
When this is done it is observed that for the calculation of V / Vedge, the only parameters that must be specified are
xm/f, ( Y T / ~ R , ~ R X O , ~ R Y O and kRa.
The,integrals are evaluated using Simpson's 1 / 3 Rule, and they converge quite easily. The necessary number of integration points increases as n and/or the distance of the center from focal point increases. For the calculation of
T,, the derivatives of the Bessel and Hankel functions of the complex argument
ku = kRU( 1
+
j c u , / k R )are generated. For small cylinders with k R a
<
1, the terms withI
III
I 3 in the summation of ( 2 7 ) are sufficient. As the radius increases, more and more terms should be in- cluded. The computer program guarantees the conver- gence of the integrals and the summation automatically.In order to compare our results with the previously pub- lished experimental results [ 191, we chose x , , / f = 0 . 7 4 in all of the calculations given below. The ratio cyT/kR is equal to 0.03 for aluminum, and this value is used in all of the presented results, except in Fig. 5 , where several a T / k R ratios are considered.
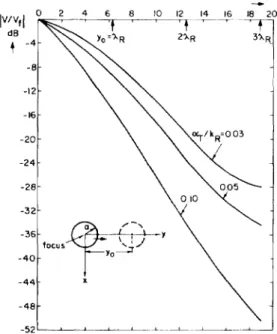
The first set of results given in Fig. 5 corresponds to a small cylinder ( k , ~ = 0.5, diameter = 0.16 X , ) moved along the y-axis to see the axial sensitivity of the imaging system. Here the results are normalized by the transducer output voltage,
5 ,
obtained when the cylinder is centered at the focus. Curves corresponding to different aT/ICR ra-\ /
\
y / k R = 0 0 3Fig. 5 . Magnitude of normalized transducer output voltage a h tunction o f
axial position of cylinder for several a , jL, values.
.>,,if
= 0 . 7 4 , k,cr =0.5, xi, = 0.0,
v,
= output voltage when cylinder I S centered at focus.V,is 12.73 dB below
tios are presented. In each case it is seen that as the scat- terer moves away from the focal point, the output voltage decreases monotonically. For the case of a T / k R = 0.03 ( A l ) , 20-dB drop at the output voltage occurs at k R y O =
13 that corresponds to a distance Y o = 2XR from the focal point. This result is in close agreement with our experi- mental observations. It is interesting to note that as the leak rate is increased the response of the system in the y direction gets sharper, i.e., the resolution in the y direc- tion increases.
To examine the sensitivity of the system along the x-
direction (lateral direction), several calculations are car- ried out. First, a very small cylinder ( a = X,/20) is moved along the x-axis (center at the x-axis) as shown in Fig. 6, and the normalized output voltage (in dB) is plot- ted as a function of the separation of the cylinder center from the focal point. It is observed that
1
V / V,[ versus x0 curve closely follows the variations of the incident field distribution along x-axis ( U ; ( x ) ? as given by (25)).I
u ; ( x )I
is also plotted in Fig. 6 after being normalizedby its value a t x = 0. It is seen that
1
V / V f l is nearly equal to the square of the1
uf1
(double the dB values) except for the peaks marked with (*). Those peaks occur in the figure near the zero crossings of the sinc function. These unexpected peaks do not show up for larger cylinders (see Fig. 7 ) . It was seen that these peaks are due to the inter- ference of the terms due to n = 0, 1 and - 1 that are the only significant terms for small cylinders. A n experimen- tal verification of these peaks was not possible because they occur only for very small cylinders where the re- ceived signal is low and those peaks are out of the limitedG U N A L P A N D ATALAR: RESPONSE OF ACOUSTIC I M A G I N G SYSTEMS 513
,kRXo
Fig. 6 . Magnitude of normalized transducer output voltage as function of
lateral position of cylinder. x n z / f = 0.74, a T / k R = 0.03, y, = 0.0; V,
is 19.84 dB below Vedge for k,a = 0.314, and 9.81 dB below Vedpe for
k,a = 0.628.
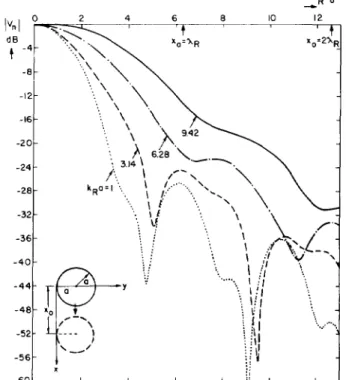
Fig. 7. Magnitude of normalized transducer output voltage as function of lateral position of cylinder, with cylinder radius as parameter. x#./f = 0.74, a T / k , = 0.03, yo = a ; maximum voltages are below Vedge by
following amounts: 7.03 dB for k,a = 1 .O, 3.01 dB for k,a = T , 1.48
dB for k,a = 2 ~ , 1.42 dB for k,a = 3 ~ .
dynamic range of the system. The other peaks in Fig. 6 correspond to the maxima of
1
sinc1
function as expected. It is also observed that the resolution of the system in thex direction is about four times better than in they direction
for the case of the aluminum sample, and this is consistent with experimental results. Note that, the resolution of the system in the y direction can be improved'by the use of short pulses and a time-gating arrangement [ 141.
The next figure, Fig. 7, shows how the output voltage varies in the lateral direction for larger radius cylinders. Here, the cylinders are moved parallel to the x-axis (with their edges touching the x-axis), and the corresponding
output voltages are plotted after being normalized by their maximum values. It is seen that for cylinders whose di- ameters are larger than the width of the main beam of the incident sinc function, the transducer output voltage is re- lated rather closely to the size of the cylinder. For k R a =
27r and k R a = 37r, approximately 20-dB drop in the output voltage is obtained when the cylinder is centered at the position x. = a . Hence images obtained in such a system will correctly depict the size of the cylinders. But, for
small cylinders, the response of the system is determined by the incident sinc function.
Finally, to investigate the sensitivity of the imaging system to the radius of the cylinder', the output voltages for different radii are calculated. Each cylinder is centered at the point x. = 0, y o = a , where a is its radius, so that the edge of each cylinder is at the focus as demonstrated in Fig. 8 . The case a
-,
00 corresponds to an infinitestraight edge reflector along x-axis for which the trans- ducer output voltage is Eledge. All voltages are normalized
by Eledge and plotted versus k R a . It is observed that the output voltage increases as the cylinder becomes larger, and for kRa = 3.1 ( a = XR/2), the output voltage is only 3 dB below
v&e.
This is because the incident field uf ( x )illuminates only a finite portion along x-axis (when
1
kRx1
>
3.5, the value of U; ( x ) stays 13 dB or more below its value at x = 0, as can be seen from Fig. 6 ) Thus, increas- ing the radius further will not change the output voltage considerably. On the other ha'nd, for small radii the signal drops about 10 dB for each halving of the cylinder radius. The asymptotic line crosses the 0 dB axis at approxi- mately k R a = 1.The cunie in Fig. 8 exhibits another interesting feature. As k R a approaches 1 from smaller values, the output volt- age tends to increase faster, thus forming a local maxi- mum at kRa = 1. This corresponds to a cylinder whose circumference is X R , i.e., the phase change around the cylinder is 2 x . Such behavior can be explained by the in- phase superposition of the creeping surface waves around the cylinder
[35].
It is surprising that the very simple boundary conditions used in the reflection problem pre- dicts this behavior. The dots in the Fig. 8 represent the experimental results obtained earlier [ 191. Although in the experimental setup, the focal field had a wider beam- width, the experimental curve possesses the same kind of signal enhancement around k R a = 1. For small cylinder radii the experimental and theoretical values are in good agreement. Disagreement between the curves for larger kRa values may be explained by the coarse approxima-5 l4 IEEE TRANSACTIONS ON ULTRASONICS. FERROELECTRICS. A N D FREQUENCY CONTROL. VOL. 36. NO S, SEPTEMBER 1989 IWVedgeI k R 0 dB I 2 3 , 5 7 1 2 3 5 7 1 0 1 5 --c t O r - ' ' , - ? , , , ,
. . .
, -2 -6 - -4 - - -8 - -10 - -12- -14- -16- -18- -20 - -22-
-24 - -26- -28 - -30 -32-
- ,I'i
j--
experlmenfal results I I a-mI
I P
i L + - Y il
t X 1i
Fig. 8. Variation of normalized output voltage with cylinder radius. x m / f
= 0.74, c+/kR = 0.03, x" = 0.0, y o = a , V+.: output voltage corre-
sponding to the case U + OD.
tions made in calculation of the reflection coefficient of SAW from the cylinders, which may be radius dependent.
V . CONCLUSION
A theory is presented to predict the response of an im- aging system making use of leaky SAW. In particular, the conical axicon SAW focusing system is considered. The response of the system to cylindrical flaws as a function of position of flaw with respect to focus point is calcu- lated. Although the scattering of SAW from the cylindri- cal flaws is taken into account with a very rough approx- imation, the results are very consistent with experimental findings. The resolution of the system in the lateral direc- tion is found to be very good. For a typical configuration the 3-dB width of the point response function in the lateral direction is less than a Rayleigh wavelength. But, the res- olution in the axial ( y ) direction is typically 3 to 4 times
worse. The calculations indicate that the leak rate of SAW into the liquid medium affects the resolution of the system in the latter direction. A high-leak-rate material will result in a better resolution in the y direction. It is seen that for cylindrical flaws with large radius the signal drops about 20 dB when the center of the cylinder is offset laterally one radius from focal point. Hence, this 20-dB point can be used to ascertain the size of the flaws. For small size cylinders the lateral variation of the signal is the same except for the strong dependence of the signal level. Asymptomatically, there is about 10-dB drop per halving
of the flaw radius. Thus, for small cylinders the received peak amplitude can be used to determine the size of the cylinder. The presented theory also predicts an enhance- ment in the received signal level when the cylinder cir- cumference equals a SAW wavelength, again consistent with experimental observations.
The response of other imaging systems utilizing leaky
SAW or other leaky waves can be found with slight mod-
ification of the theory given here. Since the point response function can be calculated, standard image processing
techniques such as the deconvolution operation can be uti- lized to improve the resolution of the images obtained with such systems.
ACKNOWLEDGMENT
The authors would like to acknowledge Dr. H . Koymen for his comments and discussions and B. Baygiin and F . Siiriicii for their contributions at the beginning of this study.
APPENDIX
On the Representation of Plane and Cylindrical SA W's by Two-Dimensional Potentials
Consider an elastic medium occupying the half space for
z
<
0. First assume that there is no leakage toz
>
0 region, i.e.,z
= 0 is a free-surface.A two-dimensional Rayleigh Potential u ( x , y ) satisfy- ing
where kR = w / V R is the Rayleigh wave number can be used to represent the surface wave. The solution of (30) is in the form
exp ( jk,x) exp ( jk,y) with k.:
+
k t = k;.The complete expressions for the x , y ,
z
components of the particle velocity vector, U , can then be written asGUNALP AND ATALAR: RESPONSE OF ACOUSTIC IMAGING SYSTEMS 515
where h 2 = k i - ( w / V ~ ) ~ , V, is the longitudinal wave velocity, and k 2 = k i - ( W / Vs)* and V , is the shear wave
velocity.
This is an exact formulation which combines shear and longitudinal waves in the solid to form the Rayleigh wave. It can be easily verified by using the particle velocity components given by (31) that
TI, = T,, = T, = 0 at
z
= 0.In a similar way, a two-dimensional potential satisfying
can be used to represent cylindrical SAW’S. The solution of (32) is in the form
Z n ( k R p ) exp
( j n 6 >
where Z,, stands for the appropriate Bessel or Hankel func- tion. The particle velocity vector is expressed as
v,
=h(z)
U ( P ?4 )
=h(z)
Zn(kRP)
exp(j.4)
( 3 3 ) wherefl ( z ) andf2(z) are same as before. It can be shown that above solutions guarantee the boundary conditions T,,
-
- T,, = T,, = 0 at z = 0. Expressions equivalent to (33) can be found in literature [36].
When there is leakage to the upper half-space
( z
>
0 ) , and dissipation in the solid, using a perturbational ap- proach, kR in the u ( x , y ) and U ( p ,4 )
expressions is re- placed by kR+
j a r ; butf,
( z )
a n d f 2 ( z ) expressions can be used without any change.REFERENCES
R. J . Dewhurst, A. D. W. McKie, and S . B. Palmer, “Further evi-
dence for two-component surface-acoustic-wave reflections from sur-
face breaking cracks,” Appl. Phys. Lett., vol. 49, pp. 1694-1695, 1986.
W. Parmon and H . L. Bertoni, “Ray interpretation of the material
signature in the acoustic microscope,” Elecr. Lett., vol. 15, pp. 685- 686, 1979.
K. Yamanaka and Y. Enomoto, “Observation of surface cracks with scanning acoustic microscope,” J . Appl. Phys., vol. 53. pp. 846-
850, 1982.
K. Yamanaka, Y. Enomoto, and Y. Tsuya, “Acoustic microscopy of ceramic surfaces,” IEEE Trans. Son. Ultrason., vol. SU-32, pp. 313-
319, 1985.
G. C. Smith and M . G. Gee, “Observation of a sub-surface defect in s c o p e , ” J . Mater. Sci. Lerr., vol. 5 , pp. 1133-1134, 1986.
sapphire by Rayleigh wave reflection i n the scanning-acoustic-micro- A. Atalar, H. Koymen, and 0. YemiSGiler, “Measurement of sensi- tivity of different wave modes to subsurface defects,” in Proc. 1988
IEEE Ultrason. Symp., 1988.
I . R. Smith, H . K. Wickramasinghe, G. W . Farnell, and C. K . Jen,
”Confocal surface-acoustic-wave microscopy,” Appl. Phys. Lett.,
vol. 42. DD. 411-413. 1983.
B . Nongaillard. M. Ourak, J . M. Rouvaen, M. Houze, and E. Bri- doux, “A new focusing method for nondestructive evaluation by sur- face-acoustic-wave,”J. Appl. Phys., vol. 5 5 . pp. 75-79, 1984.
C. K. Jen, P. Cielo, 1. Bussiere, F. Nadeau, and G . W. Farnell, “Phase variation of focused surface-acoustic-wave,” Appl. Phvs. Lett., vol. 46, pp. 241-243, 1985.
P. Cielo, F. Nadeau, and M. Lamontagne, “Laser generation of con- vergent acoustic waves for materials inspection,” Ultrasonics, vol.
P. Cielo, C. K. Jen, and X . Maldague, “The converging surface-
acoustic-wave technique: Analysis and applications to nondestructive evaluation,” Can. J . Phys., vol. 64, pp. 1324-1329, 1986.
X. Maldague. P. Cielo, and C. K. Jen, ”NDT applications of laser- generated focused acoustic waves,” Material Evaluation, vol. 44, pp. H . Koymen and A. Atalar, “Focusing surface waves using an axi- con,” Appl. Phys. Left., vol. 47, pp. 1266-1268, 1985.
Proc. of I987IEEE Ulrrason. Symp., pp. 301-304, 1987.
S . Ayter, “Focusing surface waves using conical transducers,” in W . P. Robbins, R. K. Mueller, and E. Rudd, “Thin-film character- ization using a scanning laser acoustic microscope with surface-
acoustic-waves,” IEEE Trans. Ultrason. Ferroelec. Frey. Conrr., A. L. Fang, “Scattering of a cylindrical wave of sound by an elastic cylinder,” Acusrica. vol. 13, pp. 397-402. 1963.
N. N . Bojarski. “Scattering by a cylinder: A fast exact numerical solution,” J . Acousr. Soc. A m . , vol. 75, pp, 320-323. 1984. T. J . Cavicchi and W. D. O’Brien, “Acoustic scattering of an inci- dent cylindrical wave by an infinite circular cylinder,” IEEE Trans.
Ulrrason. Ferroelec. Freq. Contr., vol. 35, no 1, pp. 78-80, Jan. 1988.
A. Atalar and H. Koymen, “Use of a conical axicon as a surface- 23, pp. 55-62, 1985.
1120-1124, 1986.
vol. 35. pp. 477-483, 1988.
acoustic-wave focusing device,” ZEEE Trans. Ultrason. Ferroelecr. Freq. Contr., vol. UFFC 34, no. I , pp. 53-63, Jan. 1987.
(201 J. W. Goodman, Fourier Optics. New York: LMcGraw-Hill, 1968. (211 H. L. Bertoni, “Ray-Optical Evaluation of V ( Z ) in the Reflection
Acoustic Microscope,” IEEE Trans. Son. Ultrason., vol. SU-31, pp.
(221 A. Atalar and H. Koymen, “ V ( Z ) of the surface-acoustic-wave fo-
cusing system,” in IEEE 1986 Ultrason. Symp. Proc., 1986, pp. 727-
730.
~~ ~ ~~
105-1 16, 1984.
1231 J. J . Stamnes. “Focusing of two-dimensional waves,” 1. Opr. Soc.
1241 N . Gunalp, “Transformation formulas between two-dimensional alane A m . , vol. 71, pp. 15-31, 1981.
wave spectra and cylindrical wave expansions,” to be published. F. C. Cuozzo. E. L. Cambiaggio, J.-P. Damjano, and E. Rivier, “ln- fluence of elastic properties on Rayleigh wave scattering by normal discontinuities,” IEEE Trans. Sonics. Ultrason., vol. SU-24, pp.
S . Ayter, “Scattering of Rayleigh waves from surface breaking cracks Stanford, CA, June 1983.
in the high frequency regime,” Ph.D. Thesis, Stanford University, Y . C. Angel and J. D. Achenbach, “Reflection and transmission of obliquely incident Rayleigh waves by a surface-breaking crack,” J . Acousr. Soc. A m . , vol. 75, pp. 313-319, 1984.
B . Q. Vu and V . K. Kinra, “Diffraction of Rayleigh waves in a half- space. I . Normal edge crack.” J . Acoust. Soc. A m . , vol. 77, pp. 1425-
1430, 1985.
A. Gautesen, “Scattering of an obliquely incident Rayleigh wave i n an elastic quarterspace,” Wave Morion, vol. 8, pp. 27-41, 1986.
V . K. Kinra and B. Q. V u , “Diffraction of Rayleigh waves in a half- space. 11. Inclined edge crack,” J . Acoust. Soc. A m . , vol. 79, pp. A. Gautesen, “Scattering of a Rayleigh wave by an elastic wedge,”
Wave Morion, vol. 9, pp. 51-59, 1987.
P. C . Waterman, “New formulation of acoustic scattering,” J . Acoust. Soc. A m . , vol. 45, pp. 1417-1429, 1969.
N . Gunalp (Tarhan), “Acoustic and electromagnetic scattering from cylinders buried in a half-space,” Ph.D. Thesis, Middle East Tech. Univ., Ankara, Turkey, 1981.
A. Atalar, “A backscattering formula for acoustic transducers,” J . Appl. Phys., vol. 51, pp. 3093-3098, 1980.
Y. H . Pao and W . Sachse, “Interpretation of time records and power
spectra of scattered ultrasonic pulses in solids,” J . Acousf. Soc. A m . ,
vol. 56, pp. 1478-1486, 1974. 280-289, 1977.
516 IEEE TRANSACTIONS ON ULTRASONICS. FERROEI-ECTRICS. A N D FREQUENCY CONTROL. VOL. 36, NO. S. SEPTEMBER 1989
(361 A . Safaai-Jazi, C.-K. Jen and G . W. Farnell. “On the excitation of
time harmonic cylindrical surface-acoustic-waves.” I E E E Trcrt7.c. U / -
tru.mn. Ferrrwler,. Frey. Contr.. vol. UFFC-33. no. 4. pp. 471-477. July 1986.
electromagnetic and ac magnetics.
Nilgiin Giinalp was born in Nigde, Turkey, i n
1952. She recelved B . S . . M.S. and Ph.D. degrees in electrical engineering from Middle East Tech- nical University (METU), Ankara. Turkey i n
1973, 1976. and 1982. respectively.
Since 1973, she ha\ been affiliated with METU as a research assistant and instructor. From 1982 to 1984 she was with the Department of Electrical and Computer Engineering, Illinois Institute ot
Technology, Chicago, IL. She is now an Associ- ate Professor at METU. Her research interests are :oustic scattering, and numerical methods in electro-
Abdullah Atalar (”88) wa\ horn in Gaziantep,
Turkey. i n 1954. He received the B.S. degree from Middle East T e c h n d University, Ankara. Tur- key in 1974. M . S . and Ph.D. degrees from Stan- ford University, Stanford. CA, in 1976 and 1978, respectively. a l l i n electrical engineering; hi\ the- sis work w a s on reflection acoustic microscopy.
From 1978 to 1980 hc was first a Post Doctoral Fellow and later an Engineerins Research Asso- ciate i n Stanford University continuing his work on acoustic microscopy. For eight months he was with Hewlett Packard Labs. Pnlo Alto. CA. engaged in photoacoustics re- \earch. I n 1980 he joined the Middle Eaat Technical University as an As- sijtant Professor. From 1982 to 1983 on leave from University. he was with Ernst Leitz Wetzlar. Wctzlar, FRG. where he was involved in the development of the commercial acoustic microscope. He is presently an Associate Profehsor and Chairman o f thc Electrical and Electronics Engi- neering Department at Bilkent University, Ankara. Turkey. His current rejearch interests include acouhtic imaging, linear acoustic\. and computer aided design In electrical engineering.
Dr. Atalar \cas awarded H . Tugap Foundation Award o f Tubitak. Tur- key for hls contributions to acoustic microscopy in 1984.