Bioscience Reports, Vol. 15, No. 4, 1995
IR and Turbidity Studies
Cholesterol-Phospholipid
Interactions
of Vitamin E-
Membrane
Feride Severcan, ~'5 Nadide Kazanci, 2 lJlkii Baykal, 3 and ~efik Siizer 4
Received June 20, 1995
Binary and tertiary mixture of o~-tocophenol, cholesterol and dimyristoylphosphatidylcholine in the form of multilamellar liposomes were investigated by Fourier Transform Infrared and visible spectroscopy. Results of the FTIR and turbidity experiments indicate that a T decreases or diminishes the effect of cholesterol on the frequency and the bandwidth of the C-H stretching, CH 2 scissoring and ~ O stretching bands in FTIR spectra and the turbidity measurements (recorded as absorbance values at 440 nm) in phospholipid model membranes.
KEY WORDS: vitamin E; cholesterol; phospholipid liposomes; phospholipid membrane; UV/visible
spectroscopy; FI'IR spectroscopy; turbidity.
INTRODUCTION
The accumulation of lipid material such as cholesterol in arterial tissue produce lesions or plaques that are associated with arterial blockage and arterosclerosis. Studies have shown that vitamin E supplementation significantly decreased induced platelet aggregation and reduced elevated platelet aggregation rate in patients with high blood lipid levels [1, 2]. The use of vitamin E in treatment and prevention of several diseases, including cardiovascular disorders, has been mainly explained, so far, by considering its role in the prevention or minimization of free radical damage [3, 4]. Vitamin E is a generic name for a group of naturally occuring substances found mainly in plant oils. The alpha-form of vitamin E with three methyl groups on the chromanal nucleus, d-a-tocopherol (aT), is the
1 Middle East Technical University, Department of Biological Sciences, 06531, Ankara, Turkey. 2 Ege University, Faculty of Science, Department of Physics, 35100, Bornova-lzmir, Turkey. 3 Middle East Technical University, Department of Chemistry, 06531, Ankara, Turkey. 4 Bilkent University, Department of Chemistry, 06533, Ankara, Turkey.
5 To whom correspondence should be addressed. 221
major biological dietary component with prominent antioxidant activity [5]. Recently it has been proposed that there may be a correlation between structural and dynamical membrane properties of vitamin E and its antioxidant potency [6-8]. However, the exact molecular mechanism behind such diverse biological functions of vitamin E is not clearly known.
An understanding of the interaction between aT, cholesterol and phos- pholipids will be important in reversing or preventing such excess arterial deposits. To elucidate this, binary and tertiary mixture of aT, cholesterol and dimyristoyl phosphatidylcholine (DMPC) multilamellar liposomes (MLV) were investigated by Fourier Transform Infrared (FTIR) spectroscopic technique and turbidity studies.
MATERIALS A N D METHODS
d-a-tocopherol, cholesterol and dimyristoyl-L-a-phosphatidylcholine (DMPC) were purchased from Sigma (St. Louis, Mo) and were used without further purification. All other chemicals used in this work were of analytical grade.
For infrared measurements, pure phospholipid multilamellar liposomes were prepared according to the procedure reported in Severcan and Cannistraro [9], but with reduced amount (80%) of hydration. Dry films of 10mg lipid were hydrated by adding 40/zl of 10mM phosphate buffer, pH7.1, a T and/or cholesterol-containing liposomes were prepared with exactly the same procedure; but in this case, at the beginning of the sample preparation, a T dissolved in ethanol and cholesterol dissolved in chloroform were first put into the round- bottomed flask, excess of organic solvents was evaporated by nitrogen" flux, phospholipid was added and the same procedure was then followed for obtaining dry film and MLV [9]. Infrared spectra were obtained using a BOMEM. MB-102 FT-IR spectrometer. 20/zl of samples suspension were placed between CaF2 windows with 12 ~zm sample thickness. Interferograms were averaged for 100 scans at 2 cm -~ resolution. Temperature was regulated by a homemade tempera- ture controller unit. The samples were incubated for 10 minutes at each temperature before the scan of the spectrum.
The lipid mixture for the turbidity measurements was prepared by a procedure similar to that for infrared experiments. But in this case thin films obtained from 3 mg of phospholipid were hydrated by adding 3 ml of 10 mM phosphate buffer at pH7.1. Turbidity measurements were carried out on a Shimadzu A160 Spectrometer by using phosphate buffer as a reference. Temp- erature was regulated by a circulating water bath which was calibrated with a thermocouple inserted in one of the cuvvettes before membrane experiments have been performed. The temperature was varied from 8~ to 46~ with in 2~ intervals and the samples were incubated for 10 minutes before recording of the absorbance value.
Studies of Vitamin E-Cholesterol-Phospholipid Membrane Interactions 223 RESULTS AND DISCUSSION
FF-IR Studies
The infrared spectra of lipids have been studied in detail and most bands have been assigned [10-12]. Various kinds of information can be derived from these bands. Frequency shifts in different regions (symmetric, antisymmetric stretching or bending, scissoring) or changes in the widths of the corresponding peaks can be used to extract information about various physicochemical processes taking place. For example, the frequencies of the CH2 stretching bands of acyl chains depend on the degree of conformational disorder and hence can be used to monitor the average trans/gauche isomerization in the systems. The shifts to higher wavenumbers correspond to an increase in number of gauche conformers [10-12]. Bandwidth gives dynamic information about the system [12]. As the bandwidth increases, mobility of the phospholipid acyl chains increases.
The infrared spectra of DMPC multilamellar liposomes, both pure and containing 20 mol% a T and/or 20mo1% cholesterol were investigated at three different temperature corresponding to the gel phase, main phase transition region and liquid crystalline phase. The C-H stretching modes, the CH2 scissoring mode and the C - - O stretching mode were considered. The results presented here refer to the effect of cholesterol and o~T on DMPC spectra since the actual amounts of a T and cholesterol are smaller in comparison with DMPC.
C-H Stretching Region
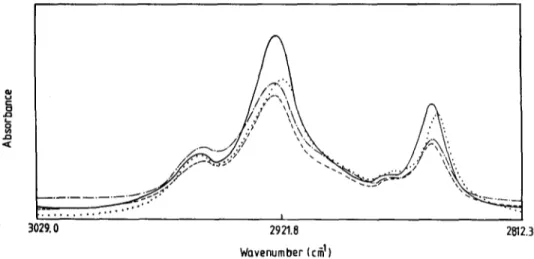
Figure 1 shows the infrared spectra of DMPC liposomes in the absence and presence of cholesterol and/or a T in the C-H region at 23~ The strong
i
3029. 0 2921.8 2B12.3
Wavenumber (c~ 1 )
Fig. 1. Infrared spectra of the C-H stretching region of DMPC liposomes at 24~ (--) Pure DMPC;
(- - -) DMPC containing 20 mol% of a-tocopherol; ( .... ) DMPC containing 20 mol% of cholesterol; ( . . . ) DMPC containing 20 mol% of a-tocopherol and 20 mol% of cholesterol.
Table I. The frequency values of the C-H stretching bands for pure and 20 mol% cholesterol and/or 20 mol% otT containing DMPC liposomes at different temperatures. Lipid CH 2 antisymmetric CH 2 symmetric CH 3 antisymmetric stretching (cm 1) stretching (cm -1) stretching (cm ') 10~ 24~ 35~ 10~ 24~ 35~ 10~ 24~ 35~ DMPC 2918.74 2921.93 2923.44 2850.35 2852.18 2853.39 2955.69 2956.54 2956.02 DMPC+~T 2922.23 2923.09 2923.88 2852.12 2852.48 2853.30 2955.05 2957.00 2954.95 DMPC+ chol. 2919.12 2919.68 2922.15 2850.00 2850.01 2851.47 2955.95 2956.27 2955.99 DMPC + aT + chol. 2921.72 2923.00 2923.92 2851.21 2851.87 2852.57 2954.55 2954.78 2954.46
Studies of Vitamin E-Cholesterol-Phospholipid Membrane Interactions 225 bands appear around 2920cm -a and 2850cm -1 correspond to the CH2 anti- symmetric and symmetric stretching modes of acyl chains of the phospholipid, respectively. The minor bands at around 2956 cm -1 are due to the asymmetric stretching mode of terminal CH3 groups. The infrared spectra of DMPC liposomes containing cholesterol and/or a T at 10~ and 35~ are not shown in the figure.
Table I shows the frequency values of C-H stretching modes of DMPC liposomes in the absence and presence of 20 mol% cholesterol and/or 20 mol% a T at different temperatures. Investigation of the CH2 antisymmetric stretching and symmetric stretching modes reveals that in the gel phase, addition of a T into DMPC system increases the frequency which implies than the number of gauche conformers (disordering) increases in the system. Cholesterol has a negligible effect. However, when both of them are present together in the system, an increase in the frequency with respect to pure DMPC is observed. At 24~ a T increases frequency (increase disorder), cholesterol decreases frequency (increase order). When they are together in the system, an increase in the frequency is observed. In the liquid crystalline phase cholesterol decreases frequency. The effect of a T on frequency is negligible. When a T is added to cholesterol containing DMPC liposomes the wavenumbers shift from lower to higher values, indicating that a T reduces the effect of cholesterol by increasing the number of gauche rotamers in the system.
In the literature, it is proposed that the
CH2
symmetric stretching mode near 2850 cm -1 is of special significance because of its sensitivity to the changes in mobility and in conformational disorder of the hydrocarbon chains. The band- width parameter measured from theCH2
symmetric stretching region reflects the changes in the system better than theCH2
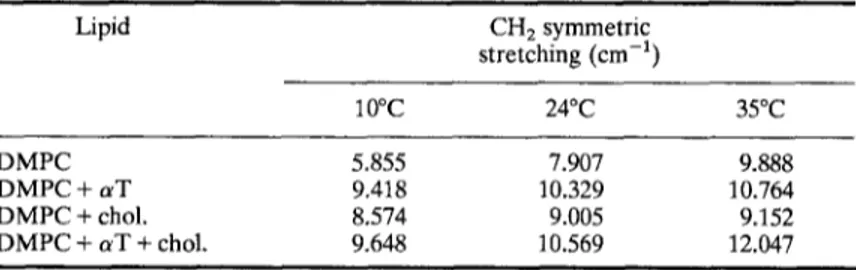
antisymmetric stretching region [12]. The bandwidth values of the CH: symmetric stretching mode at 0.75 x peak height are listed in Table II for different temperatures. The bandwidth data indicate that, cholesterol increases bandwidth (mobility) in the gel and decreases bandwidth (mobility) in the liquid crystalline phase. On the other hand, a T increases mobility both in the gel and in the liquid crystalline phase. However, when cholesterol and a T are present in the system together, the bandwidthTable II. The bandwidth values of the CH 2 symmetric stretching bands for
DMPC liposomes in the absence and presence of 20 mol% a T and/or 20 tool% cholesterol at different temperatures
Lipid CH 2 symmetric stretching (cm -a) 10~ 24~ 35~ DMPC 5.855 7.907 9.888 DMPC + a T 9.418 10.329 10.764 DMPC + chol. 8.574 9.005 9.152 DMPC + a T + chol. 9.648 10.569 12.047
increment is more than the bandwidth increment when they are present individually. For aT, our results conflict with the previous N M R and ESR results where it was stated that a T decreases membrane fluidity [13, 14]. This dis- crepancy between FTIR and other techniques may be due to the existence of subphases occuring in vitamin E-phospholipid binary mixtures which are named as vitamin E poor and vitamin E rich phases [9]. FTIR may monitor preferentially one of these subphases.
Frequences of C H 3 antisymmetric stretching mode of DMPC liposomes in the absence and presence of 20 tool% cholesterol and/or 20mo1% a T at three different temperatures are given in Table I. The band provides a monitor of the center of the bilayer [15]. The increase in frequency with increasing temperature, reflects increasing librational freedom of the acyl chains in the central area of the bilayer [15]. In the gel phase effect of a T and cholesterol on the frequency of terminal methyl group is negligible. In the liquid crystalline phase both a T and cholesterol decrease the frequency. The decrease in frequency is more profound for aT-containing DMPC liposomes. With the copresence of a T and cholesterol an additional decrease in the frequency is observed. These results indicate that in the liquid crystalline phase cholesterol and a T decreases the dynamics of the deep interior of the bilayer.
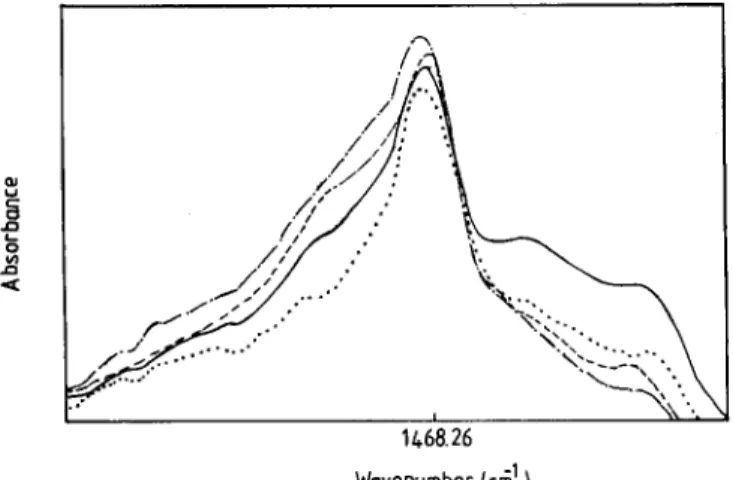
Figure 2 shows the infrared spectra of the CH2 scissoring mode of DMPC, pure and containing a T and/or cholesterol liposomes at 35~ As can be seen the inclusion of cholesterol decreases the width of the band. The opposite effect is observed with the inclusion of c~T. When both a T and cholesterol are present in the system, an additional increase in bandwidth is observed, suggesting an increase in the conformational disorder and chain rotation. The figure also indicates that the presence of a T or cholesterol individually or together cause
6 " / : '~
o .~
/
"-x~.
1468.26
Wovenumber (cn~ I )
Fig. 2. Infrared spectra of the CH2 scissoring mode of DMPC at 24~ (--) Pure DMPC; ( - - - ) DMPC containing 20 mol% of a-tocopherol; ( . . . . ) DMPC containing 20moi% of cholesterol; ( . . . ) DMPC containing 20 mol% of a-tocopherol and 20 mol% of cholesterol.
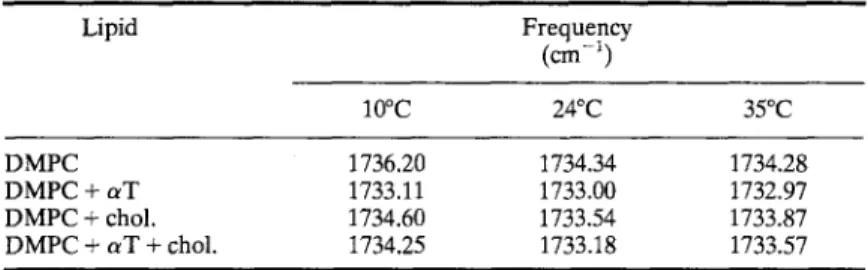
Studies of Vitamin E-Cholesterol-Phospholipid Membrane Interactions 227 Table IlL The frequency values of the C~--~-O stretching mode of DMPC
liposomes in the absence and presence of 20mo1% aT and/or 20mo1% cholesterol at different temperatures
Lipid Frequency (crn -~) 10~ 24~ 35~ DMPC 1736.20 1734.34 1734.28 DMPC + aT 1733.11 1733.00 1732.97 DMPC + chol. 1734.60 1733.54 1733.87 DMPC + aT + chol. 1734.25 1733.18 1733.57
substantial difference in the shape of the CH2 scissoring band counters. Similar behaviour is observed in the gel phase and in the main phase transition region.
A red shift in frequency of C-~-O stretching mode reflects the existence of hydrogen bonding [16]. Table III shows the variation of ~ O vibrational frequency at different temperatures. As seen from the table, the frequencies of the peaks follow the order, DMPC > cholesterol > a T + cholesterol > a T which indicates that a T makes stronger hydrogen bonding than cholesterol with the carbonyl oxygens of phosphatidylcholine. This result is in agreement with a previous study [17]. When a T and cholesterol are present in the system, the dominant effect of a T is observed.
Turbidity Measurements
Figure 3 shows the temperature dependence of the absorbance values at 440 nm for pure and 20 tool% a T and/or 20 mol% cholesterol containing DMPC liposomes. As seen from the figure, with the incorporation of a T or cholesterol, midpoint temperature of the transition shifts to lower degrees and a broadening in the phase transition curve is observed which are in agreement with previous studies [14, 18, 19]. When both a T and cholesterol are present in t h e - D M P C liposomes, with the same mol%, the phase transition curve completely overlaps with DMPC curve; the shift in midpoint temperature diminishes and the curve returns to its original shape which indicates that the system behaves as if there is no cholesterol and a T in the system. The absorbance of a T and cholesterol is observed to decrease in the gel phase and increase in the liquid crystal phase. When both of them are present in the system, in both phases, absorbance values are very close to those of DMPC, indicating that the system again behaves as if there is no cholesterol and a T in the system. Although there is no definite empirical rule related with increasing and decreasing behaviour of absorbance, we may suggest that the decrease in absorbance may monitor the increment in gauche conformers which indicates disordering, and an increase in absorbance value may correspond to a decrease in gauche conformers indicating an increase in ordering. By using this assumption, the present results indicate that a T and cholesterol decrease order considerably in the gel phase, but increase order
1.&S =E 1.25 1.05 Z co ,-,.. O " 0.85 0.65 0.45 t 0.25 / 10 O & O W 011 O N O
o 0 mol% chol. and AT o 20 mol%~T a 20 mol% thai.
w 20mo1% thai. + 20mo1%r
O O a@ & / x I I I 1'5 20 215 30 315 ~0 TEMPERATURE ( ' [ )
Fig. 3. Temperature dependence of absorbance at 440 nm for DMPC liposomes in the absence and presence of aT and cholesterol.
slightly in the liquid crystalline phase. With the addition of a T to cholesterol- containing liposomes, disordering and ordering effect of a T and cholesterol diminish and a curve similar to that of DMPC is obtained.
With our present knowledge it is quite difficult to give an explanation for the results presented here. a T molecules, consisting of a rigid polar head with a branched hydrophobic tail, have been shown to be located in the membrane bilayer with their hydrophobic tail embedded inside the membrane and with the 6-OH and 5-CH3 groups from the polar head very close to the membrane surface [20, 21]. The polar hydroxyl group of cholesterol at C-3 is located in the aqueous interface and for this reason the polar head group should be localized within a reasonably close lateral distance to the membrane surface. The long axis of the cholesterol molecule is thus perpendicular to the plane of the membrane, and parallel with the acyl chains of conjugated membrane lipids [22]. With such a picture in mind we can speculate that in tertiary mixtures of aT, cholesterol and DMPC, a T and cholesterol may form complexes with fatty acids in lipid bilayers. As a result of this, phospholipid-phospholipid and aT-phospholipid interactions may become more important than cholesterol-phospholipid and aT-cholesterol interactions. For this reason, with the inclusion of a T into cholesterol-containing DMPC liposomes, a T decreases or diminishes the interaction of cholesterol with phospholipid membranes and the system shows dominant effect of a T or behaves as if there is no a T and cholesterol in the system.
Studies of Vitamin E-Cholesterol-Phospholipid Membrane Interactions
ACKNOWLEDGEMENTS
This work is supported by TfJBITAK-TBAG-1168 and METU Fund.
229
Research
REFERENCES
1. Szczeklik, A., Gryglewski, R. J., Domagala, B., et aL (1985) Thromb Haemost 54:425-30. 2. Renaud, S., Ciavatti, M., Perot, L., et aL (1987) Contraception 36:347-58.
3. Packer, L. (1991) Am. J. Clin. Nutr 53:1050S-5S.
4. Packer, L. and Landvik, S. (1989)Ann. N. Y. Acad. Sci 570:1-6.
5. Vitamin E, Handbook of vitamins: Nutritional, Biochemical and Clinical Aspects (1984). Machin, L. J. (ed). Marcel Dekker, N.Y. 99-t45.
6. Serbinova, E., Kagan, V., Han, D. and Packer, L. (1991) Free Radic. Biol. Med. 10:263-275. 7. Suzuki, Y. J., Tsuchiya, M., Wassal, S. R., Choo, Y. M., Govil, G., Kagan, V. E. and Packer, L.
(1993) Biochemistry 32:10692-10699.
8. Burton, G. W. and Ingold, K. U. (1989) Ann. N.Y. Acad. Sci 570;7-21. 9. Severcan, F. and Cannistraro, S. (1988) Chem. Phys. Lipids. 47:129-133.
10. Cameron, D. G., Casal, H. L. and Mantsch, H. H. (1979) J. Biochem. Biophys. Methods 1:21-36. 11. Mantsch, H. H. (1984) in: Spectroscopy of Biological Molecules (C. Sandorfy and T. Theophanides
eds) Reidel Publ. Co. pp: 547-561.
12. Cameron, P. G. and Charette, G. M. (1981) Appl. Spectrosc. 35:224.
13. Wassal, S. R., Wang, L., Yang, McCabe, R. C., Ehringer, W. D. and Stillwell, W. (1991) Chem. Phys. Lipids. 60:29-37.
14. Severcan, F. and Cannistraro, S. (1990) Chem. Phys. Lipids. 53:17-26.
15. Umemura, J., Cameron, D. G. and Mantsch, H. H. (1980) Biochim. Biophys. Acta 602:33-44: 16. Hadzi, D. (1984) in: Spectroscopy of Biological Molecules (C. Sandorfy and T. Theophanides eds)
Reidel Publ. Co., pp. 39-60.
17. Lai, M. Z., Duzgunes, N. and Szoka, F. C. (1985) Biochemistry 24:164. 18. Severcan, F. and Cannistraro, S. (1989) Bio. Sci. Rep. 9:489-495.
19. Presti, F. T., Pace, R. J. and Chen, S. I. (1982) Biochemistry 21:3831-3833.
20. Perly, B., Smith, I. C. P., Hughes, L., Burton, G. W. and Ingold, K. U. (1985) Biochim. Biophys. Acta. 819:131-135.
21. Ekiel, I. H., Hughes, L., Burton, G. W., Jovall, P. A., Ingold, K. U. and Smith, I. C. P. (1988) Biochemistry 27:1432-1440.