High-resolution imaging of elastic properties using
harmonic cantilevers
O. Sahin
a,∗, G. Yaralioglu
a, R. Grow
a, S.F. Zappe
a, A. Atalar
b, C. Quate
a, O. Solgaard
aaE.L. Ginzton Laboratory, Stanford University, Stanford, CA 94305-4085, USA bDepartment of Electrical and Electronics Engineering, Bilkent University, Ankara 06533, Turkey Received 1 July 2003; received in revised form 12 November 2003; accepted 21 November 2003
Available online 21 February 2004
Abstract
We present a micromachined scanning probe cantilever, in which a specific higher-order flexural mode is designed to be resonant at an exact integer multiple of the fundamental resonance frequency. We have fabricated such cantilevers by reducing the stiffness of the third order flexural mode relative to the fundamental mode, and we have demonstrated that these cantilevers enable sensing of non-linear mechanical interactions between the atomically sharp tip at the free end of the cantilever and a surface with unknown mechanical properties in tapping-mode atomic force microscopy. Images of surfaces with large topographical variations show that for such samples harmonic imaging has better resolution than standard tapping-mode imaging.
© 2003 Elsevier B.V. All rights reserved.
Keywords: Atomic force microscope; Tapping-mode; Cantilever; Elastic properties
1. Introduction
Atomic force microscope (AFM)[1]has proven to be an exceptionally useful tool for mapping topography of surfaces at the nanoscale. In an AFM, a flexible cantilever with an atomically sharp tip is brought to the vicinity of a sample surface and the deflections of the cantilever as a result of the attractive and repulsive forces between the tip and the sample are monitored while the cantilever is scanned across the surface.
The earliest AFM imaging techniques required continu-ous contact between the tip and sample, which resulted in frictional forces that damage both the tip and the sample. To overcome this problem, dynamic imaging techniques that do not require continuous tip–sample contact have been in-troduced. Among these, tapping-mode atomic force micro-scope (TM-AFM)[2]has become the most widely used. In TM-AFM (Fig. 1), the cantilever is vibrated at a frequency close to one of its flexural resonances in vicinity of the sur-face under test so that the tip makes intermittent contacts (tapping) with the surface once in every oscillation period. During the scan across the surface, the amplitude of vibra-tion is maintained at a constant value through a feedback
∗Corresponding author. Tel.:+1-650-4980778; fax: +1-650-7252533.
E-mail address: [email protected] (O. Sahin).
loop that adjusts the height of the cantilever base. The feed-back signal therefore reflects the topography of the surface. Apart from high-resolution topography imaging, there has been a great deal of interest in using AFM as a tool to probe the hardness and elasticity at the nanoscale. Imag-ing of elastic properties enables detection of variations in chemical composition across the surface, characterization of thin films, and studies of nanomechanical structures in gen-eral. With an AFM one can measure the contact stiffness between the nano-tip and the sample, which is a measure of the elasticity of the material in the vicinity of the con-tact. Various techniques for measuring contact stiffness has been developed, including quasi-static ones that apply force to the sample and measure the indentation of the surface simultaneously[3,4], and dynamic ones that either vibrate the cantilever or the sample and measure variations in the response of the cantilever which is affected by the elastic-ity of the sample[5–9]. These techniques require continu-ous tip–sample contact and therefore, they pose the same problems as contact-mode imaging. Such techniques are not suitable for imaging soft samples like biological samples and polymers. The techniques that have been demonstrated also have not achieved sufficient sensitivity and simplicity for practical imaging.
Studies of cantilever dynamics in TM-AFM have shown that the vibration spectrum of tapping cantilevers exhibit peaks at integer multiples (higher harmonics) of the excita-0924-4247/$ – see front matter © 2003 Elsevier B.V. All rights reserved.
non-linearity of the tip–sample interaction and carry infor-mation about the mechanical properties of the sample on a nanometer spatial scale[11]. Imaging with these higher harmonics has been demonstrated and the result has shown good contrast based on material properties [12]. Unfortu-nately, the vibration amplitudes of traditional AFM can-tilevers at higher harmonics are too small for practical AFM imaging [13]. Here we report a new micromachined can-tilever, the harmonic cancan-tilever, which will enable practical
Fig. 2. Tip position (a) with respect to sample surface (dashed line) in TM-AFM and tip–sample interaction forces (b). Negative tip displacement means that tip indents the sample surface.
forces and Van der Waals forces. They appear when the tip gets closer to the surface. An illustration of the interaction forces and tip displacement is given in Fig. 2. In general, the attractive forces are higher when the tip retracts. This is either due to a hysteresis in Van der Waals forces or due to formation and disruption of a liquid neck.
The periodic nature of tip–sample forces results in higher-order Fourier components (harmonics) exactly at in-teger multiples of the vibration frequency of the cantilever.
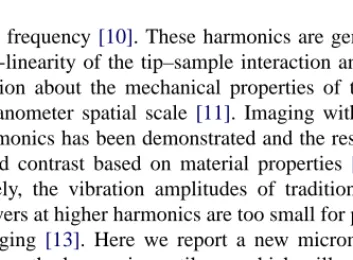
Fig. 3. Tip–sample interaction forces and corresponding Fourier spectrum of forces for (a) 4%; (b) 8% and (c) 12%, contact times. The average forces are normalized to 1 in all three cases.
The magnitudes of these harmonics mainly depend on the contact time and peak force. For illustrative purposes we modeled the sample with a linear spring and neglected the attractive forces. Under these circumstances, the inter-action forces become a clipped sine wave. In Fig. 3, we plot the magnitudes of the harmonic forces calculated with this model for three different contact times, 4, 8 and 12% corresponding to hard medium and soft samples. In order
Fig. 4. Transfer function of a typical AFM cantilever. The cross marks point the location of the harmonic forces that are closest to the resonance frequencies. to compare the three different cases, we assumed that the average force (0th order Fourier component) is the same in all of them[15,16]. Then we normalized the magnitudes of the harmonics to the 0th order Fourier component. These plots show that the higher-order components, especially the ones around 15th harmonic in our example, depend highly on the contact time. Therefore, one can argue that in TM-AFM the information about the sample elasticity
We have designed and fabricated an AFM cantilever with increased vibration amplitude at higher harmonics by match-ing a higher-order natural resonance to an integer multiple of the fundamental resonance frequency. Specifically, we matched the third order flexural resonance frequency to the 16th harmonic of the fundamental. Note that the 16th har-monic is very sensitive to contact time variations (seeFig. 3).
Fig. 6. SEM image of a harmonic cantilever. Width, length and thickness of the cantilever are 50, 300, and 2.2m, respectively. The rectangular opening is 22m × 18 m and centered 190 m away from the cantilever base.
3.1. Design approach
Tuning the resonance frequency of the third order mode is achieved by appropriately removing mass from regions where the cantilever has high mechanical stress in that
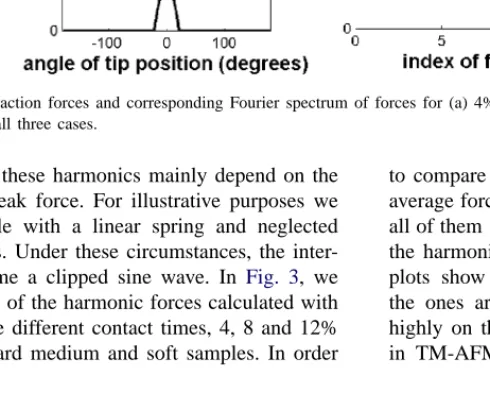
Fig. 7. Process steps of the fabrication of harmonic cantilevers.
particular mode, thereby reducing elastic energy and the resonance frequency of the mode. To illustrate this, the first three flexural mode shapes of a rectangular cantilever with a notch are given inFig. 5. The cantilever is fixed at the base and free at the other end. The notch is located at one of the curved regions of the third mode. Note that this location does not correspond to a highly curved region in the first two modes. Therefore, the effect of the notch in reducing the elastic energy is more prominent in the third mode. In addi-tion to the elastic energy, the kinetic energy in a mode also affects the resonant frequency of a mode. These two forms of energy correspond to the effective spring constant (elas-tic energy) and effective mass (kine(elas-tic energy) of a mode. Since removal of mass changes the mass distribution of the cantilever, it also affects the kinetic energies in each mode. Therefore, the effect of variations in the kinetic energy has to
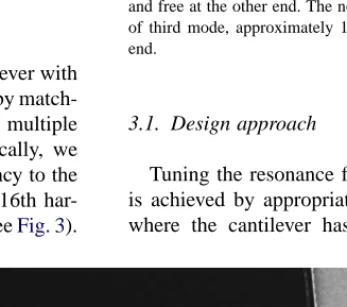
Fig. 8. Vibration spectrum of a harmonic cantilever in tapping-mode AFM. The cantilever is driven at its fundamental resonance frequency (37.4 kHz), and higher-harmonics generation is observed. The second (240 kHz) and third (598 kHz) harmonics coincides with higher resonances and have relatively large signal power.
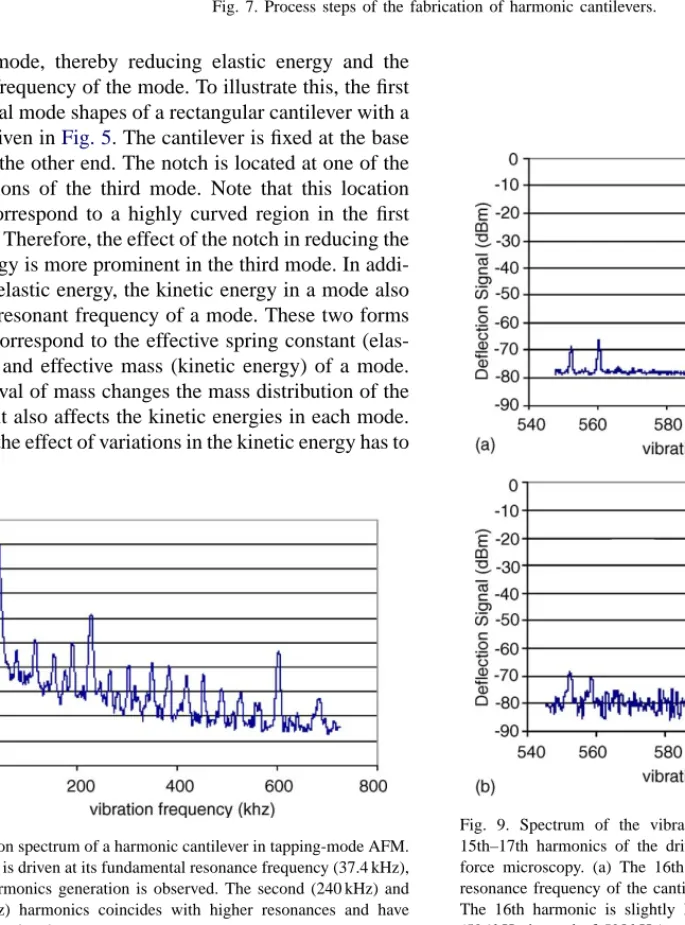
Fig. 9. Spectrum of the vibrations of a harmonic cantilever around 15th–17th harmonics of the driving frequency in tapping-mode atomic force microscopy. (a) The 16th harmonic is exactly equal to the third resonance frequency of the cantilever, recorded at 300 Hz bandwidth. (b) The 16th harmonic is slightly less than the third resonance frequency (596 kHz instead of 598 kHz), recorded at 1 kHz bandwidth.
given inFig. 6. With finite element analysis, the hole in the
Fig. 10. Images of chrome edge on a photomask. The left half of the images is the glass substrate and the right half is the chrome layer. Top: TM-AFM topography image of the surface. Bottom: Image of the same area at the 16th harmonic of the driving frequency. The oscilloscope traces horizontally scan the topography and the 16th harmonic signals.
resonance frequencies. Fortunately, the ratio of the third and fundamental resonances did not change significantly as we expected, so we were able to match the resonances in spite of the fabrication variations.
4. Results and discussion
We performed our experiments with a commercial AFM system (Dimension 3100, Nanoscope III, Veeco, Santa Bar-bara, CA) equipped with an external RF lock-in amplifier (SR844). An external lock-in amplifier is used to detect the signals at the 16th harmonic of the driving frequency. Addi-tionally we used a spectrum analyzer to monitor the vibra-tion spectrum of the cantilever.
InFig. 8the vibration spectrum of a harmonic cantilever in TM-AFM is given. Apart from the signal at the drive frequency, two peaks (#6 and #16) have relatively large signal level compared to their neighbors. These are the har-monics that are closest to the resonance frequencies of the harmonic cantilever. Especially the 16th harmonic has rela-tively higher signal level compared to its neighbors. That is because the frequency of that particular harmonic matches the third resonance frequency of the harmonic cantilever. In Fig. 9, the spectrum around the 15th–17th harmonics is given when third resonance frequency is exactly equal to 16 times the driving frequency (a) and when there is a slight mismatch (b). This result shows that our correctly-designed cantilevers improve the higher-harmonic signal by 15– 20 dB.
In order to demonstrate the sensitivity of imaging at the higher harmonics with harmonic cantilevers, we recorded images of the surface of a photomask with a surface com-posed of borosilicate glass (modulus of elasticity= 63 GPa) and chromium (modulus of elasticity= 248 GPa). InFig. 10 the TM-AFM topography image (top) and the image at the 16th harmonic (bottom) is depicted together with the os-cilloscope traces of the topography and 16th harmonic sig-nal. These figures show that imaging at the 16th harmonic can distinguish between the two materials to a good degree. These images are taken simultaneously and the left side of each image is the glass side and right side is the chromium side.
Since the chromium is stiffer then the borosilicate glass, we expect the contact time to be shorter on chrome side. Fig. 3 suggests that shorter contact time results in larger signals at the 16th harmonic. The oscilloscope traces in Fig. 10 show that the signal at the 16th harmonic is higher on the chrome side as predicted. Additionally, metal traces and/or dust particles on the glass side are quite vis-ible in the 16th harmonic image, demonstrating a better signal-to-noise than in the topographical image. This illus-trates a potential additional advantage of higher-harmonic imaging: Surfaces with large topographical differences can be imaged with better resolution than in standard TM-AFM.
5. Conclusion
The specially micromachined cantilever presented in this report enables tapping-mode higher harmonic imaging, which is proven to be a sensitive technique for measure-ment of elasticity of surfaces at the nanoscale. Higher har-monic imaging in TM-AFM provides a non-destructive and practical way to map elasticity variations across a surface, and might have advantages for high-resolution imaging of samples with large topography variations.
Acknowledgements
This work was supported by the birdseed fund of Stan-ford University Office of Technology Licensing. O. Sahin acknowledges support from a T.J. Rodgers Stanford Gradu-ate Fellowship.
References
[1] G. Binnig, C.F. Quate, Ch. Gerber, Atomic force microscope, Phys. Rev. Lett. 56 (1986) 930.
[2] Q. Zhong, D. Inniss, K. Kjoller, V.B. Elings, Fractured polymer/silica fiber surface studied by tapping mode atomic force microscopy, Surf. Sci. 280 (1993) L688.
[3] P. Maivald, H.J. Butt, S.A.C. Gould, C.B. Prater, B. Drake, J.A. Gurley, V.B. Elings, P.K. Hansma, Using force modulation to image surface elasticities with the atomic force microscope, Nanotechnology 2 (1991) 103.
[4] M. Heuberger, G. Dietler, L. Schlapbach, Mapping the local Young’s modulus by analysis of the elastic deformations occurring in atomic force microscopy, Nanotechnology 5 (1994) 12.
[5] K. Yamanaka, H. Ogiso, O. Kosolov, Ultrasonic force microscopy for nanometer resolution subsurface imaging, Appl. Phys. Lett. 64 (1994) 178.
[6] U. Rabe, K. Janser, W. Arnold, Vibrations of free and surface-coupl3281ed atomic force microscope cantilevers: Theory Exp. Rev. Sci. Instrum., 67 (1996) 3281.
[7] K. Yamanaka, S. Nakano, Ultrasonic atomic force microscope with overtone excitation of cantilever, Jpn. J. Appl. Phys. 35 (1996) 3787. [8] O.V. Kosolov, M.R. Castell, C.D. Marsh, G. Andrew, D. Briggs, T.I. Kamins, R.S. Williams, Imaging the elastic nanostructure of Ge islands by ultrasonic force microscopy, Phys. Rev. Lett. 81 (1998) 1046.
[9] K.B. Crozier, G.G. Yaralioglu, F.L. Degertekin, J.D. Adams, S.C. Minne, C.F. Quate, Thin film characterization by atomic force mi-croscopy at ultrasonic frequencies, Appl. Phys. Lett. 76 (2000) 1950. [10] M. Stark, R.W. Stark, W.M. Heckl, R. Guckenberger, Spectroscopy of anharmonic cantilever oscillations in tapping-mode atomic-force microscopy, Appl. Phys. Lett. 77 (2000) 3293.
[11] O. Sahin, A. Atalar, Simulation of higher harmonics generation in tapping-mode atomic force microscopy, Appl. Phys. Lett. 79 (2001) 4455.
[12] R. Hillenbrand, M. Stark, R. Guckenberger, Higher-harmonics gen-eration in tapping-mode atomic force microscopy: insights into tip-sample interaction, Appl. Phys. Lett. 76 (2000) 3478.
[13] T.R. Rodriguez, R. Garcia, Tip motion in amplitude modulation (tap-ping mode) atomic force microscopy: comparison between continu-ous and point mass models, Appl. Phys. Lett. 80 (2002) 1646. [14] J. Tamayo, R. Garcia, Deformation, contact time, and phase contrast
R. Grow received the BA degree in physics from Colorado College,
Col-orado Springs, in 1996 and is currently working towards the PhD degree in applied physics at Stanford University, Stanford, CA. His research in-terests include cantilevers, lithography, MEMS, and nanotechnology.
S.F. Zappe received his Diploma degree in electrical engineering from
the Berlin University of Technology, Germany, in 1996. From 1996 until 2001 he worked as a PhD student at the Microsensor and Actuator Cen-ter, Berlin University of Technology. In February 2001, S.F. Zappe joined as a postdoctoral researcher to the Stanford Microphotonics Laboratory, Stanford University, CA. His research activities include microfluidic sys-tems for cell and embryo handling, sorting and micro-injection; biology of fruit fly development; gene silencing by means of RNAi (RNA in-terference); micro-orifices for DNA shearing; micro-fluidic system based re-usable arrays for DNA sequencing; integration of active and passive optical components into microsystems.
Society, and a Foreign Member of the Royal Society London. He has received the IEEE Morris N. Liebmann Award in 1981, the Rank Prize for opto-electronics in 1982, the IEEE Medal of Honor in 1988, the President’s National Medal of Science in 1992, and the American Physical Society Keithley Award in 2000.
O. Solgaard received a BS degree in electrical engineering from the
Nor-wegian Institute of Technology, and MS and PhD degrees in electrical engineering from Stanford University, California. He held a postdoctoral position at the University of California at Berkeley and an assistant pro-fessorship at the University of California at Davis before joining the fac-ulty of the Department of Electrical Engineering at Stanford University in July 1999. His research areas are optical communication and sens-ing applications of MEMS. He has authored more than 100 technical publications and holds 13 patents. He is a co-founder of Silicon Light Machines, Sunnyvale, California, and an active consultant in the MEMS industry.